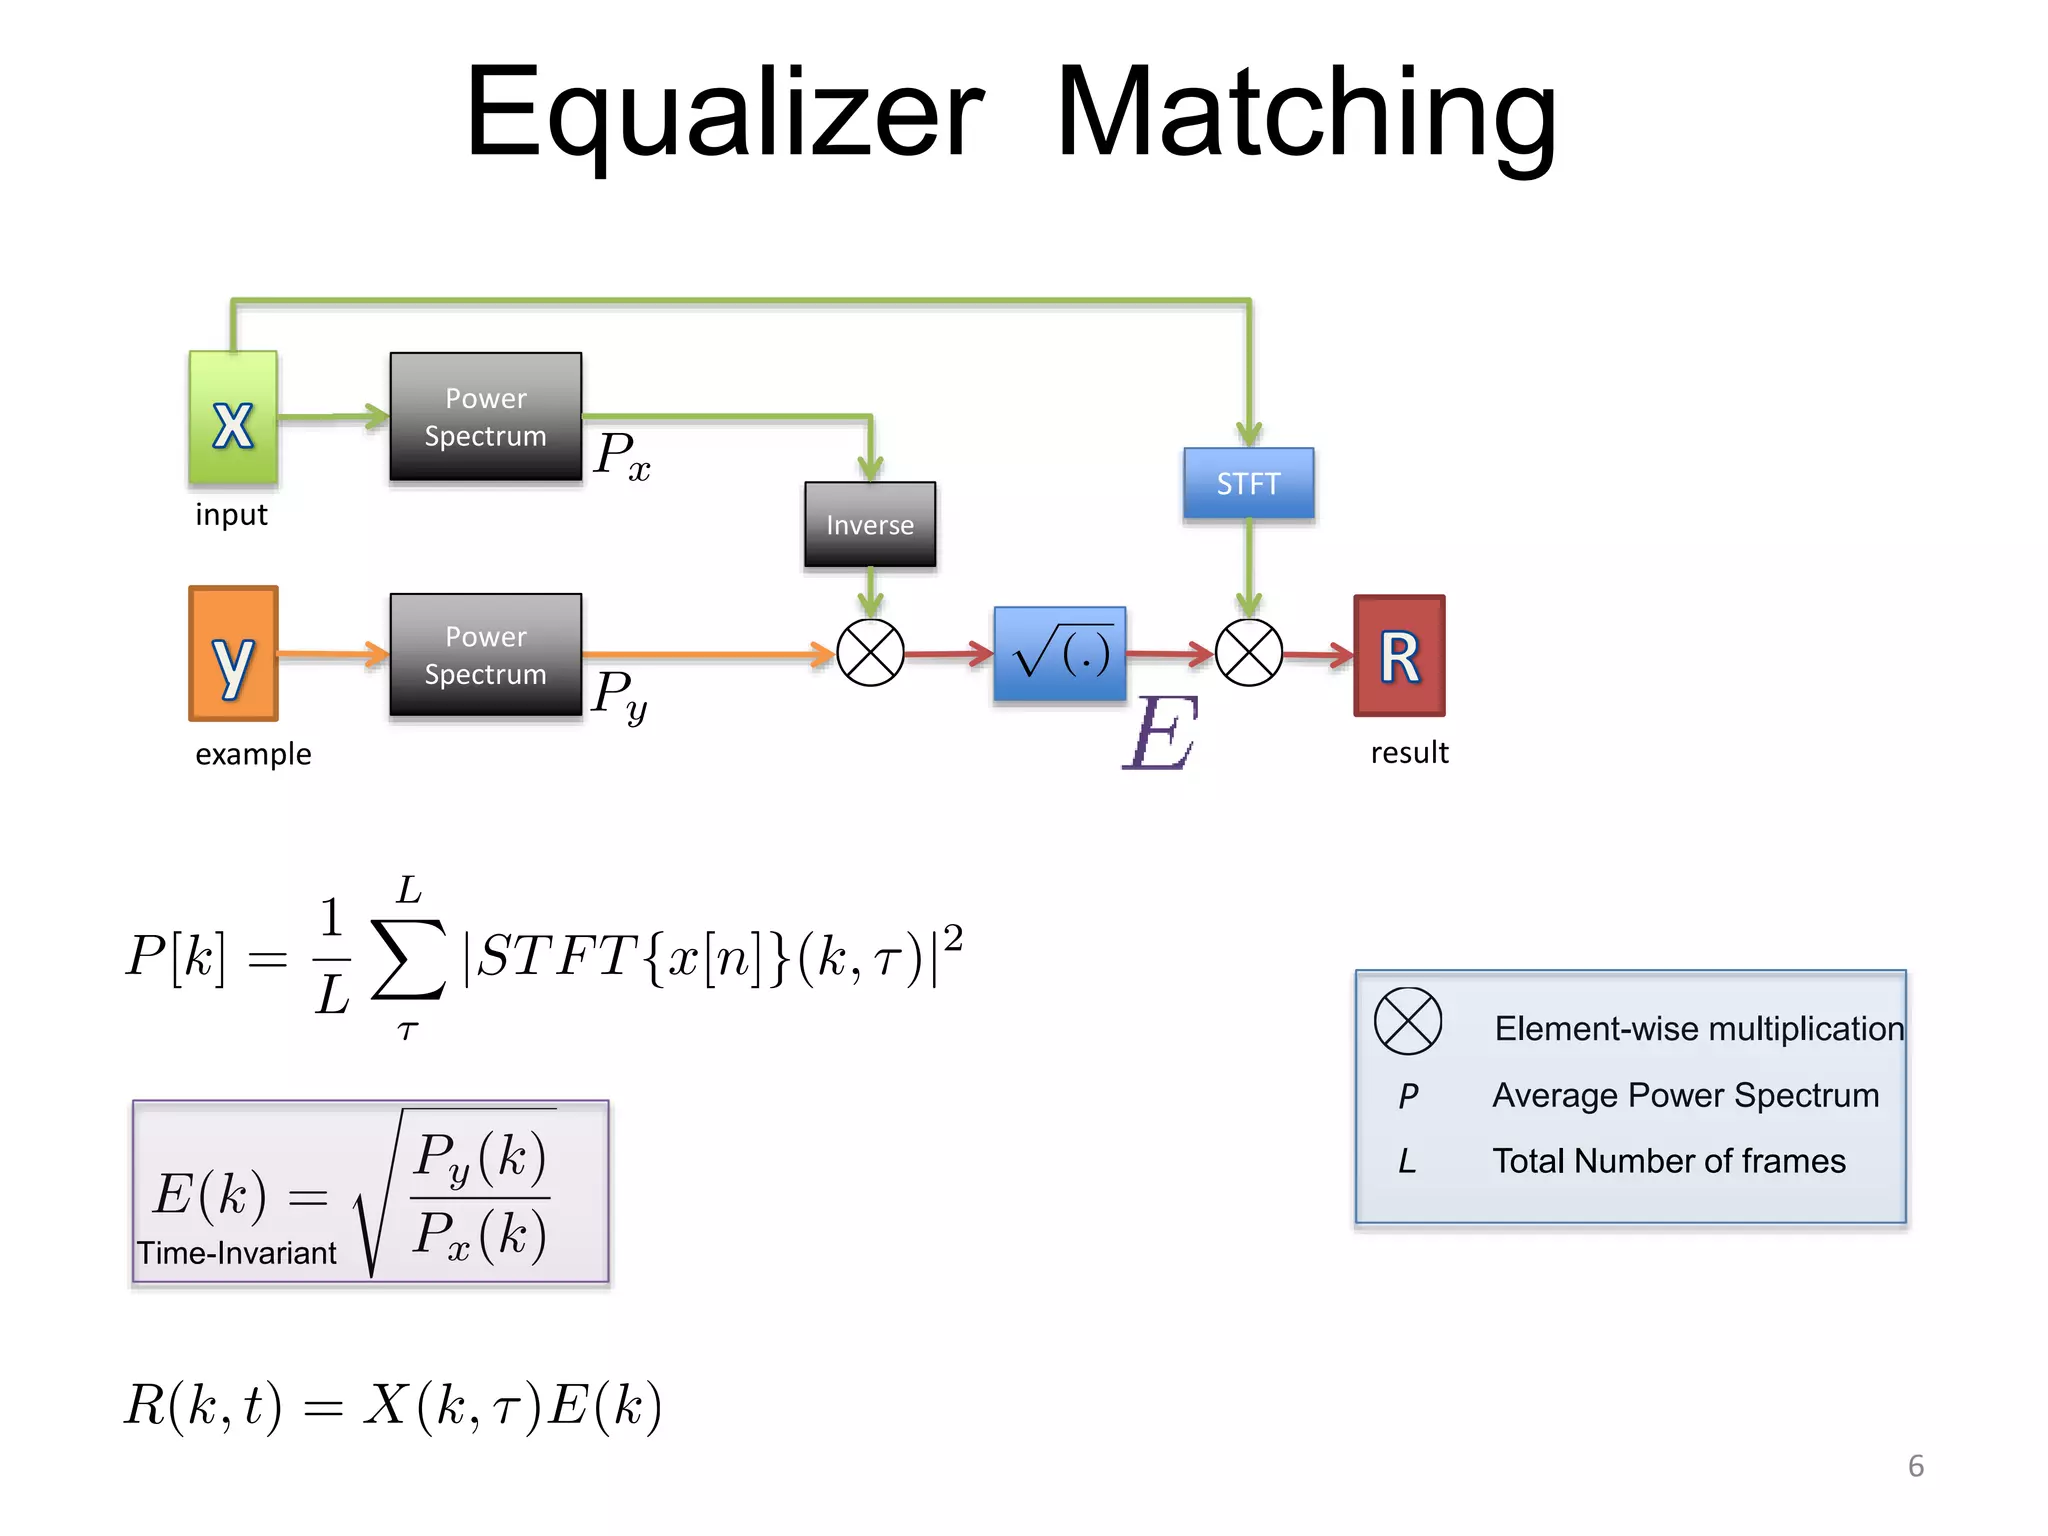
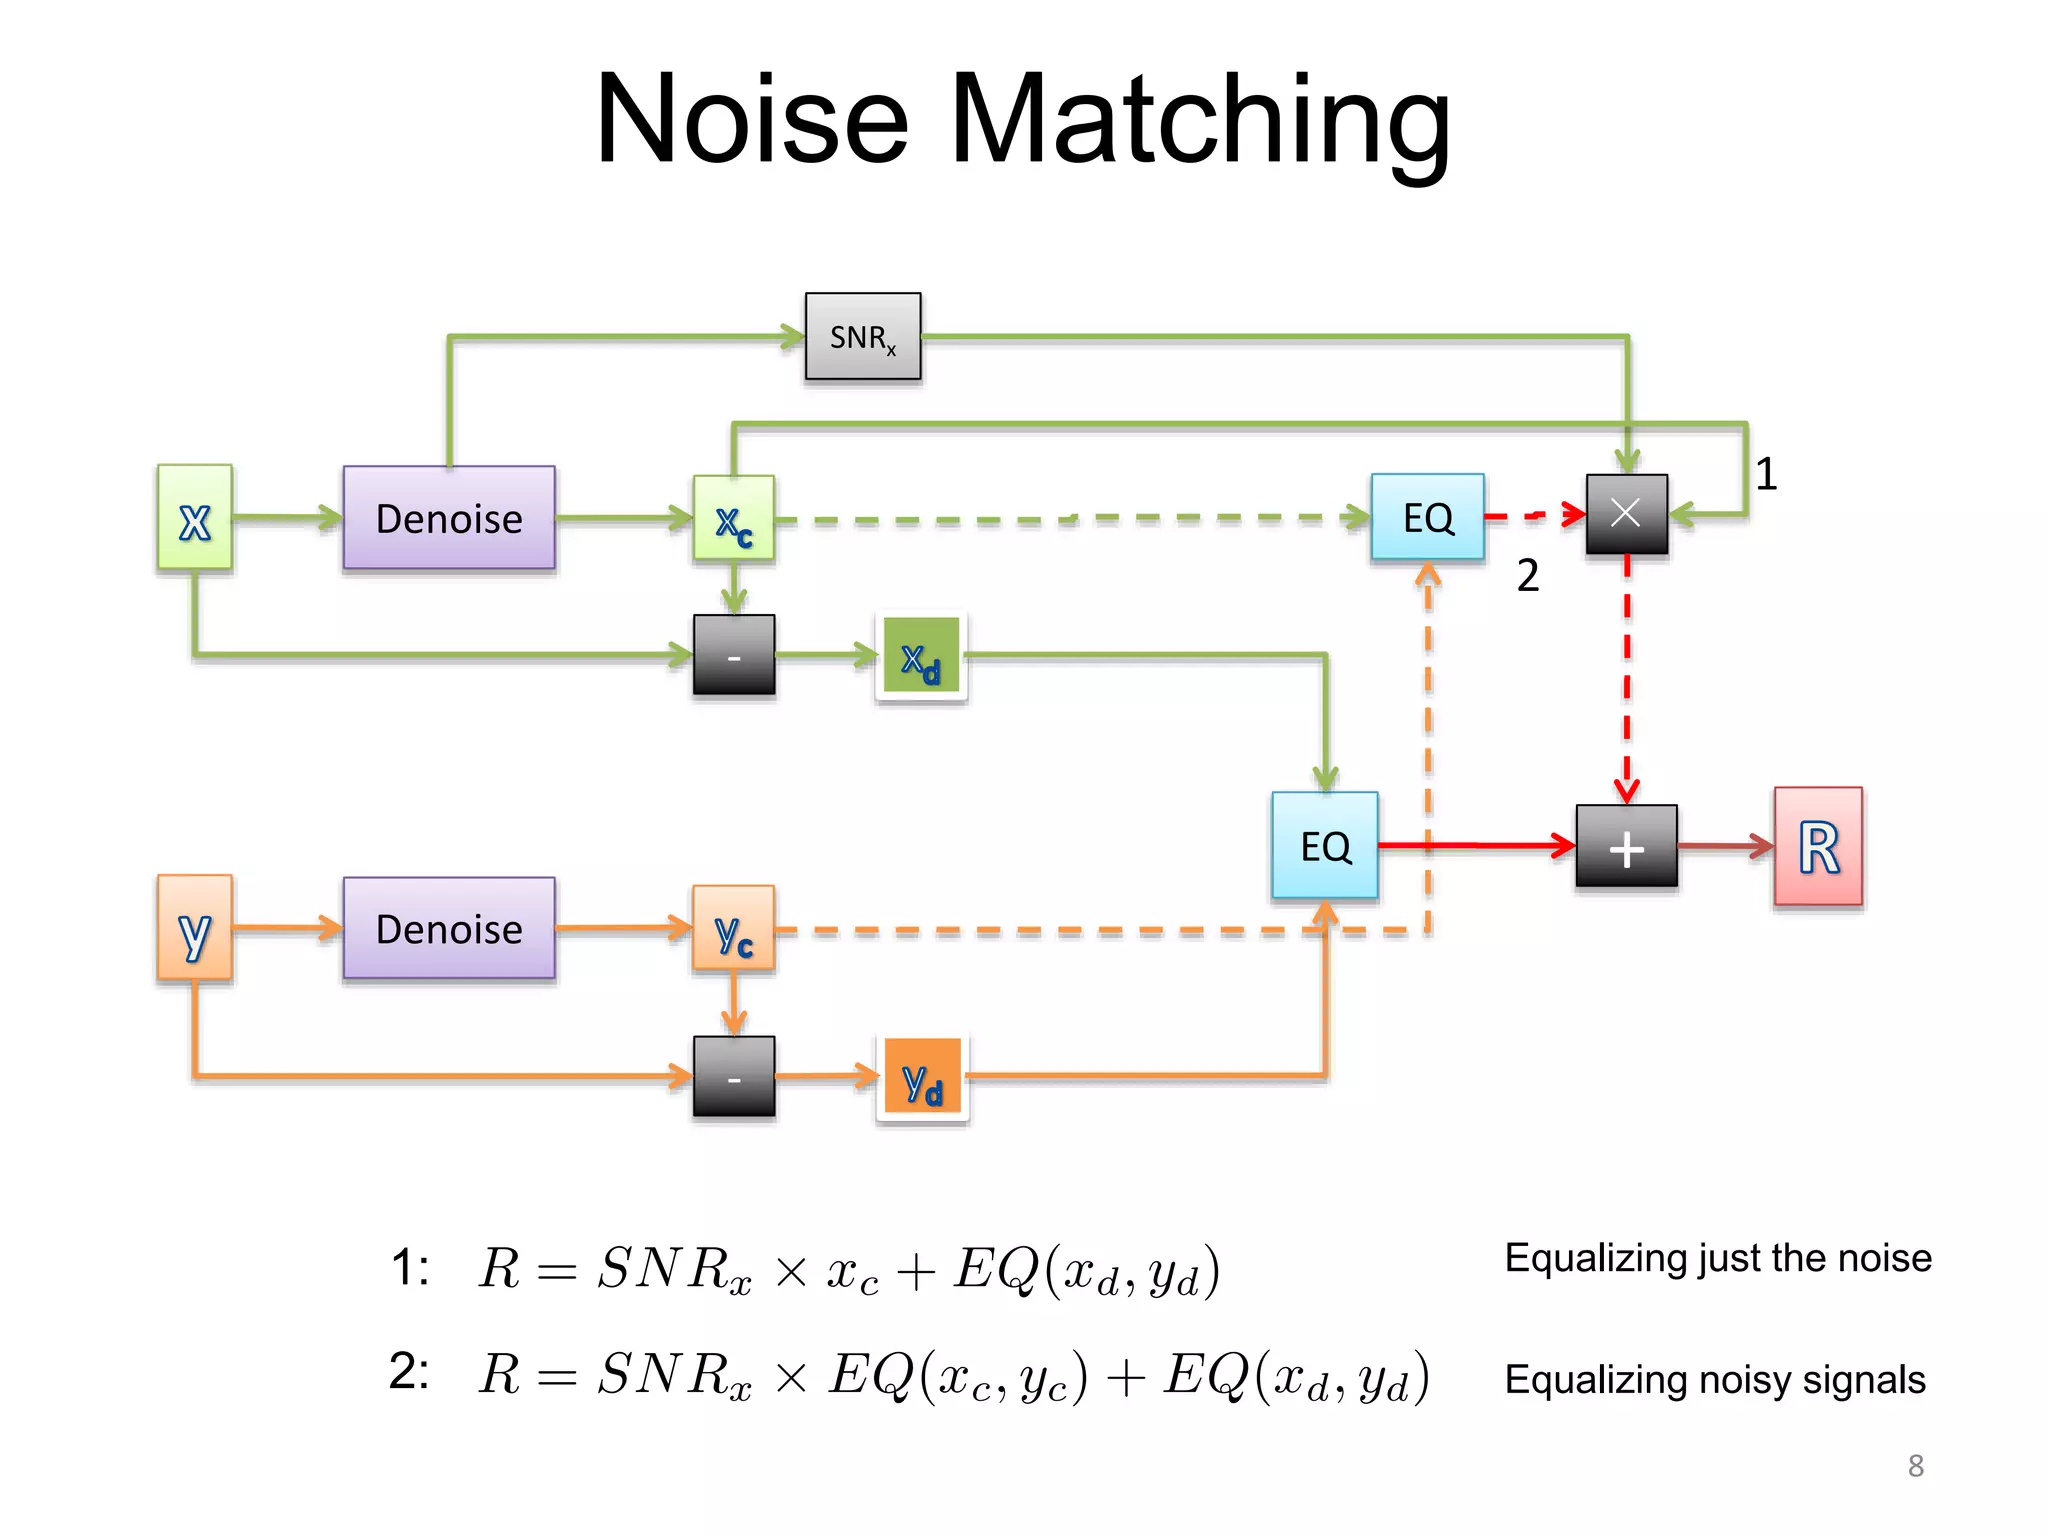
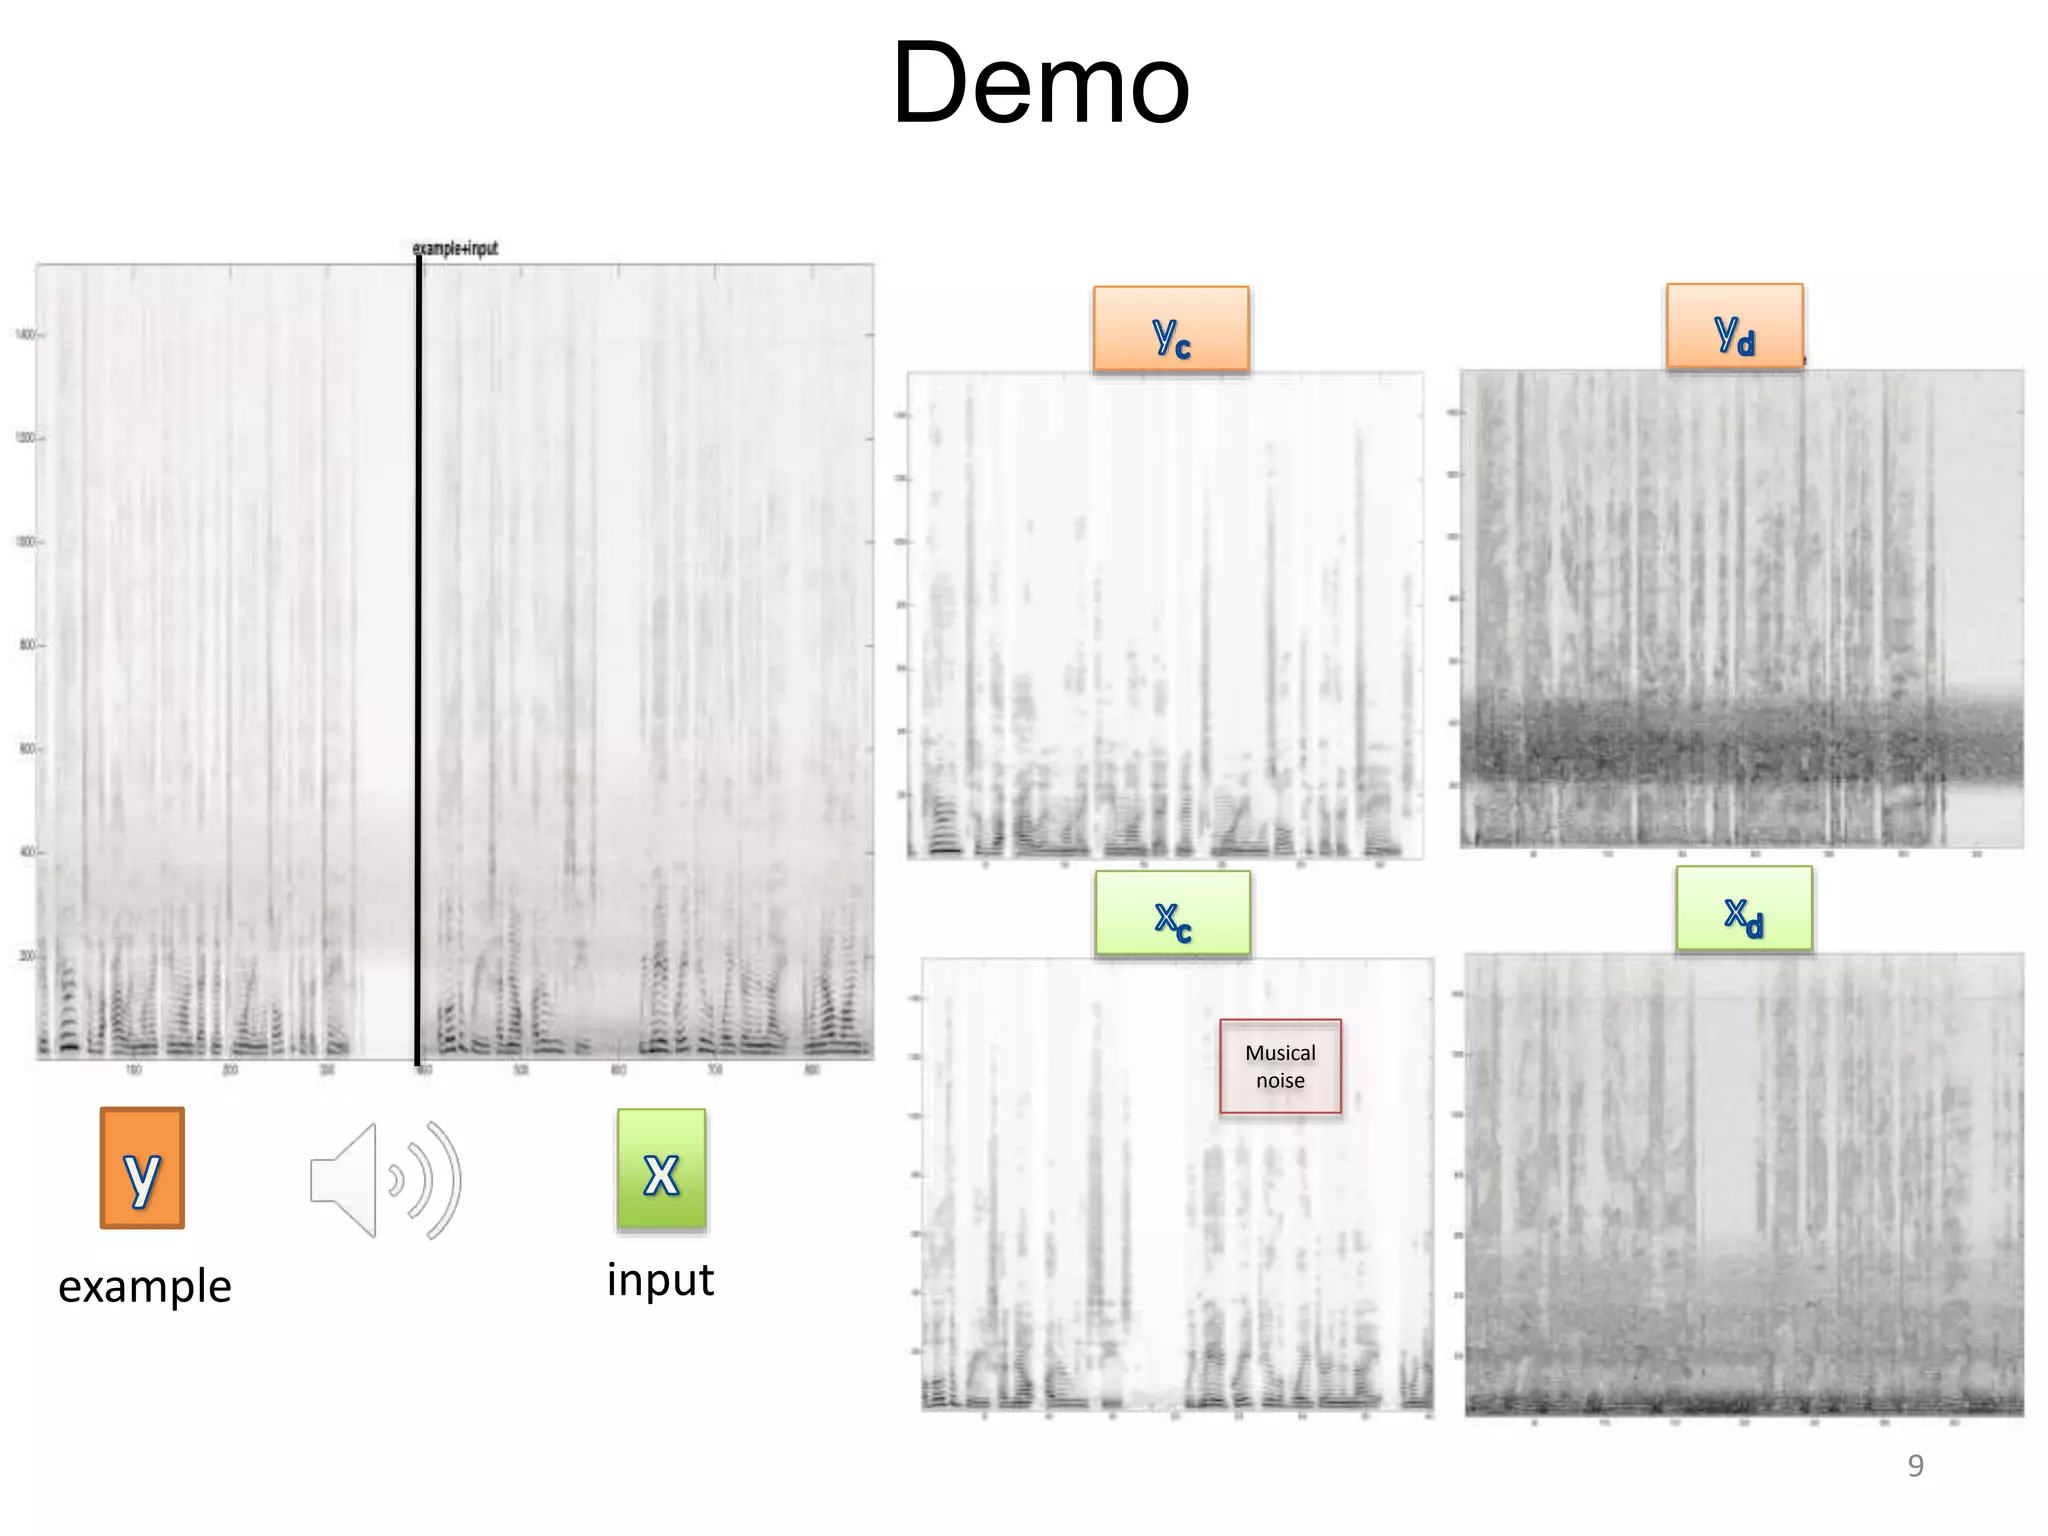
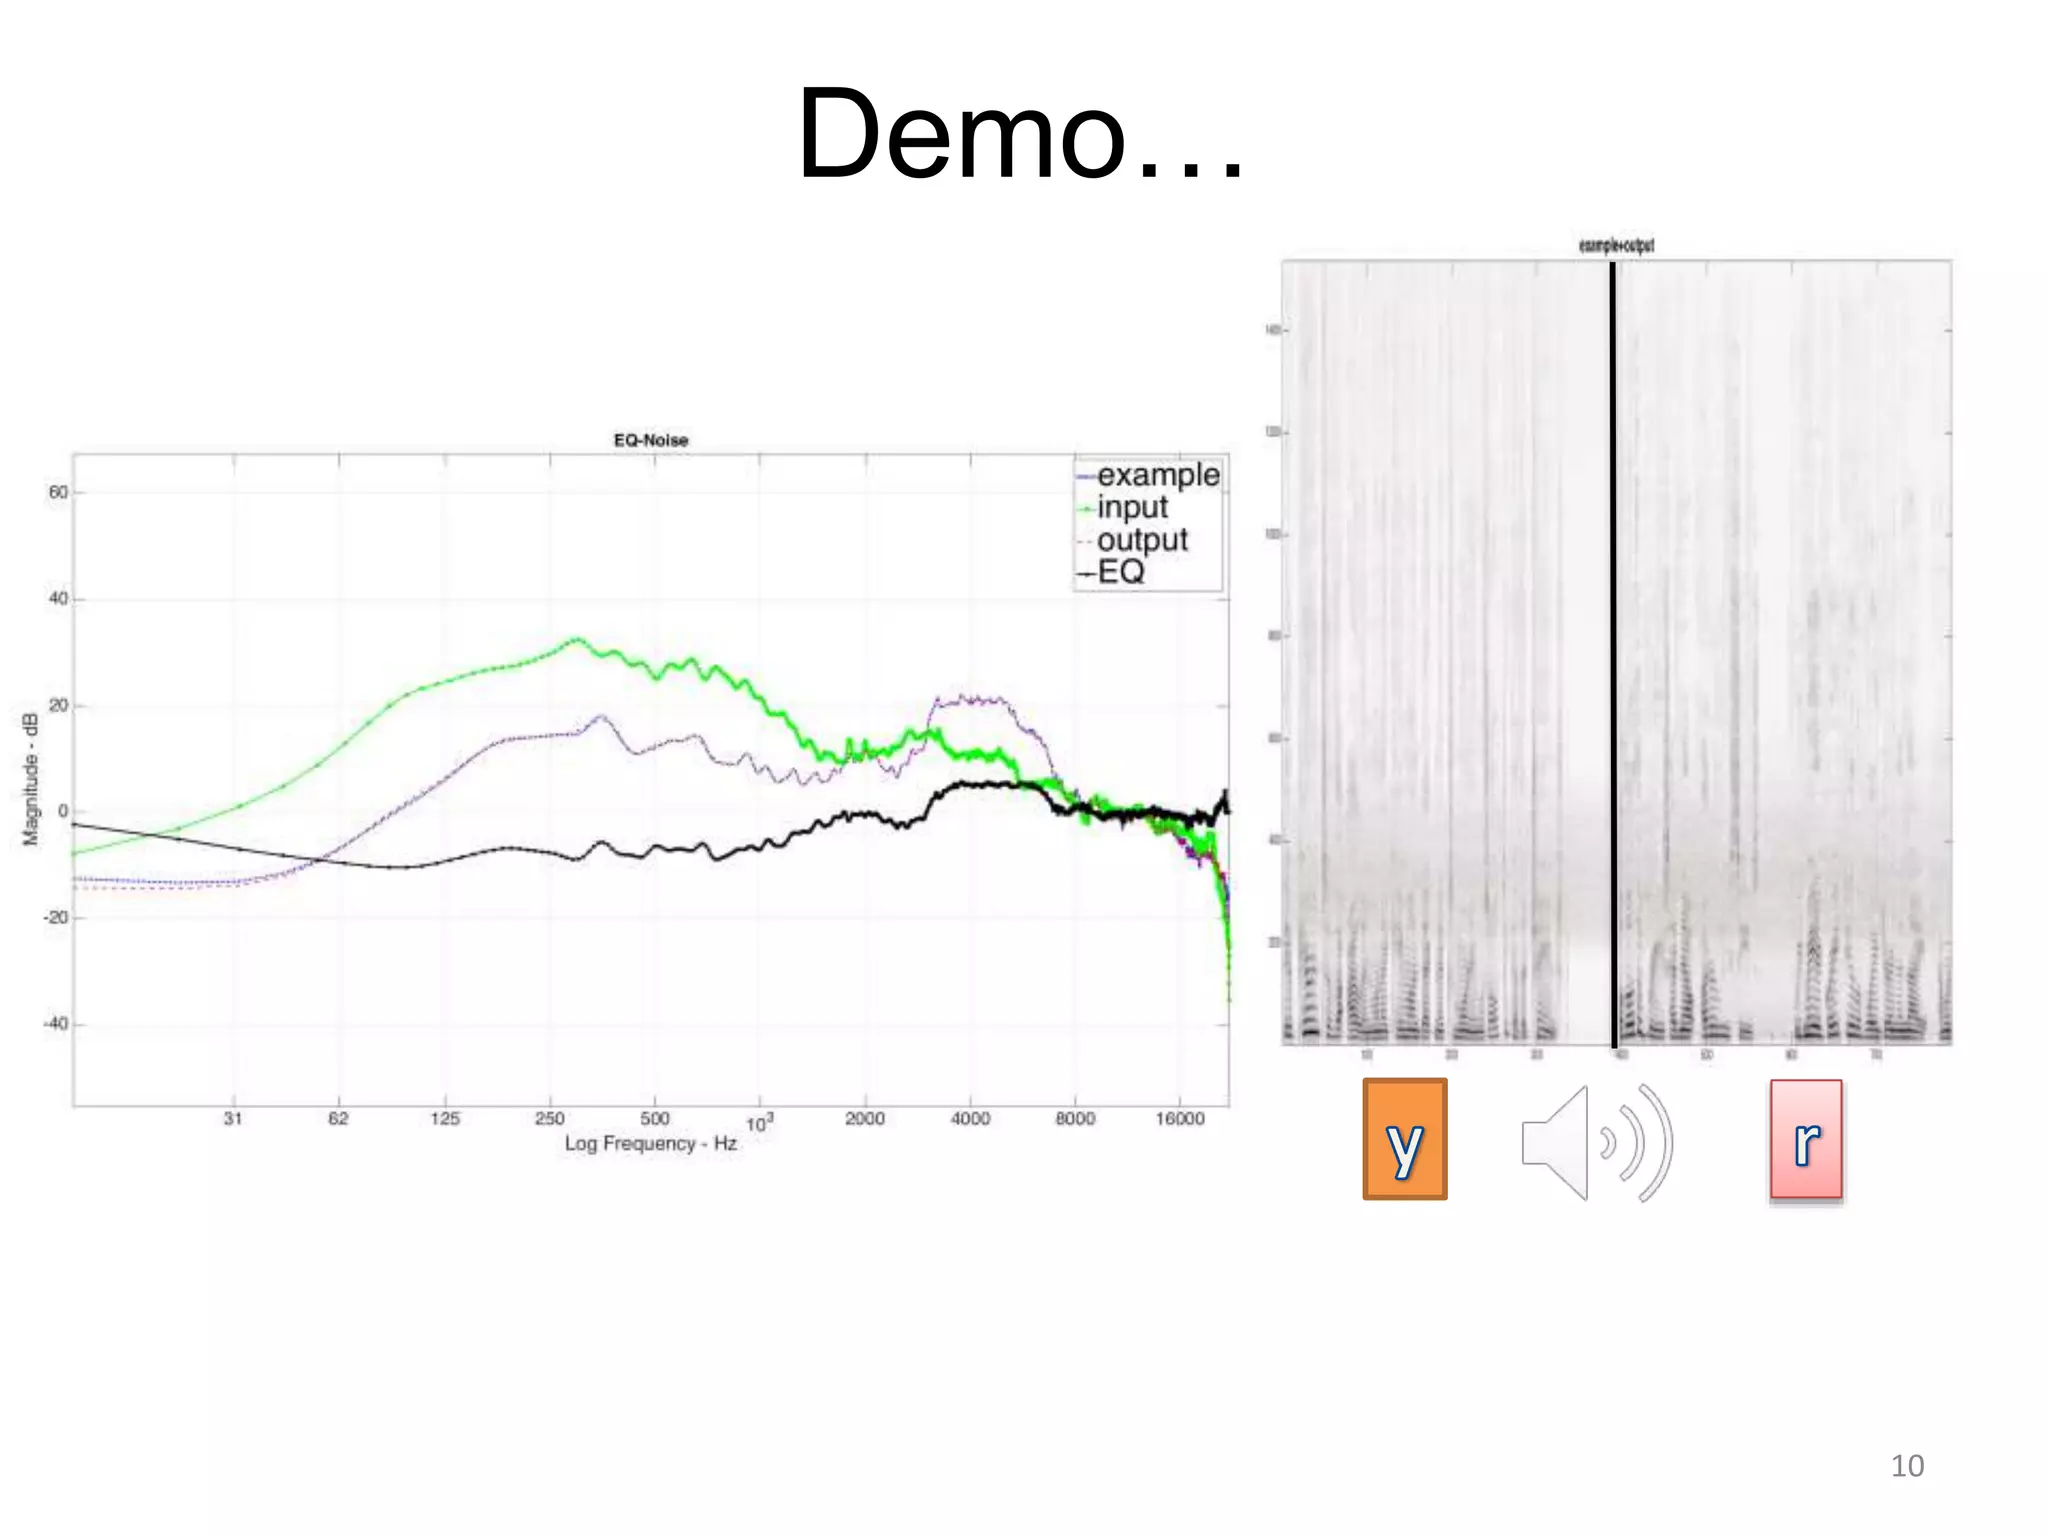
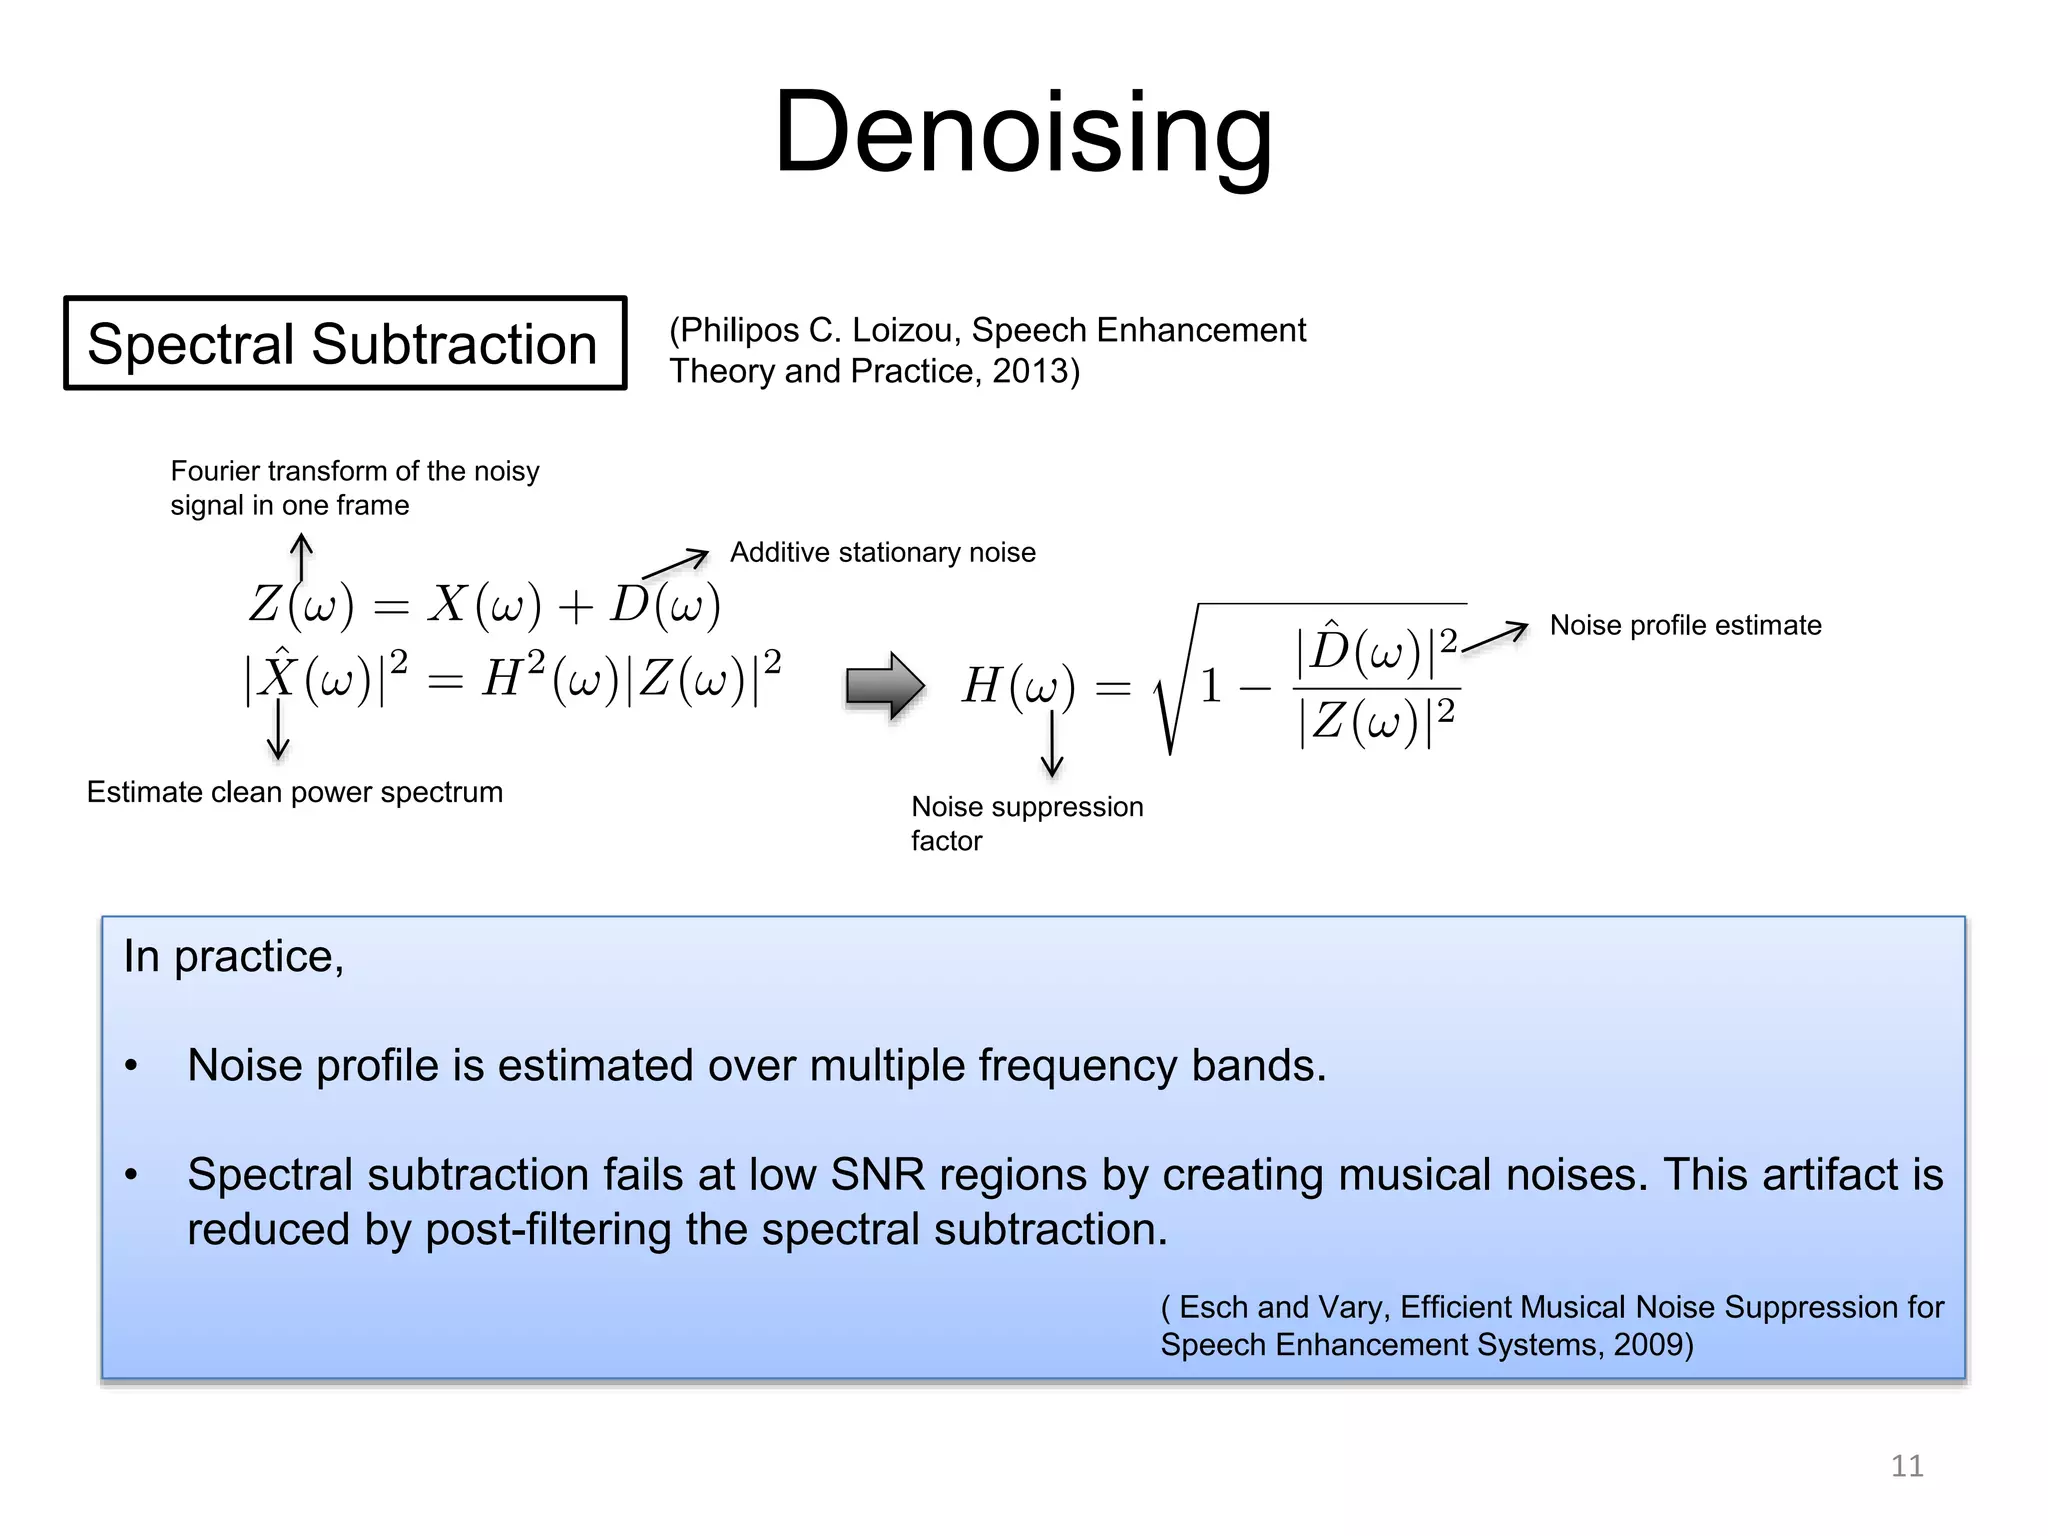
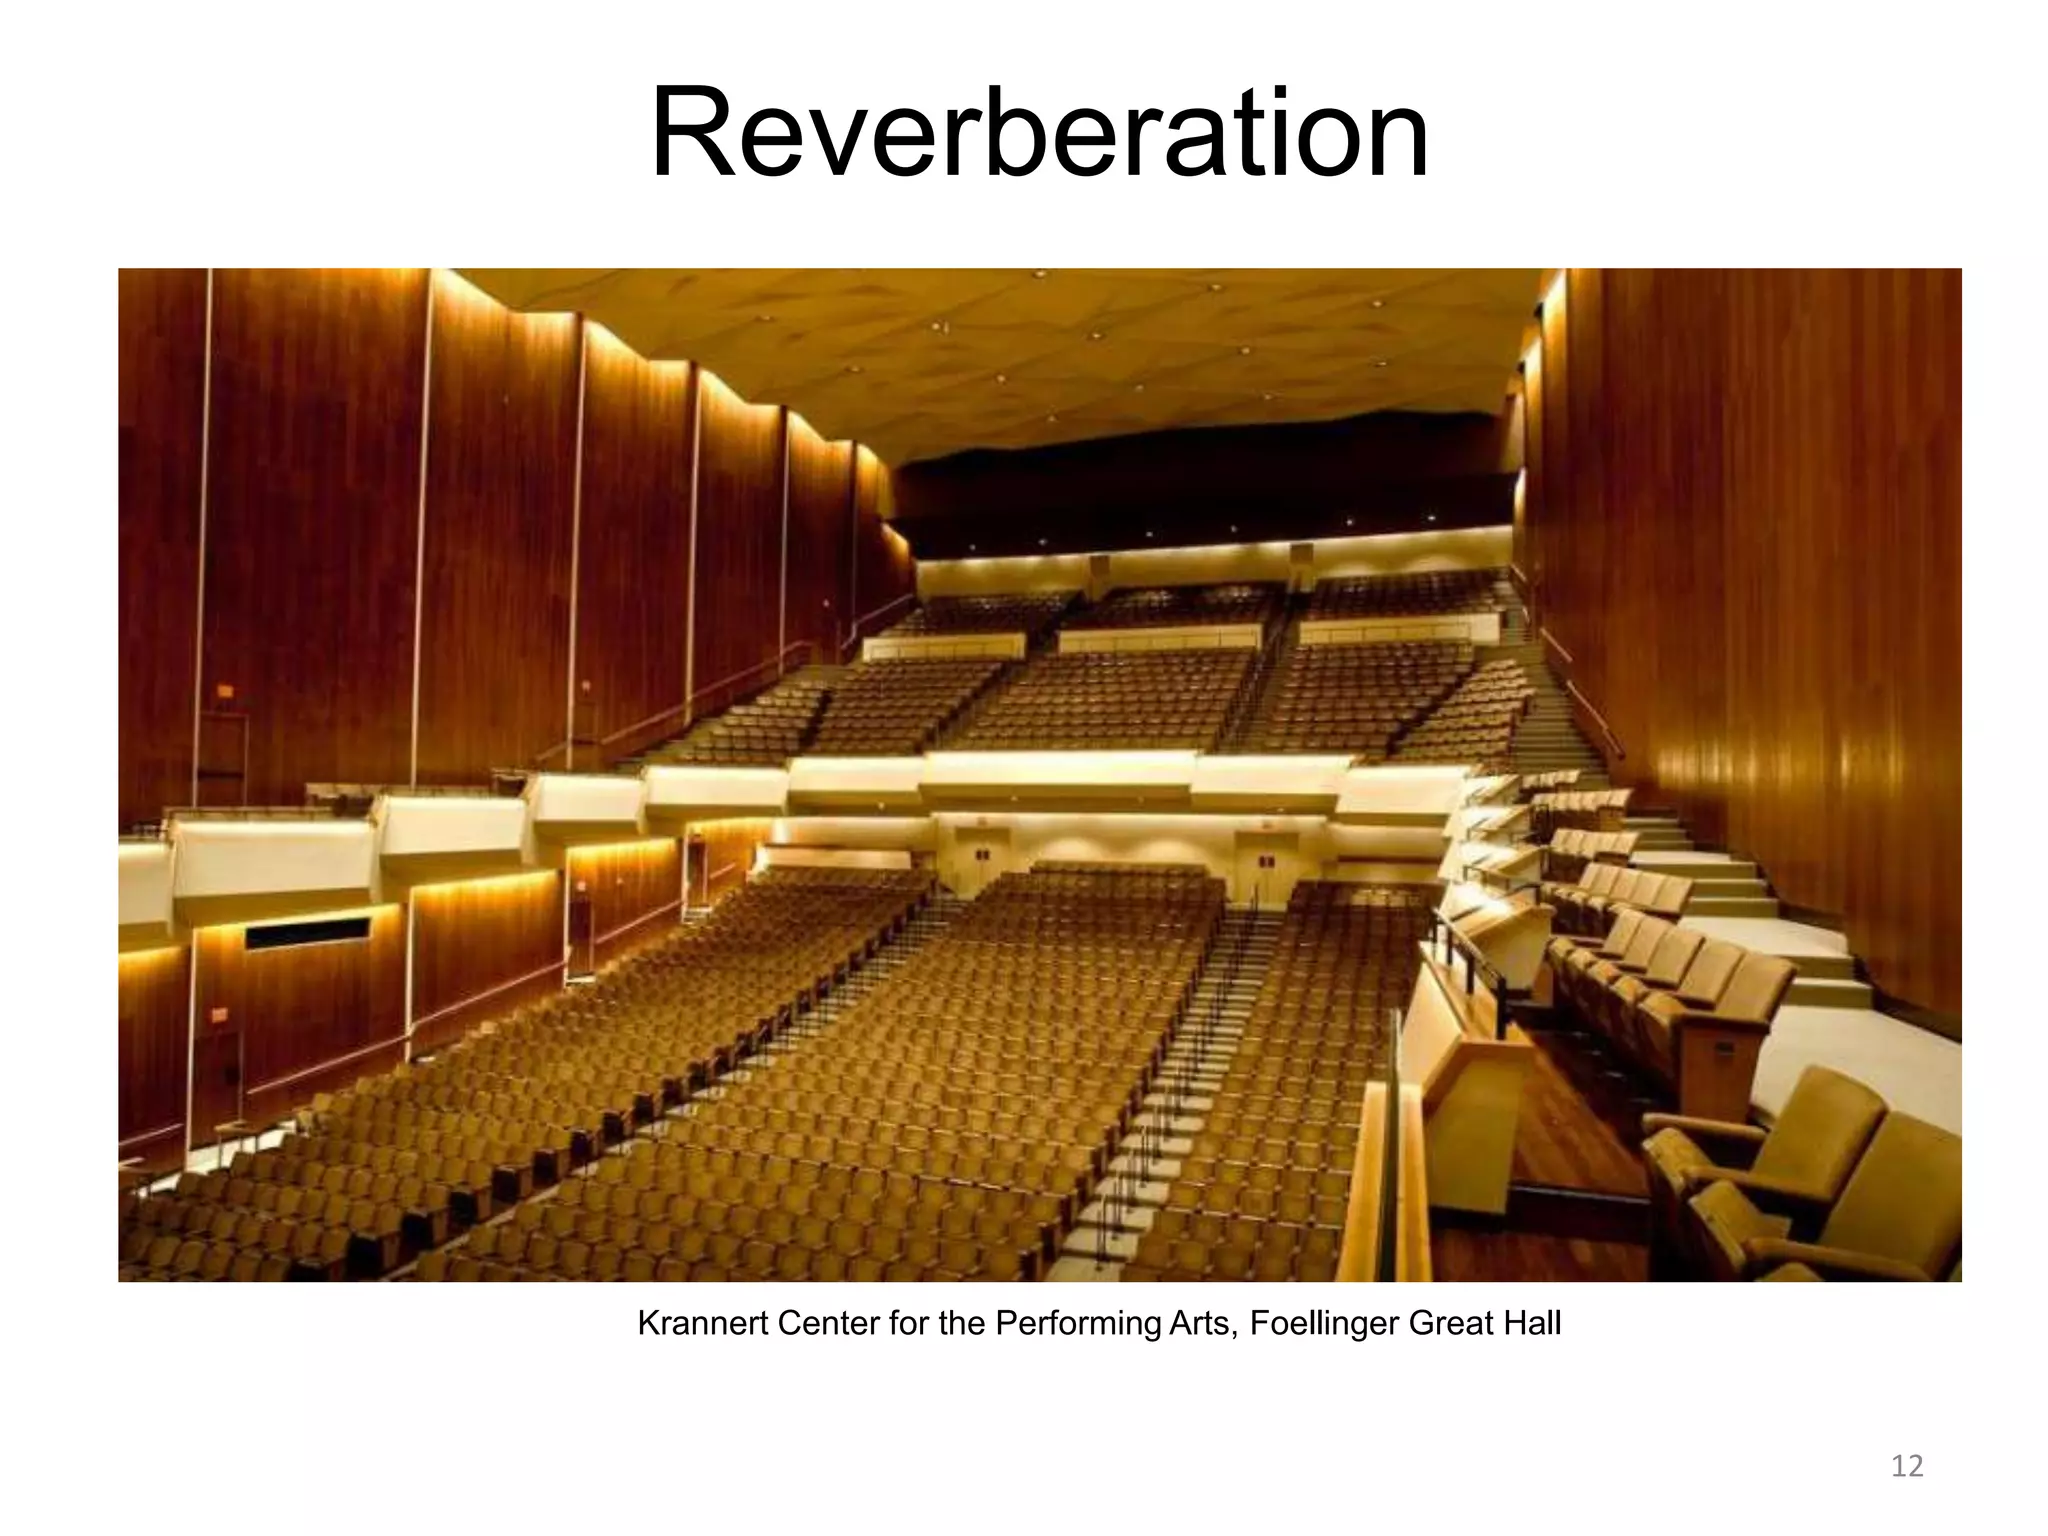
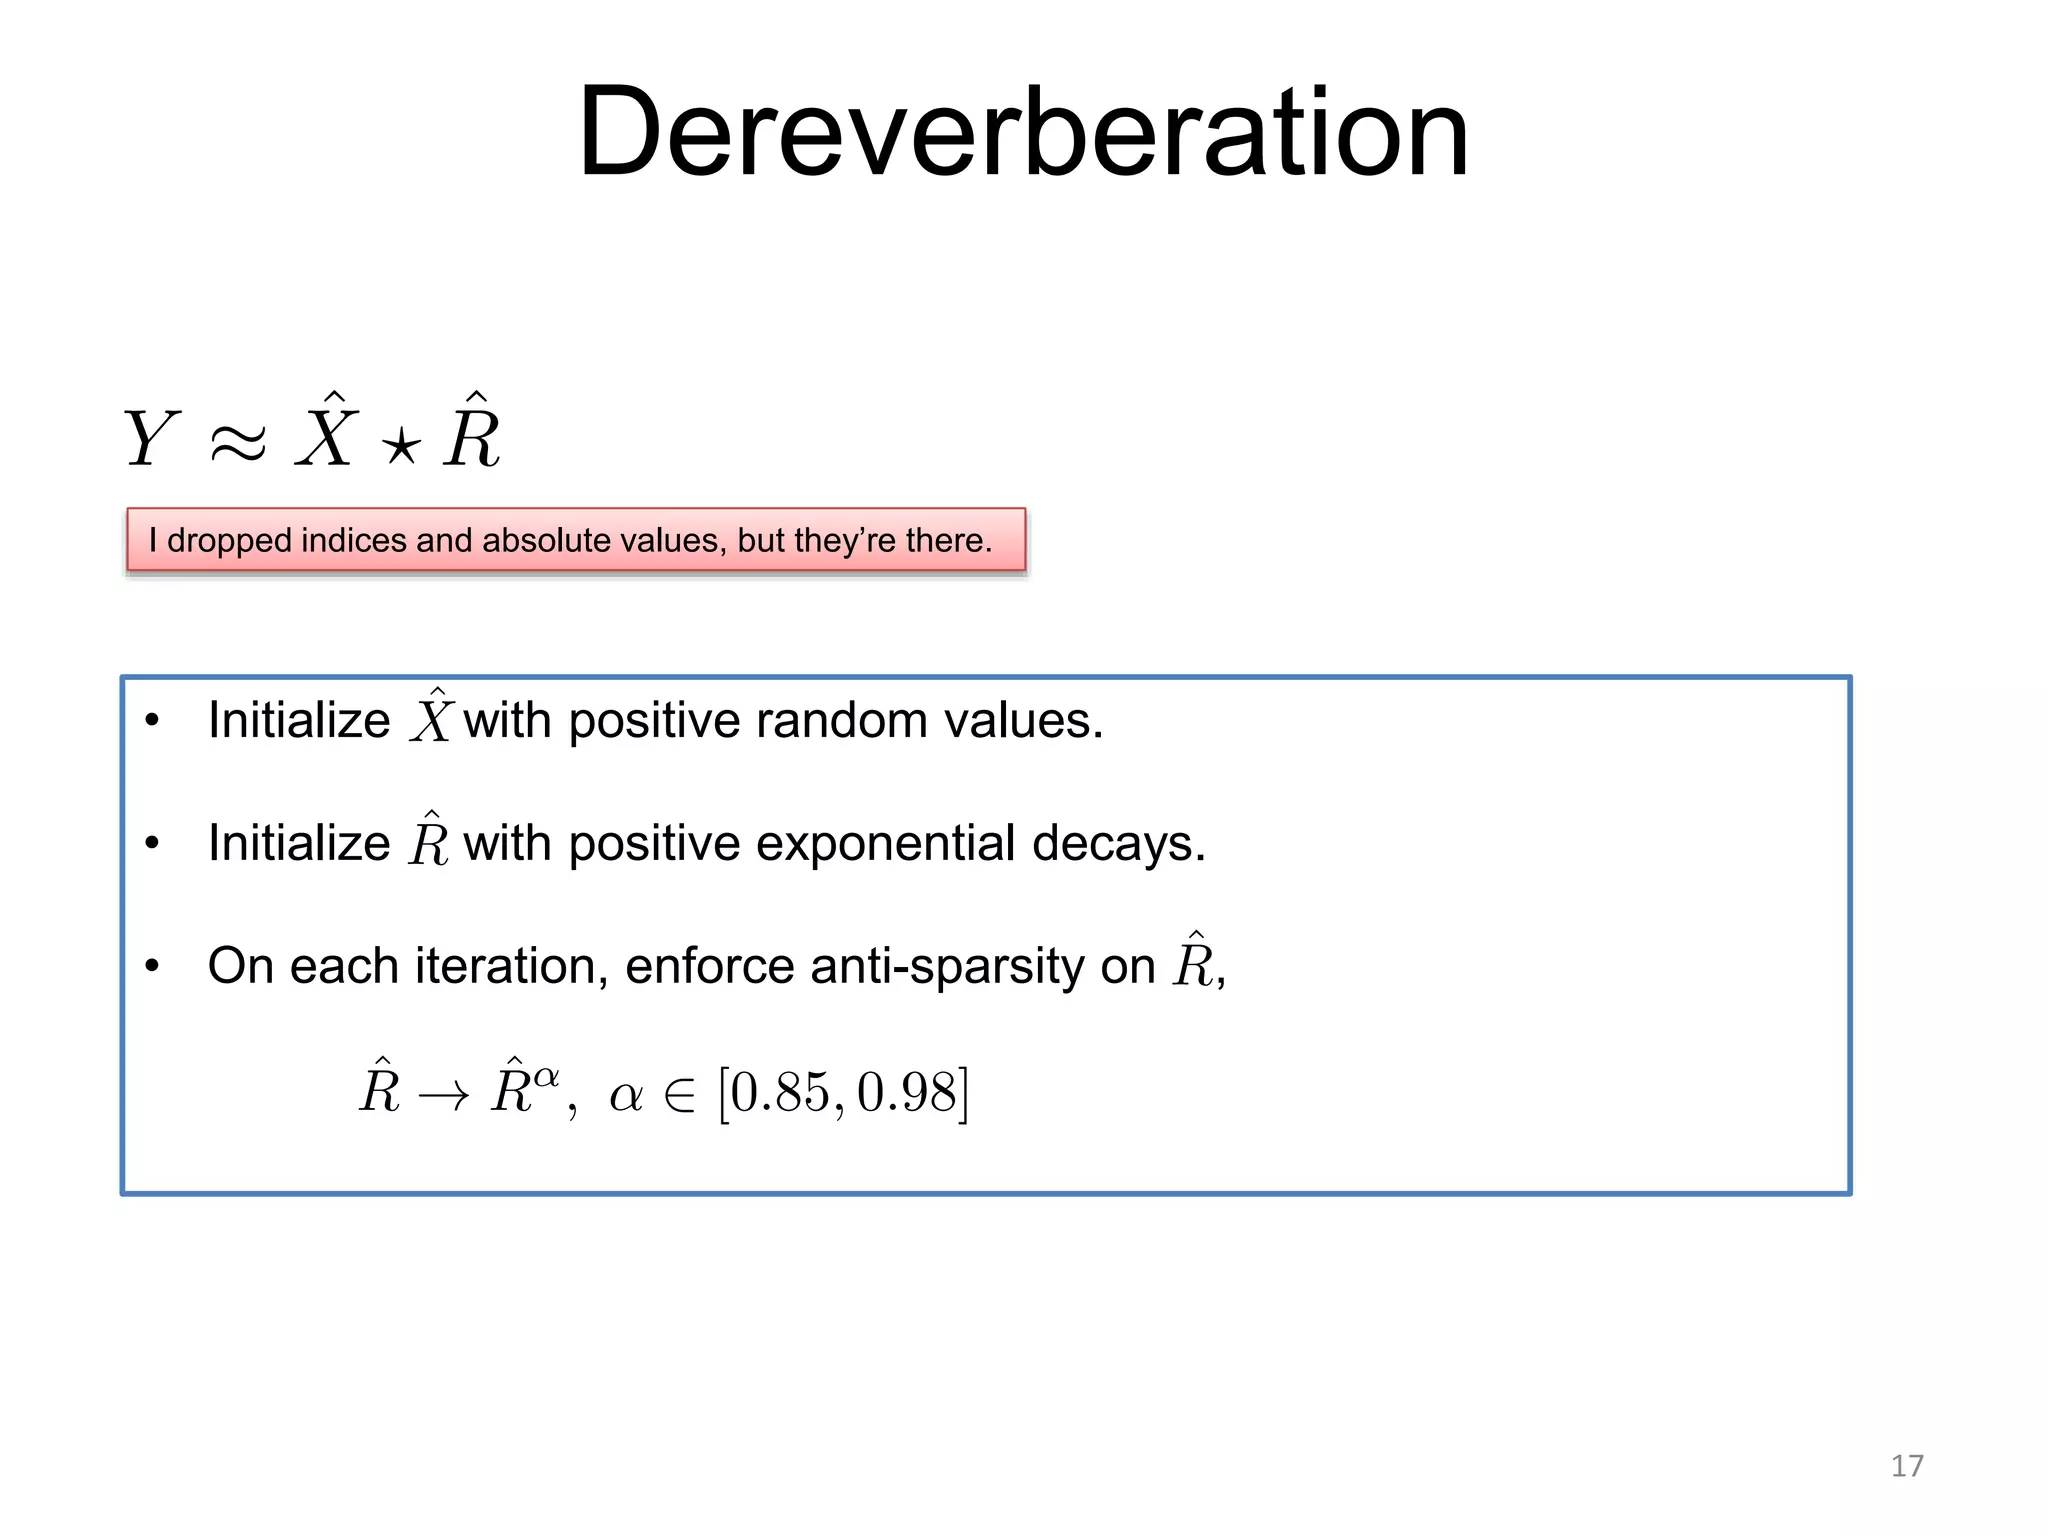
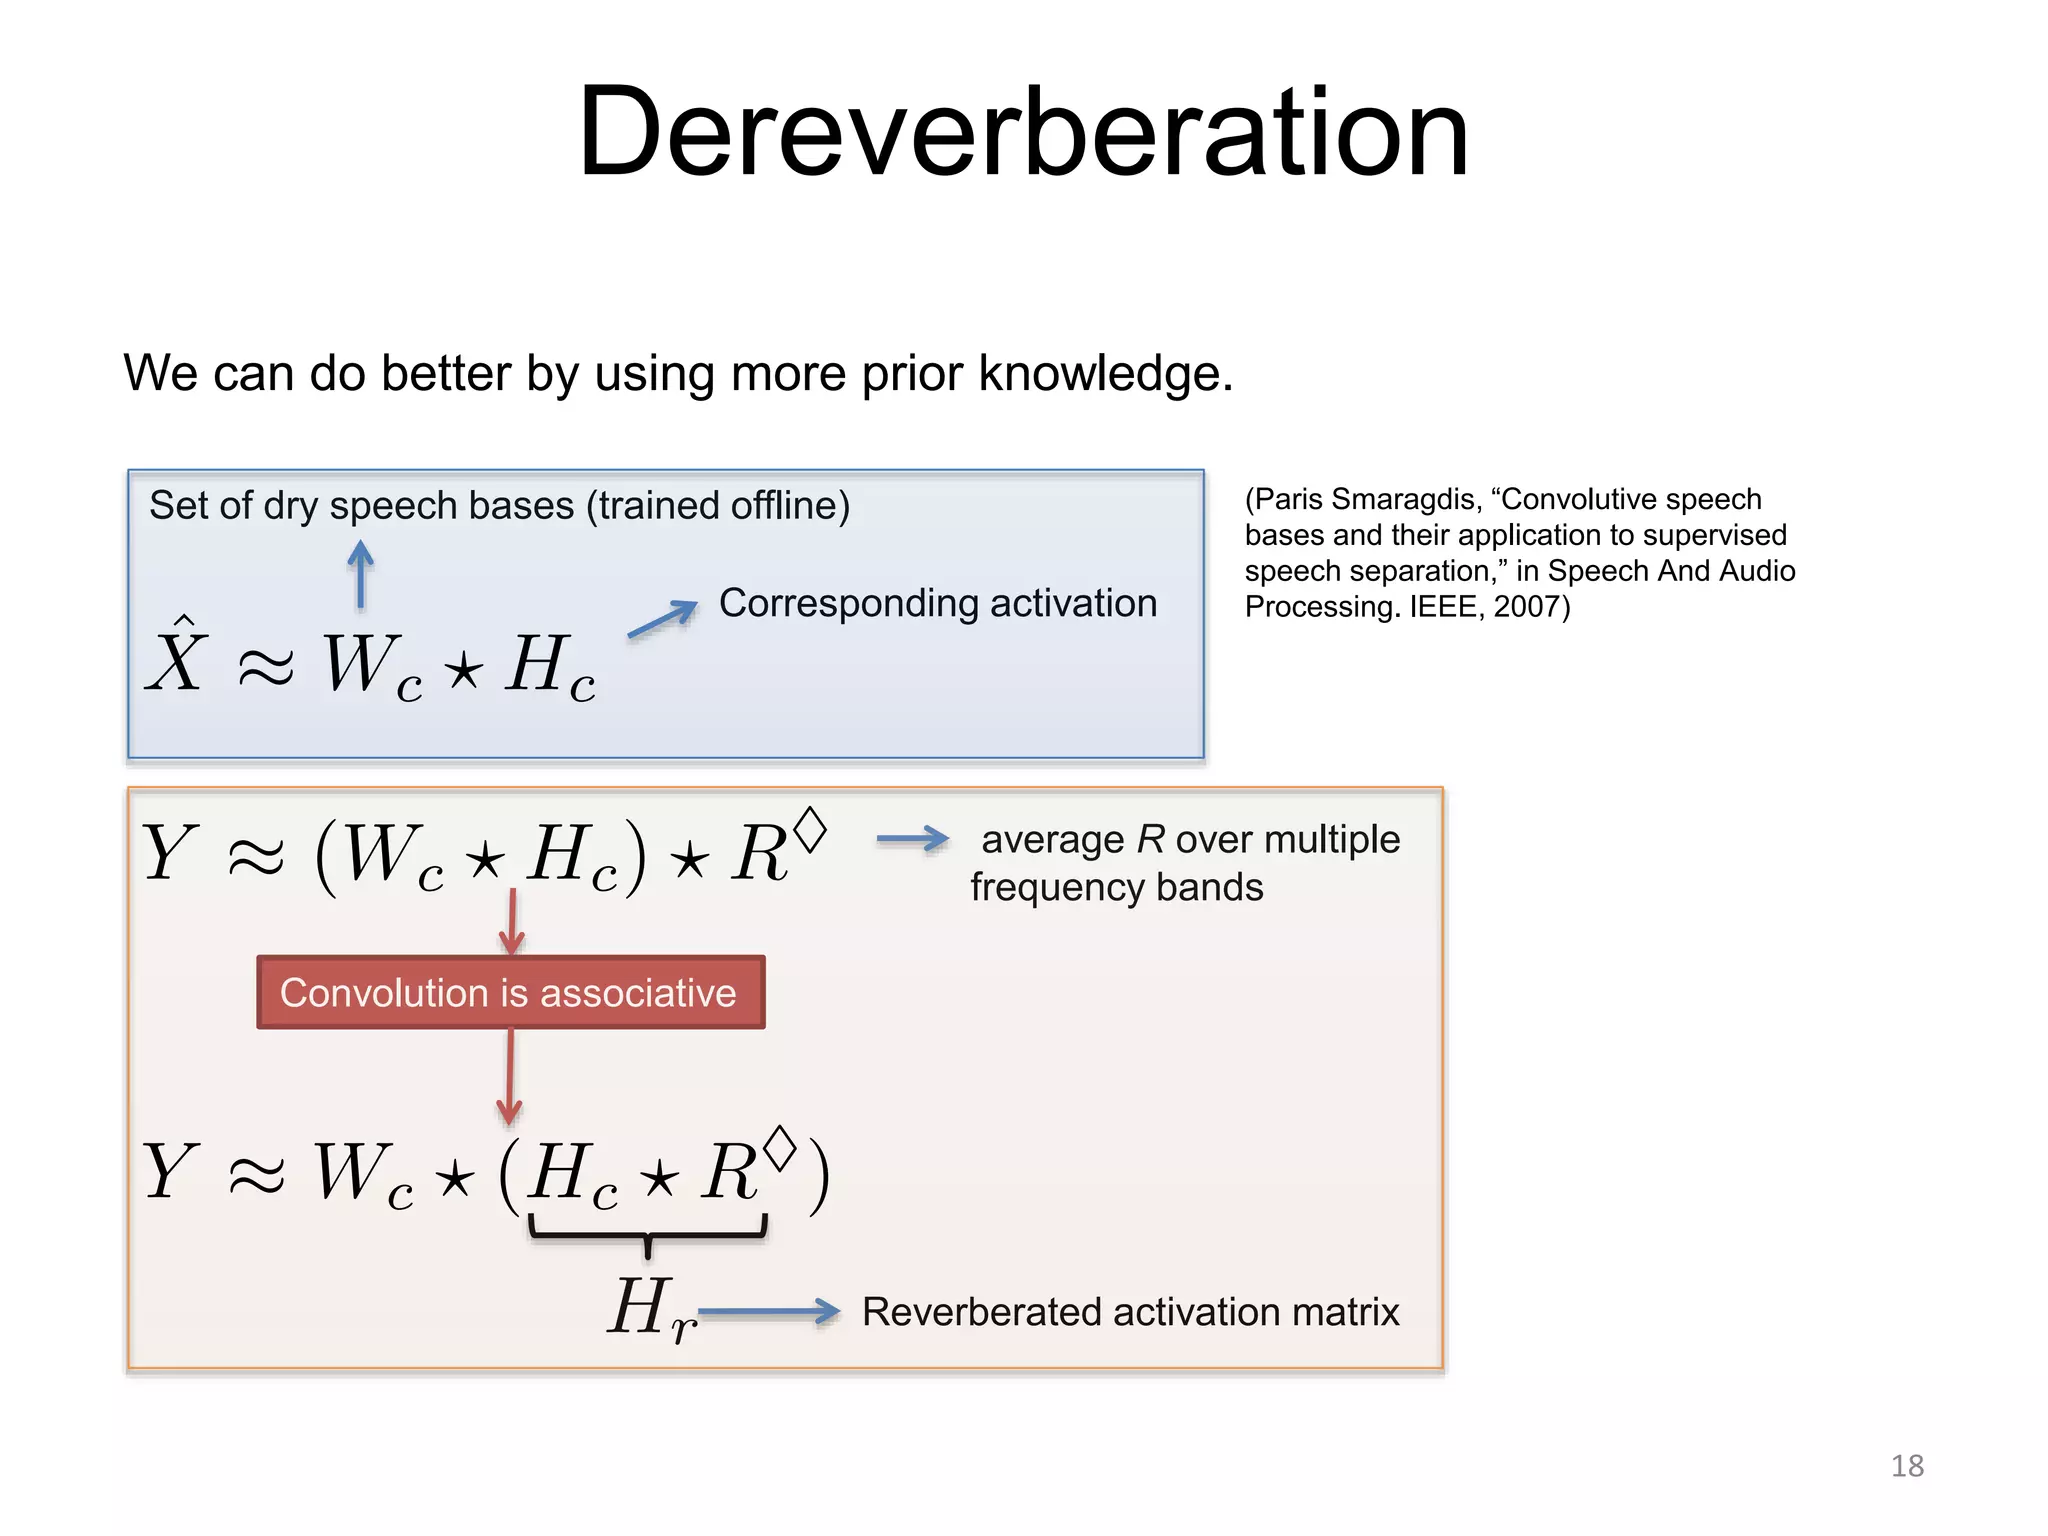
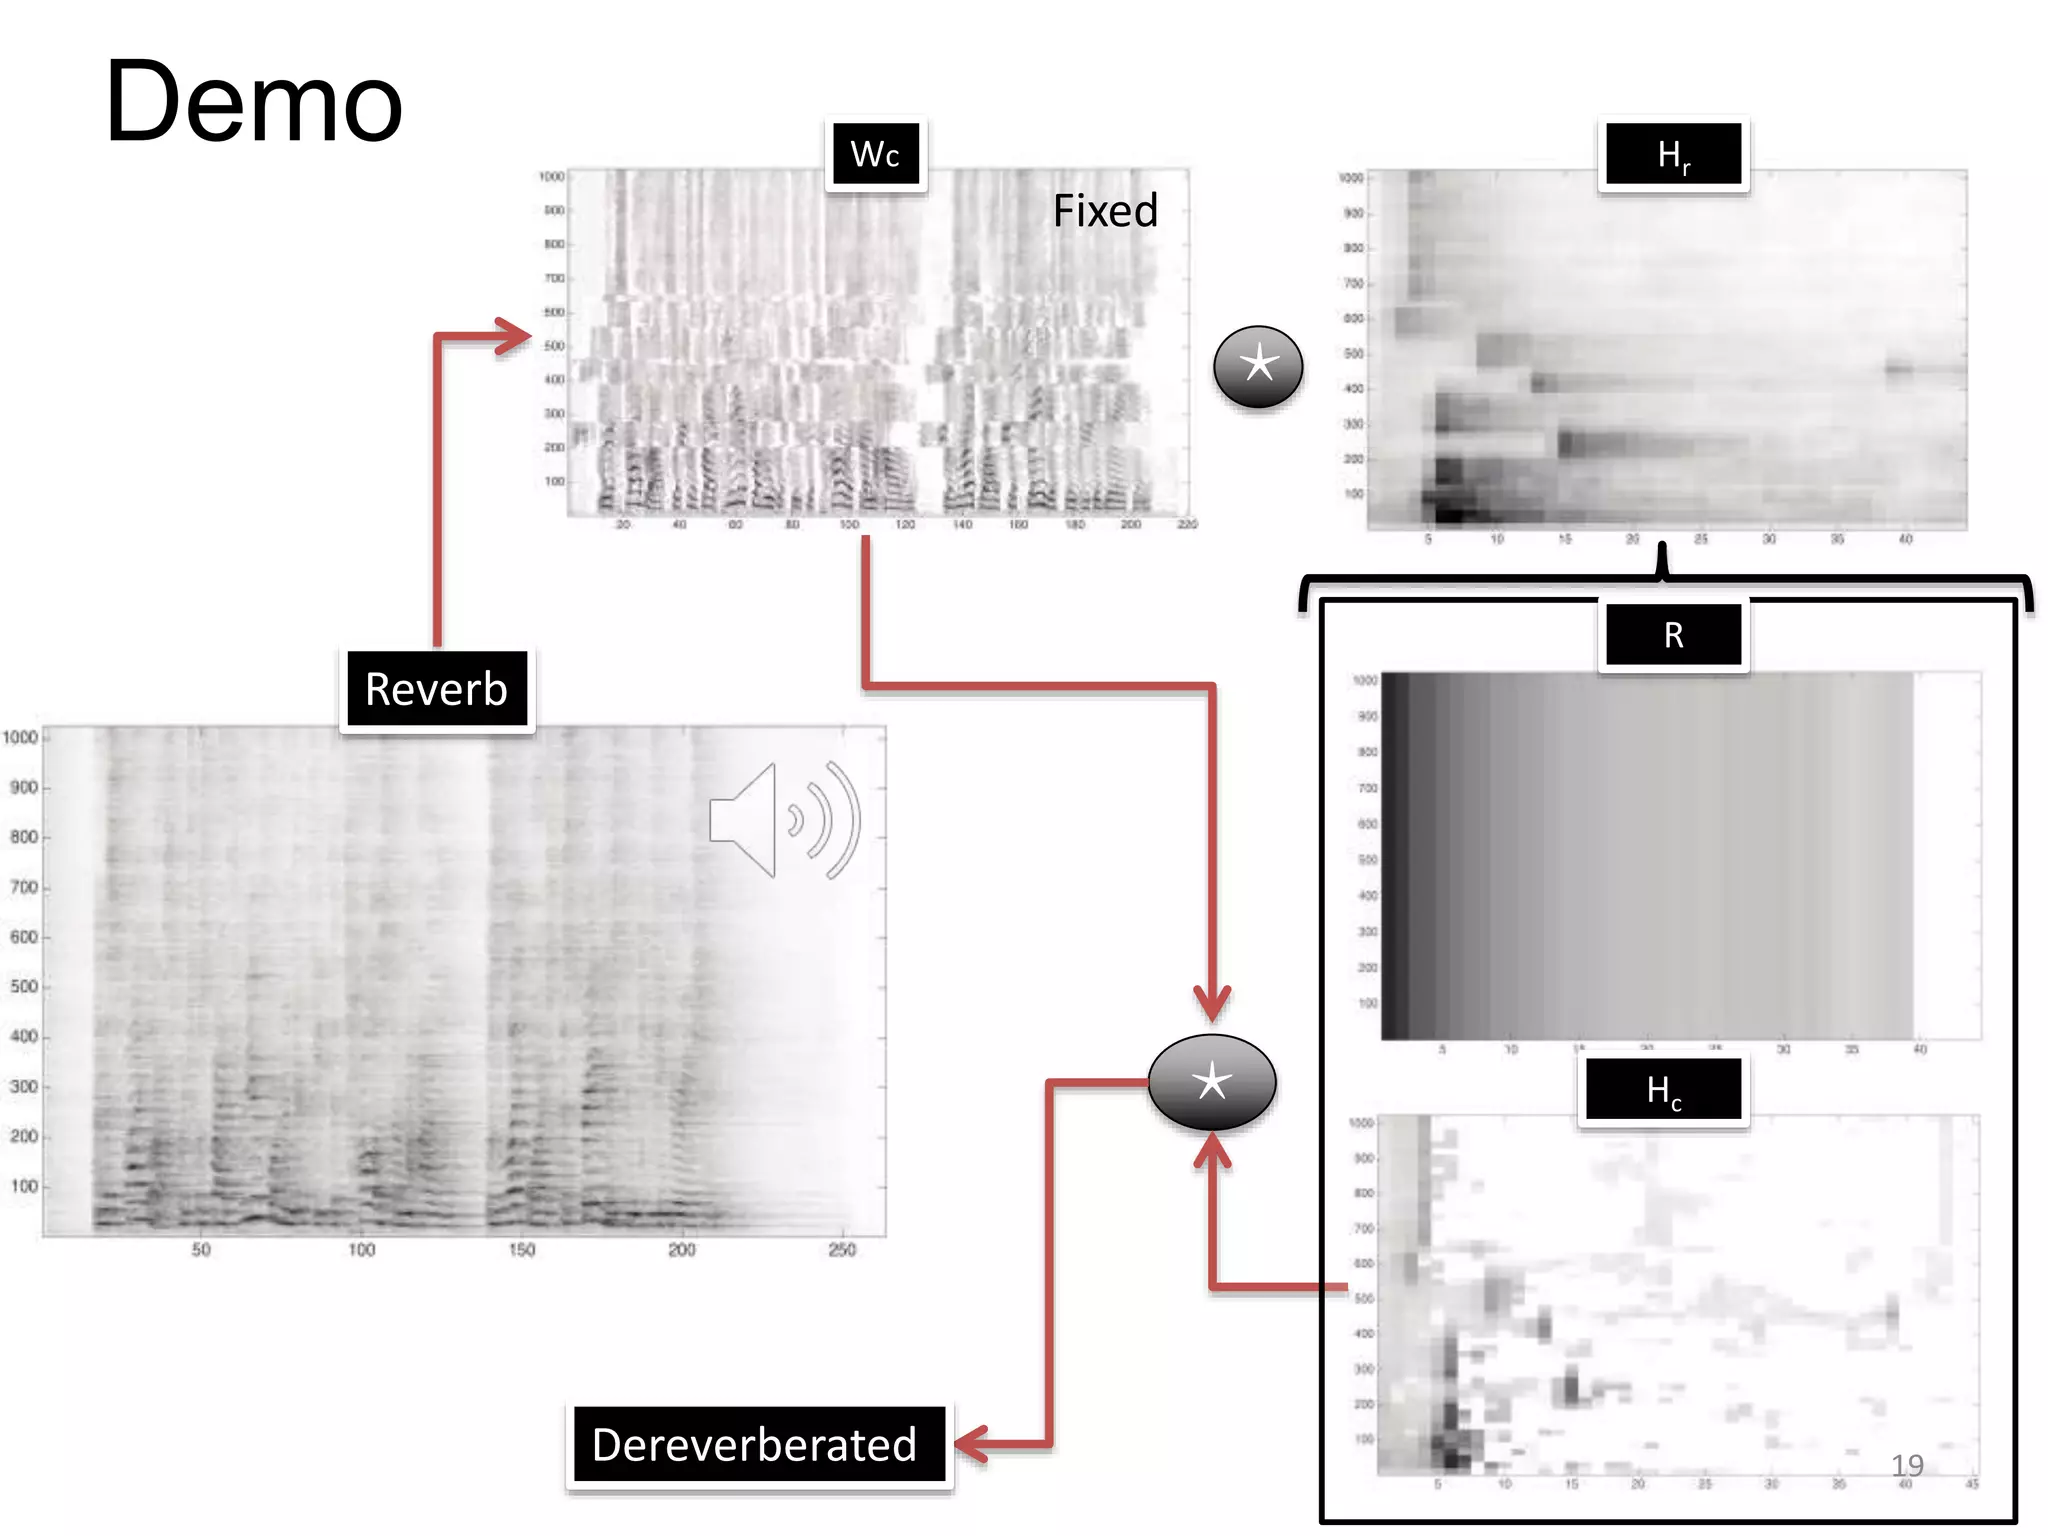
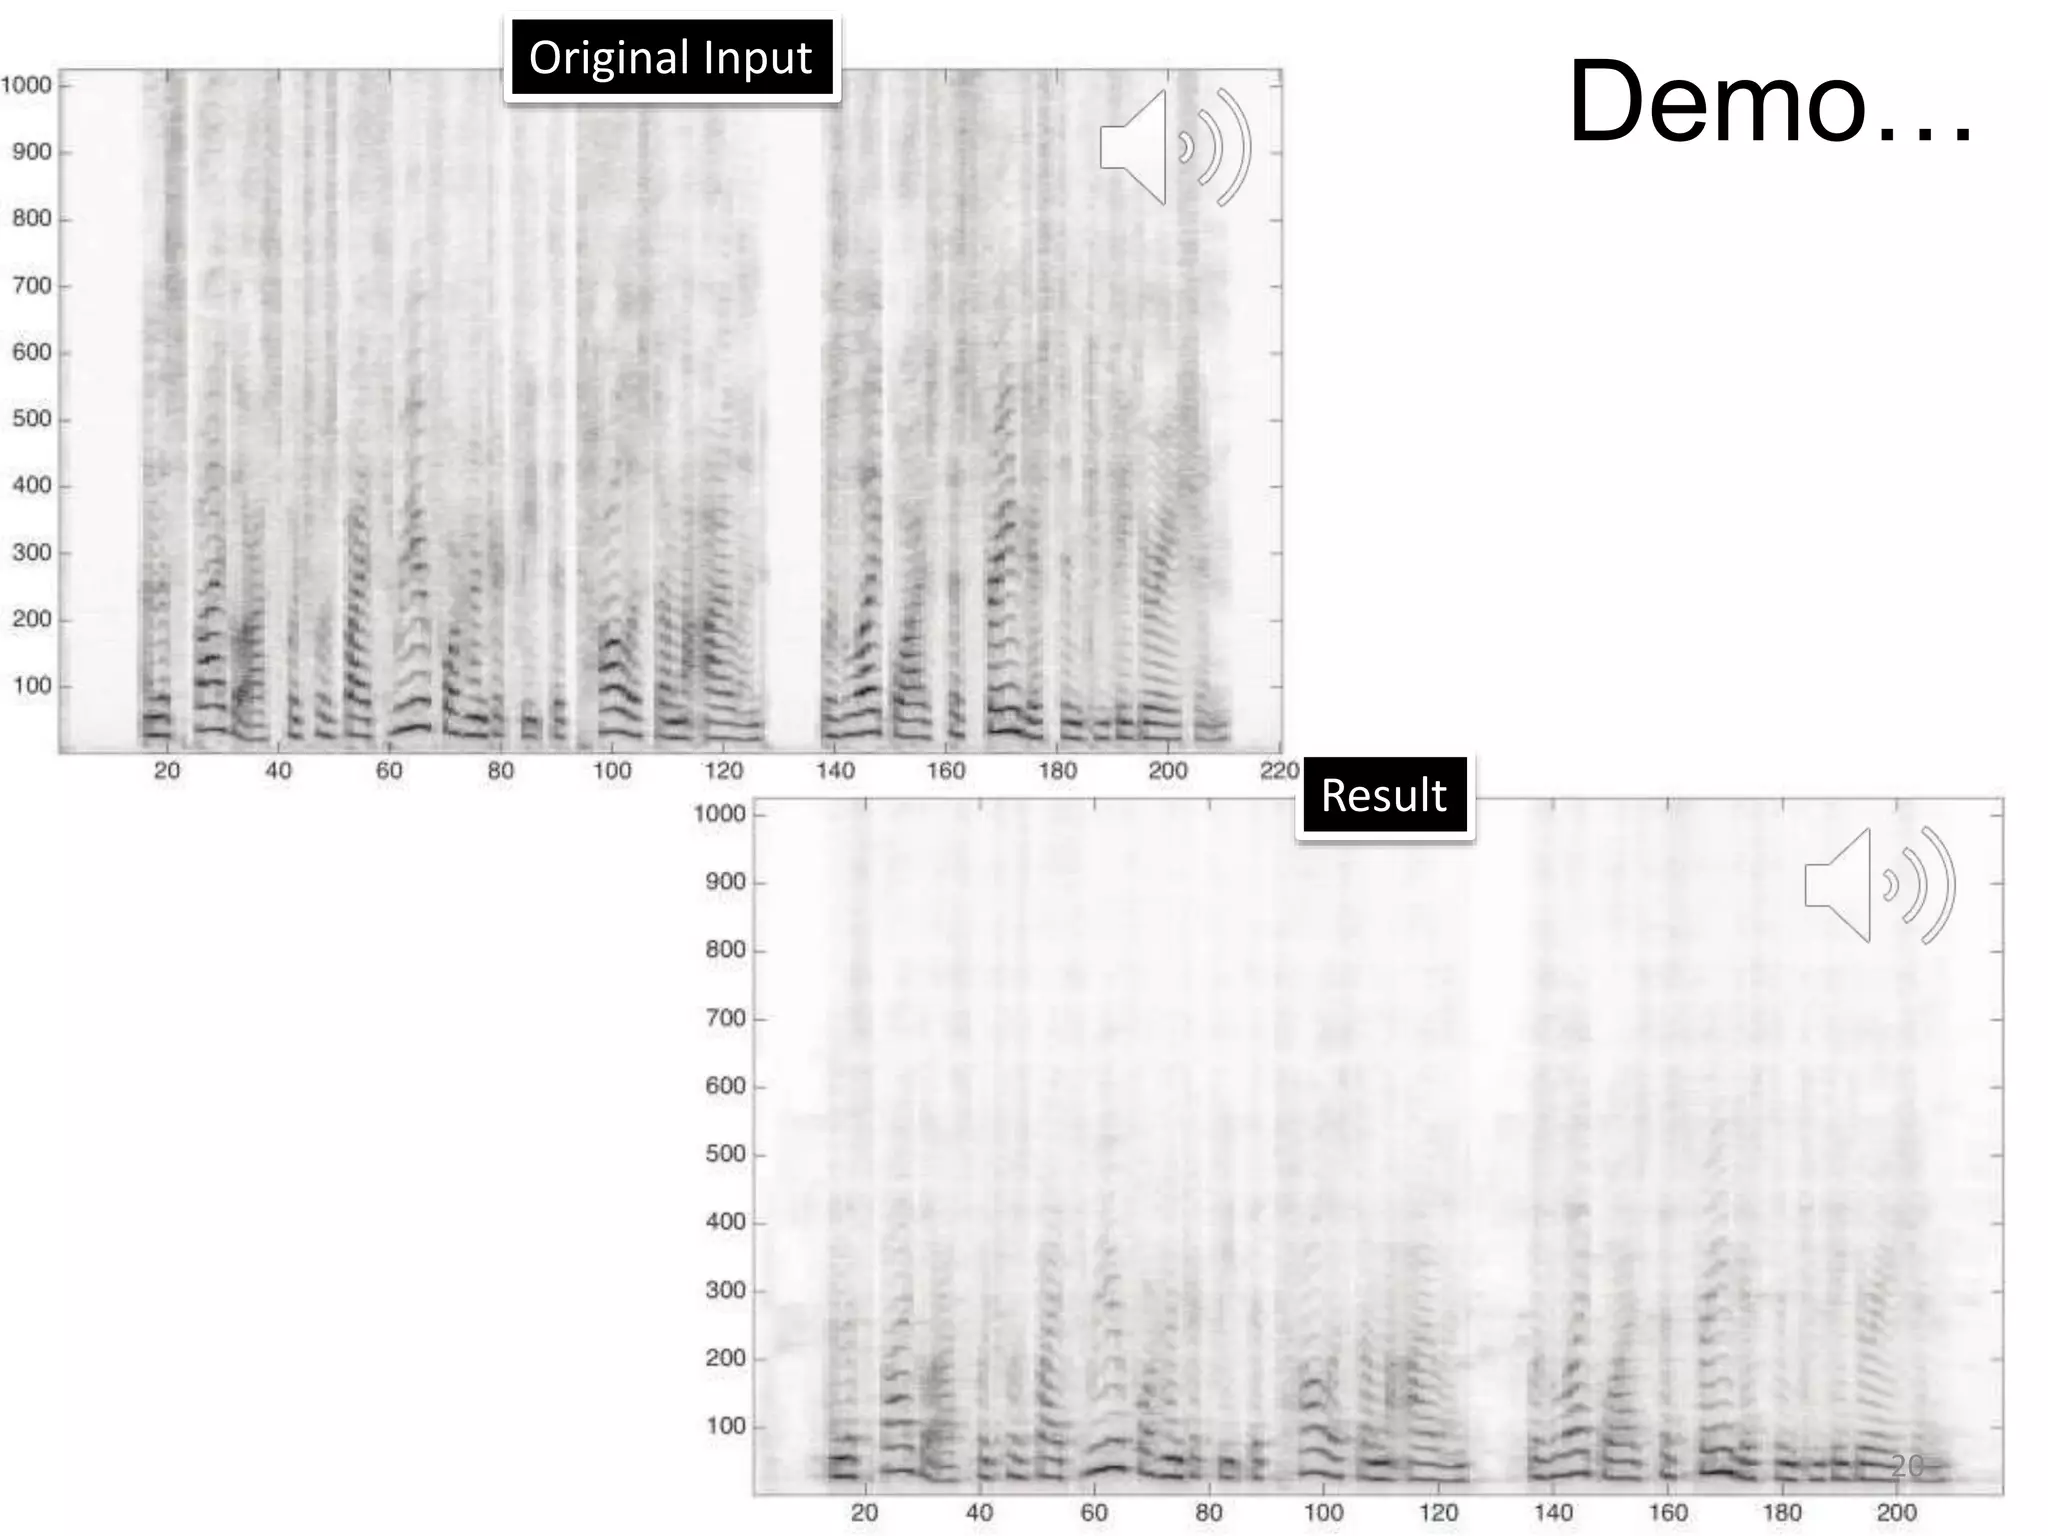
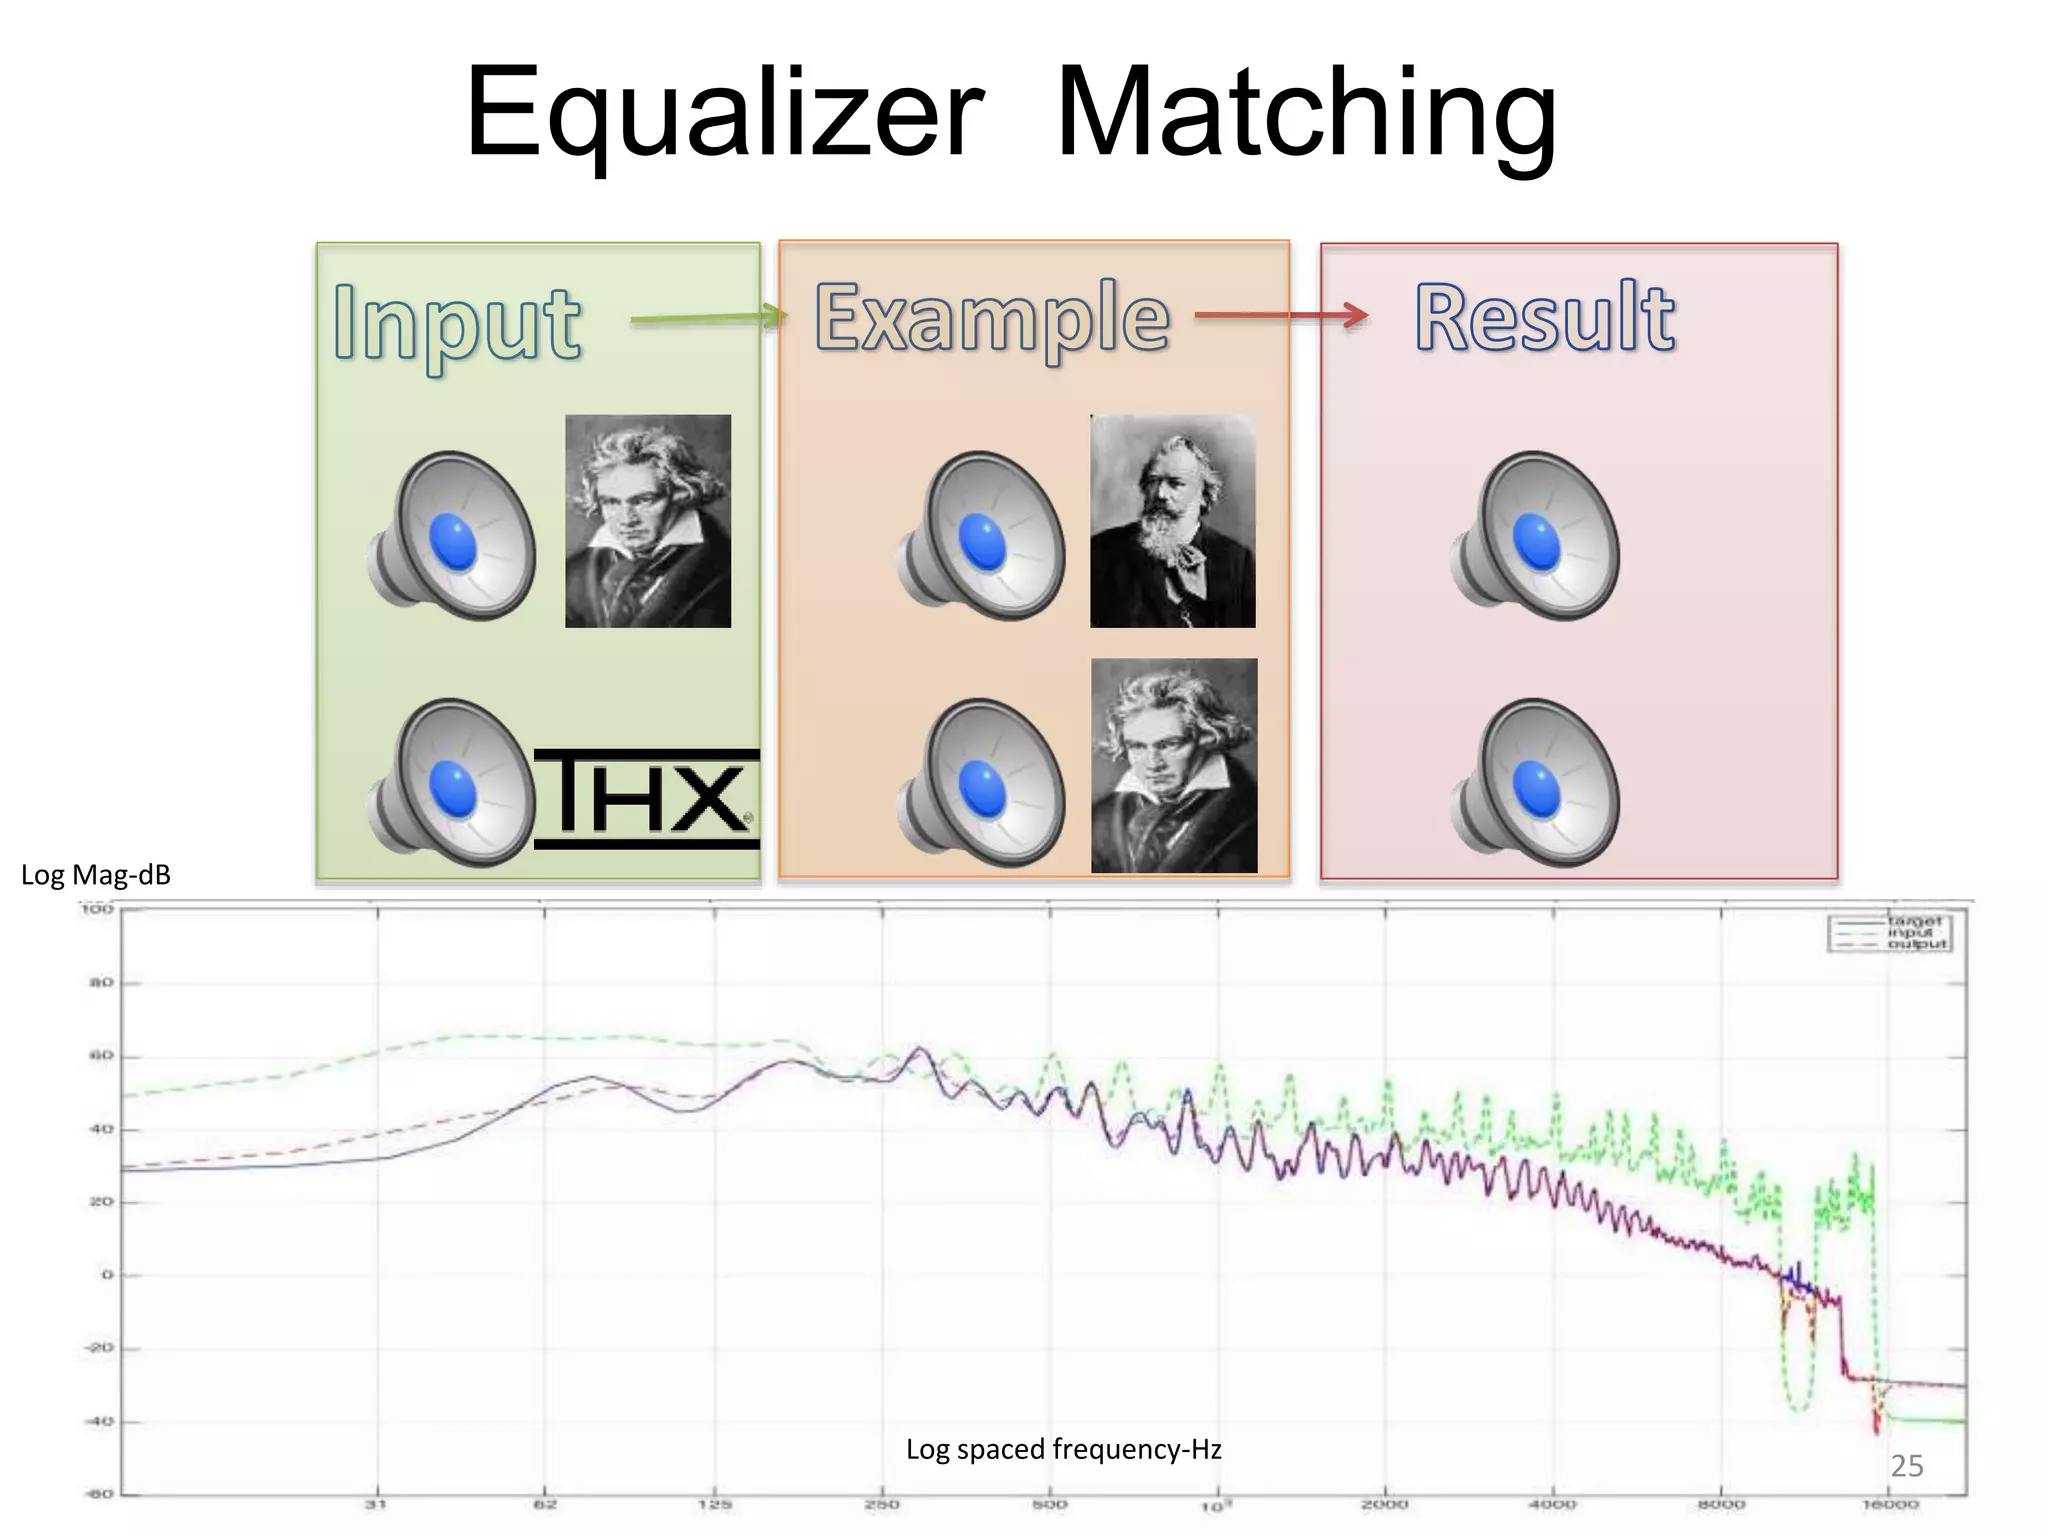
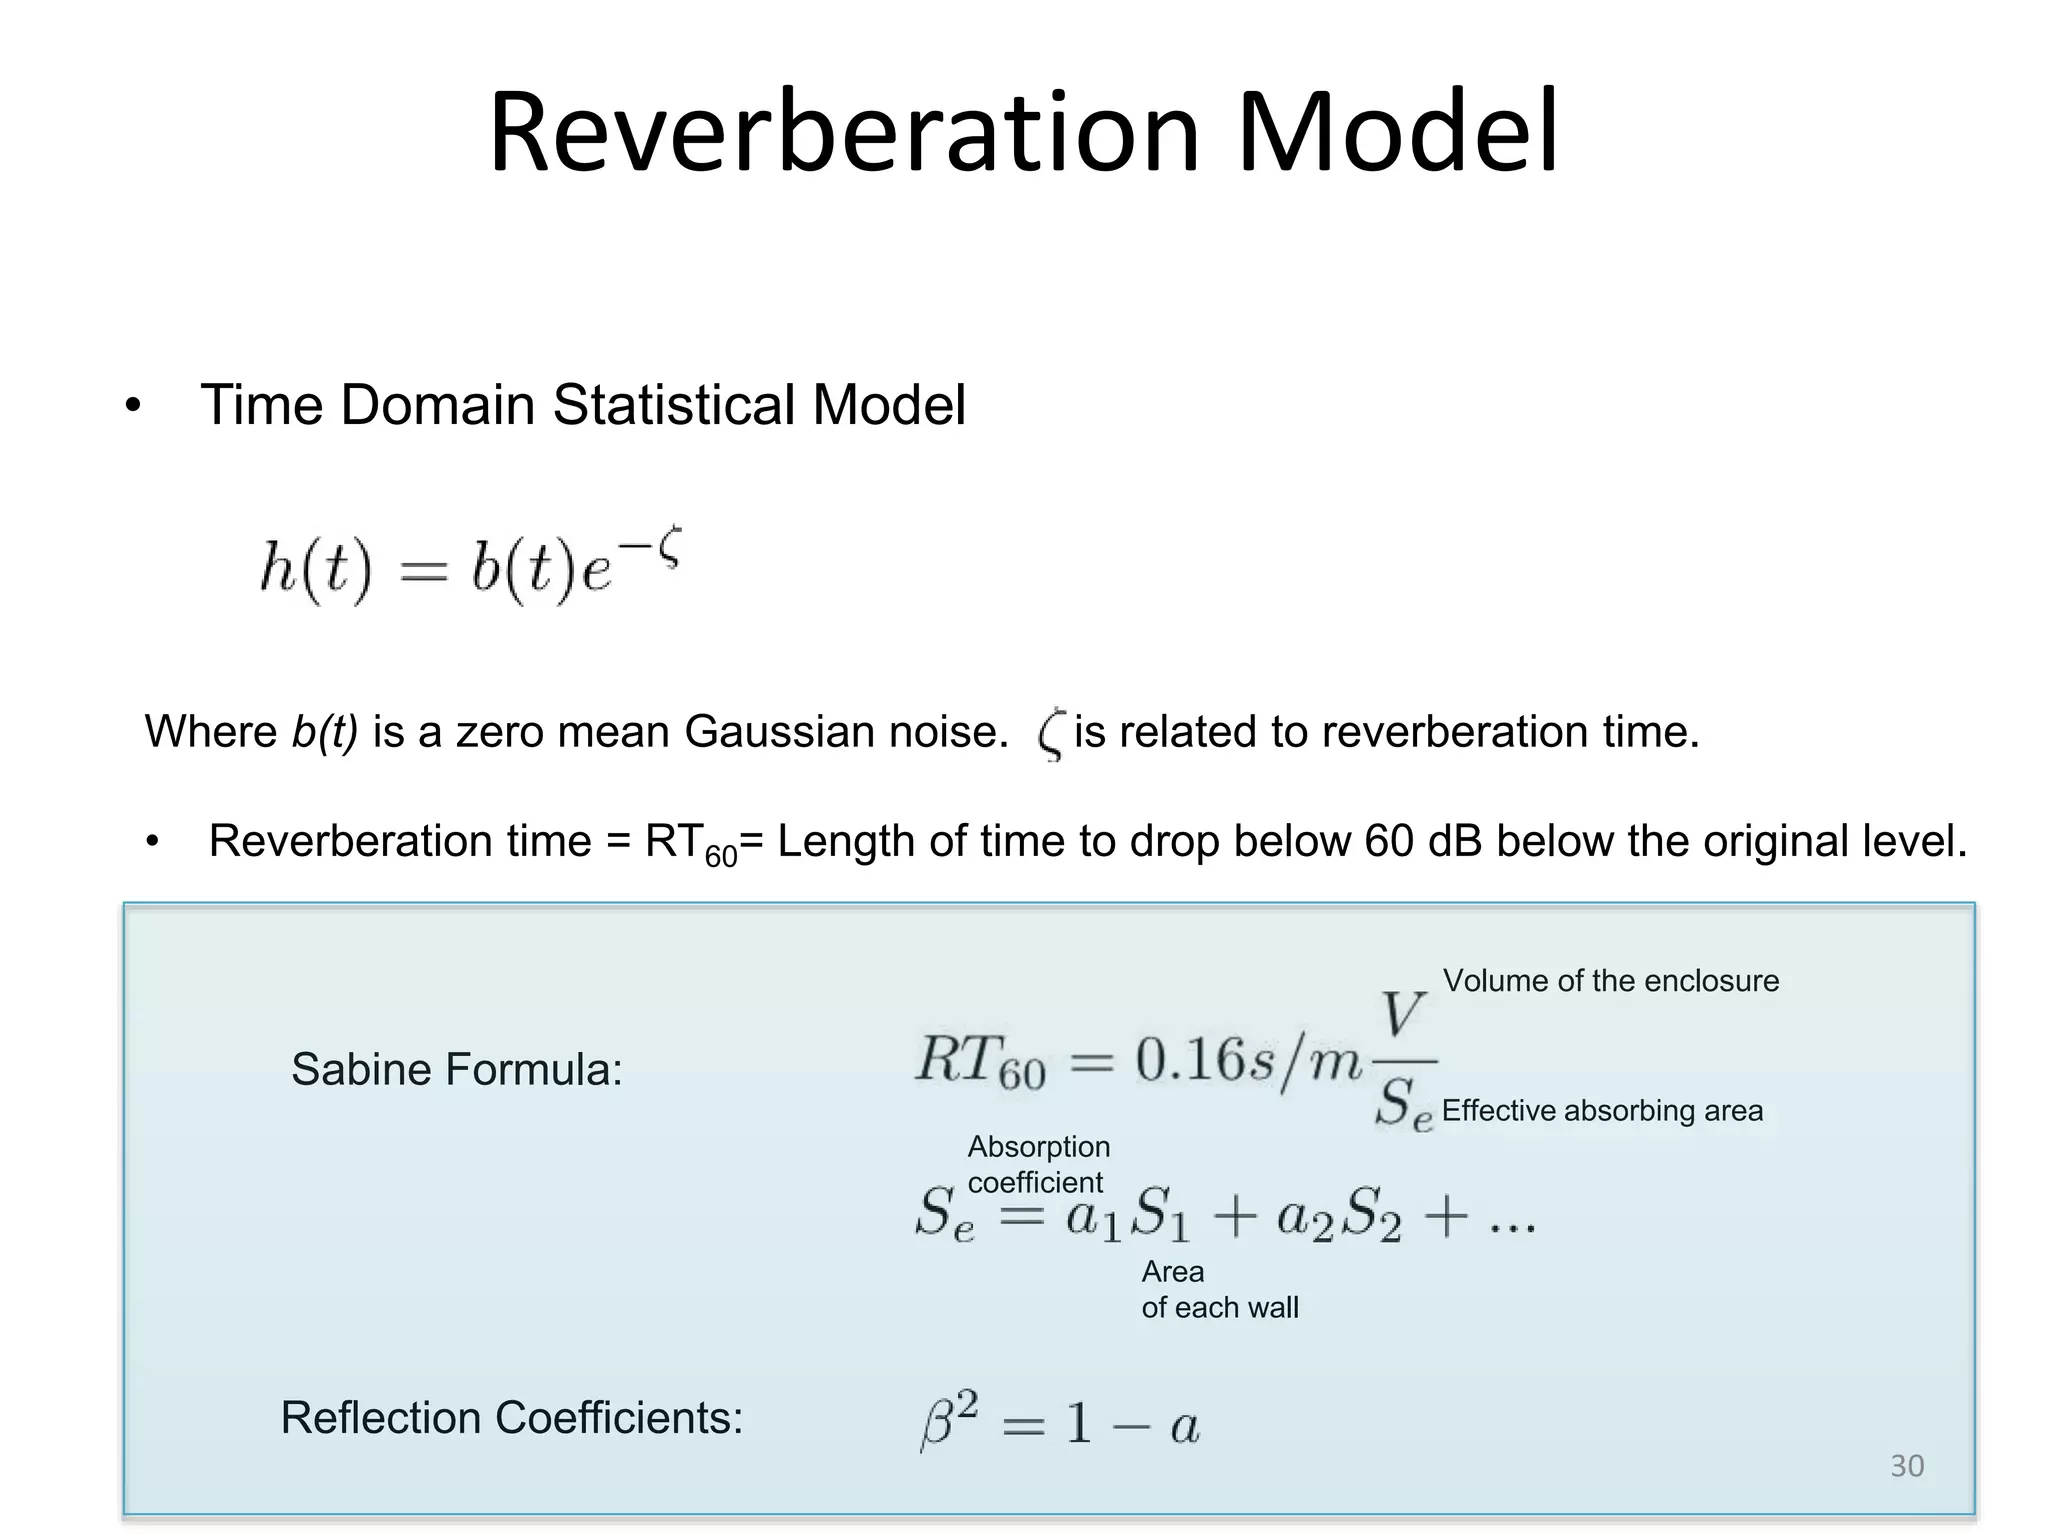
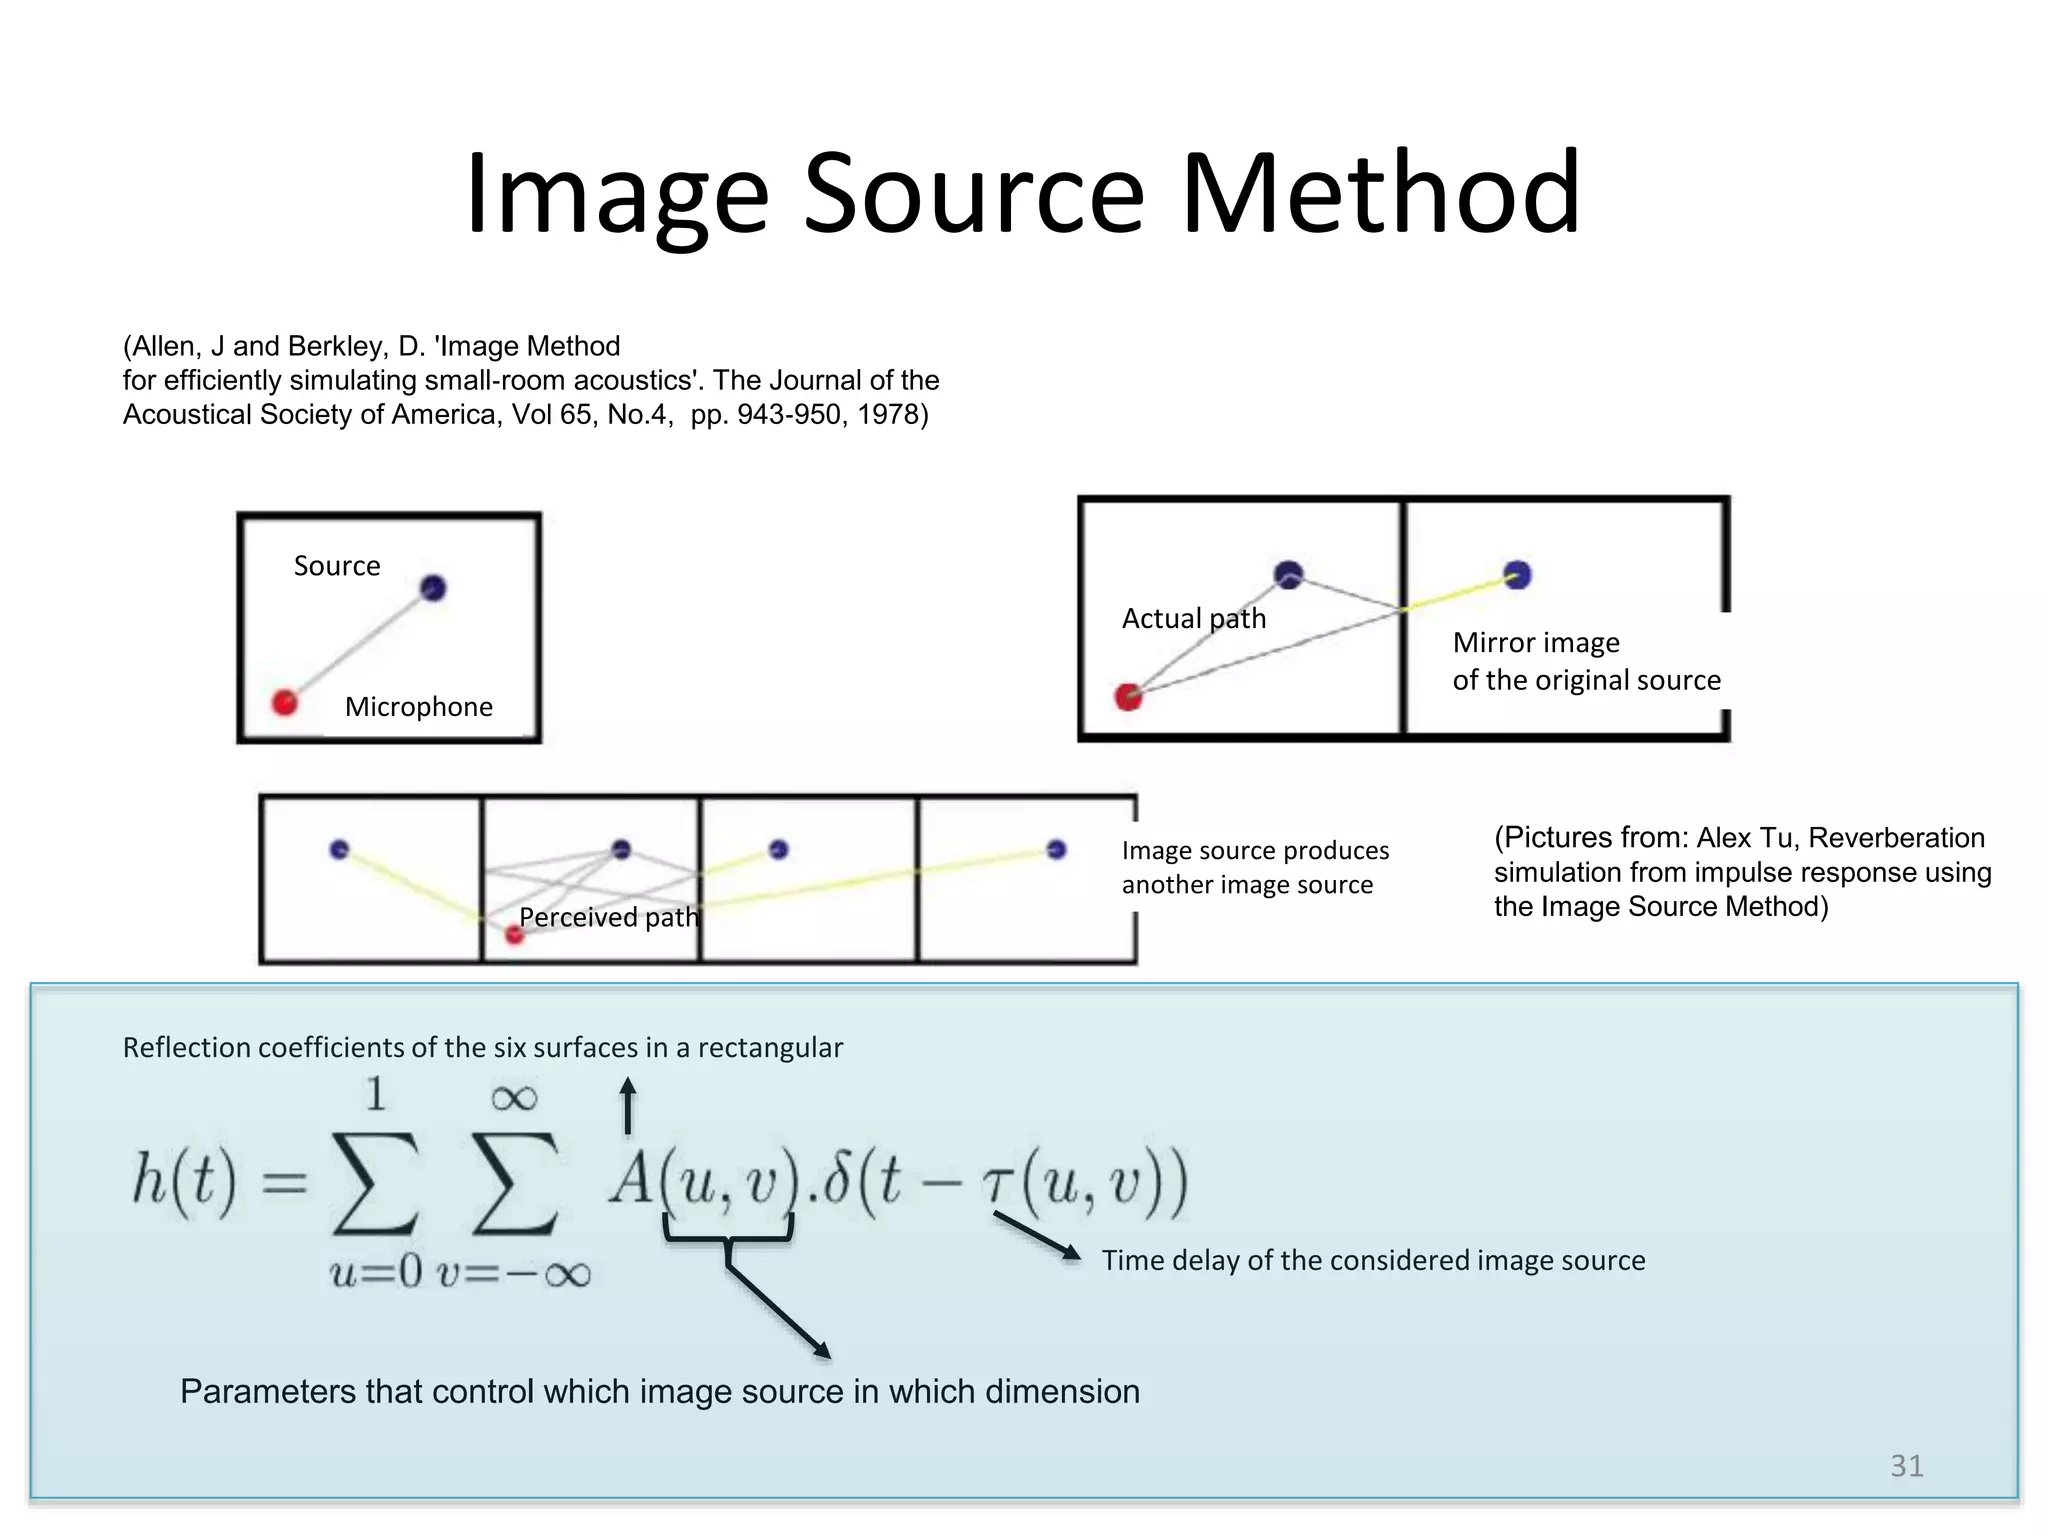
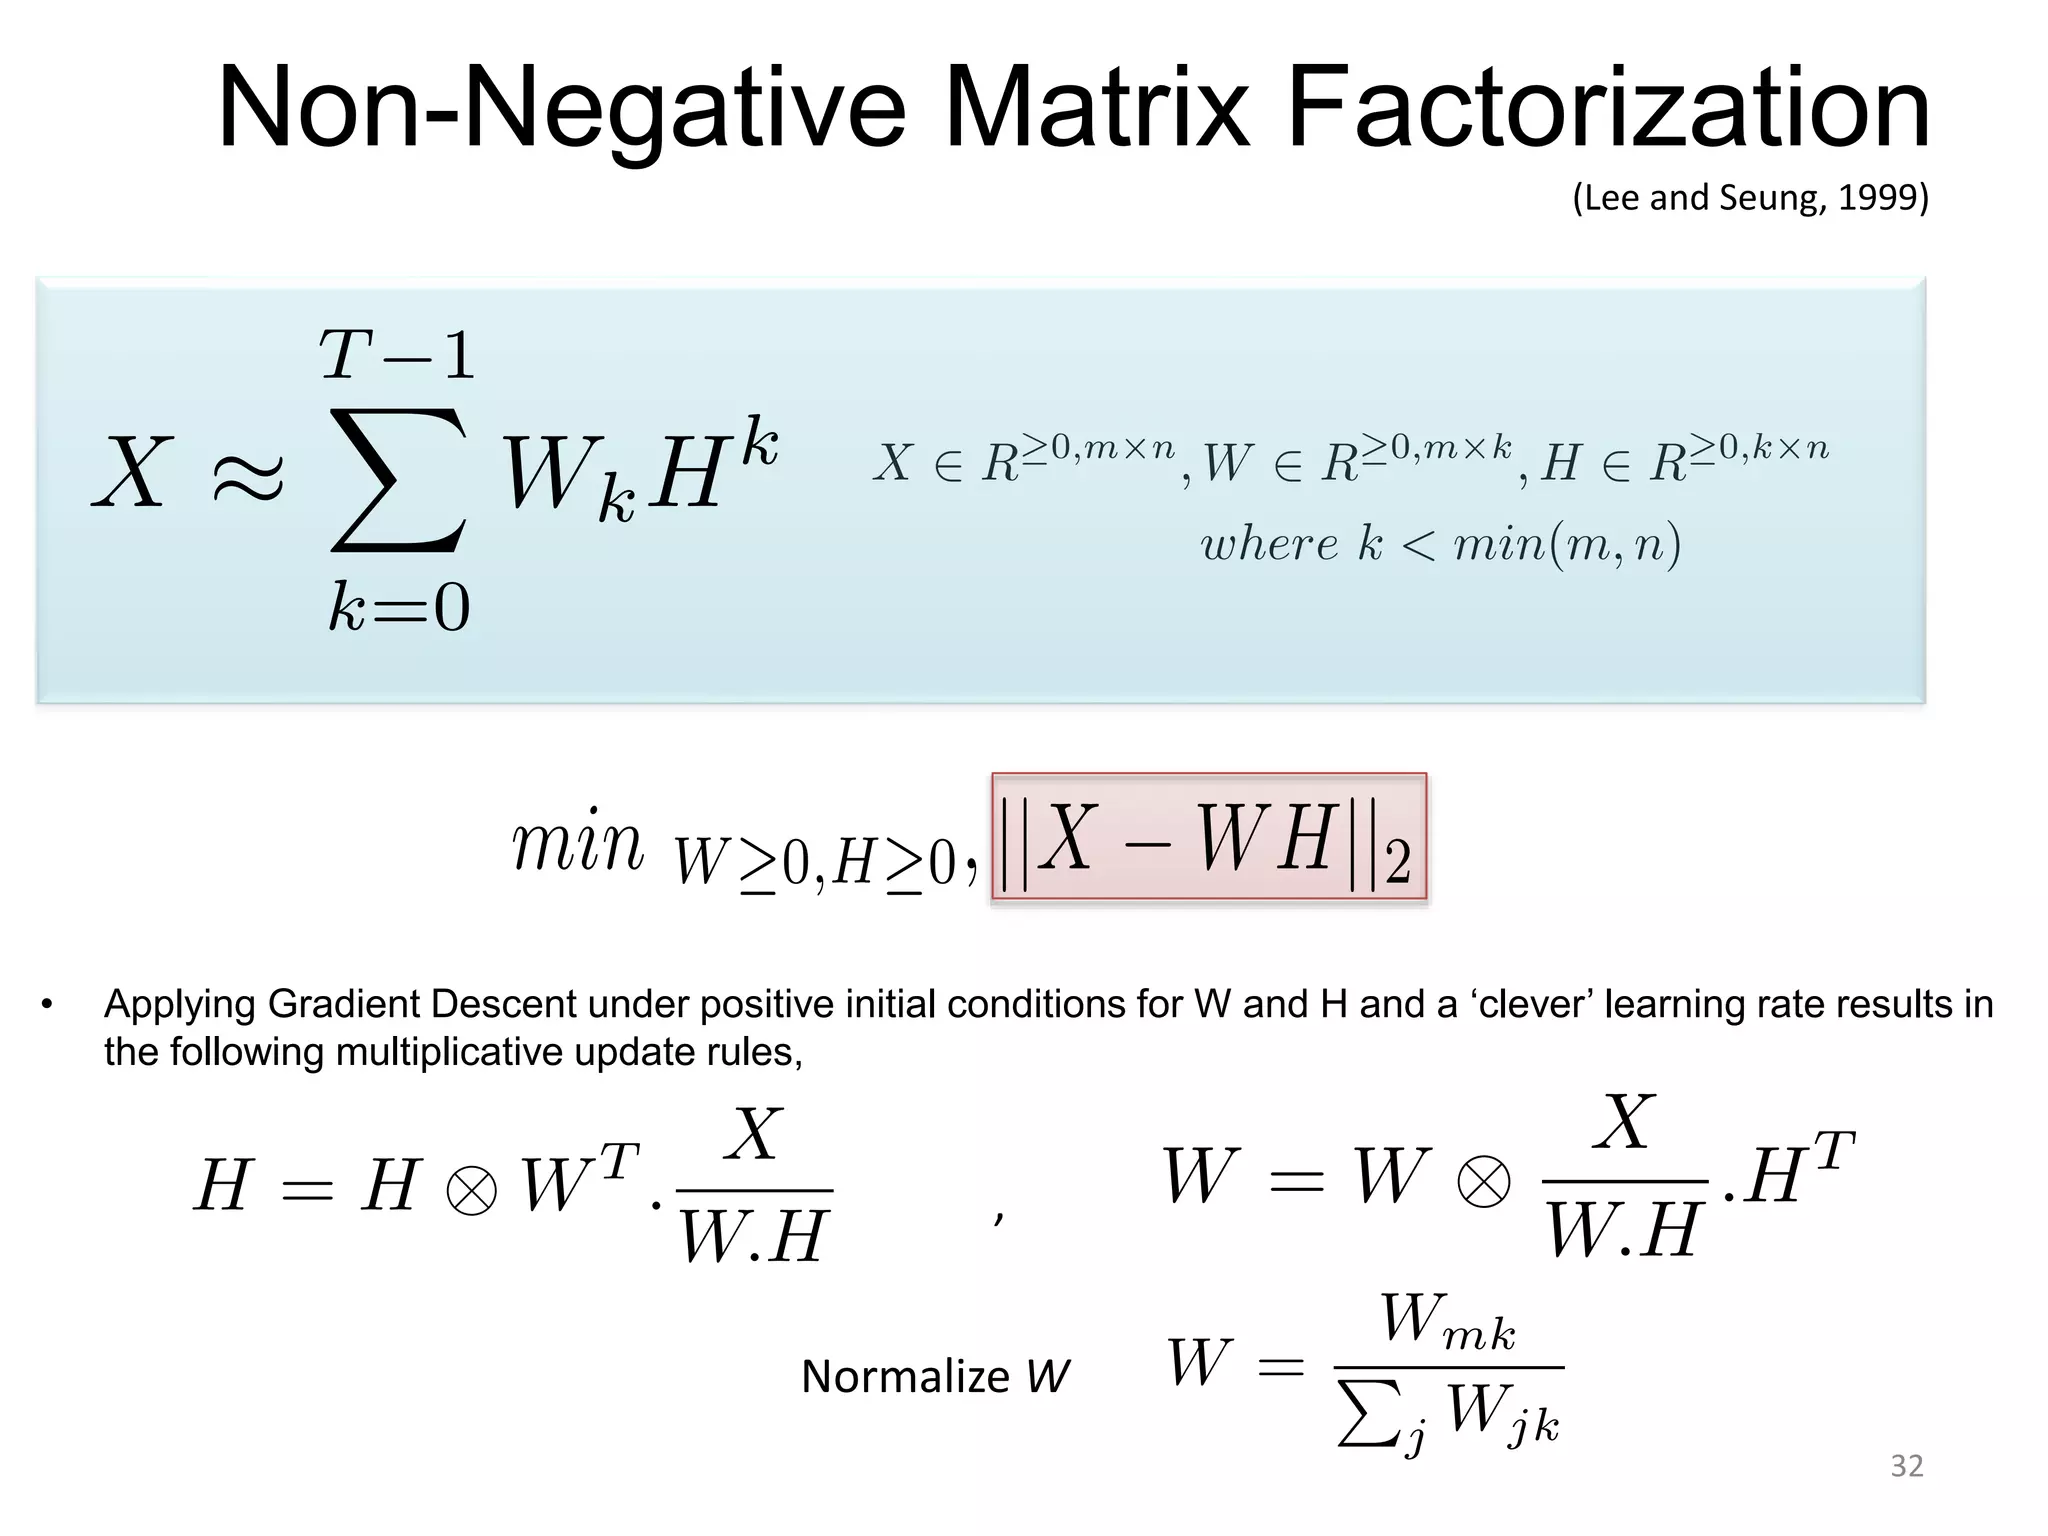
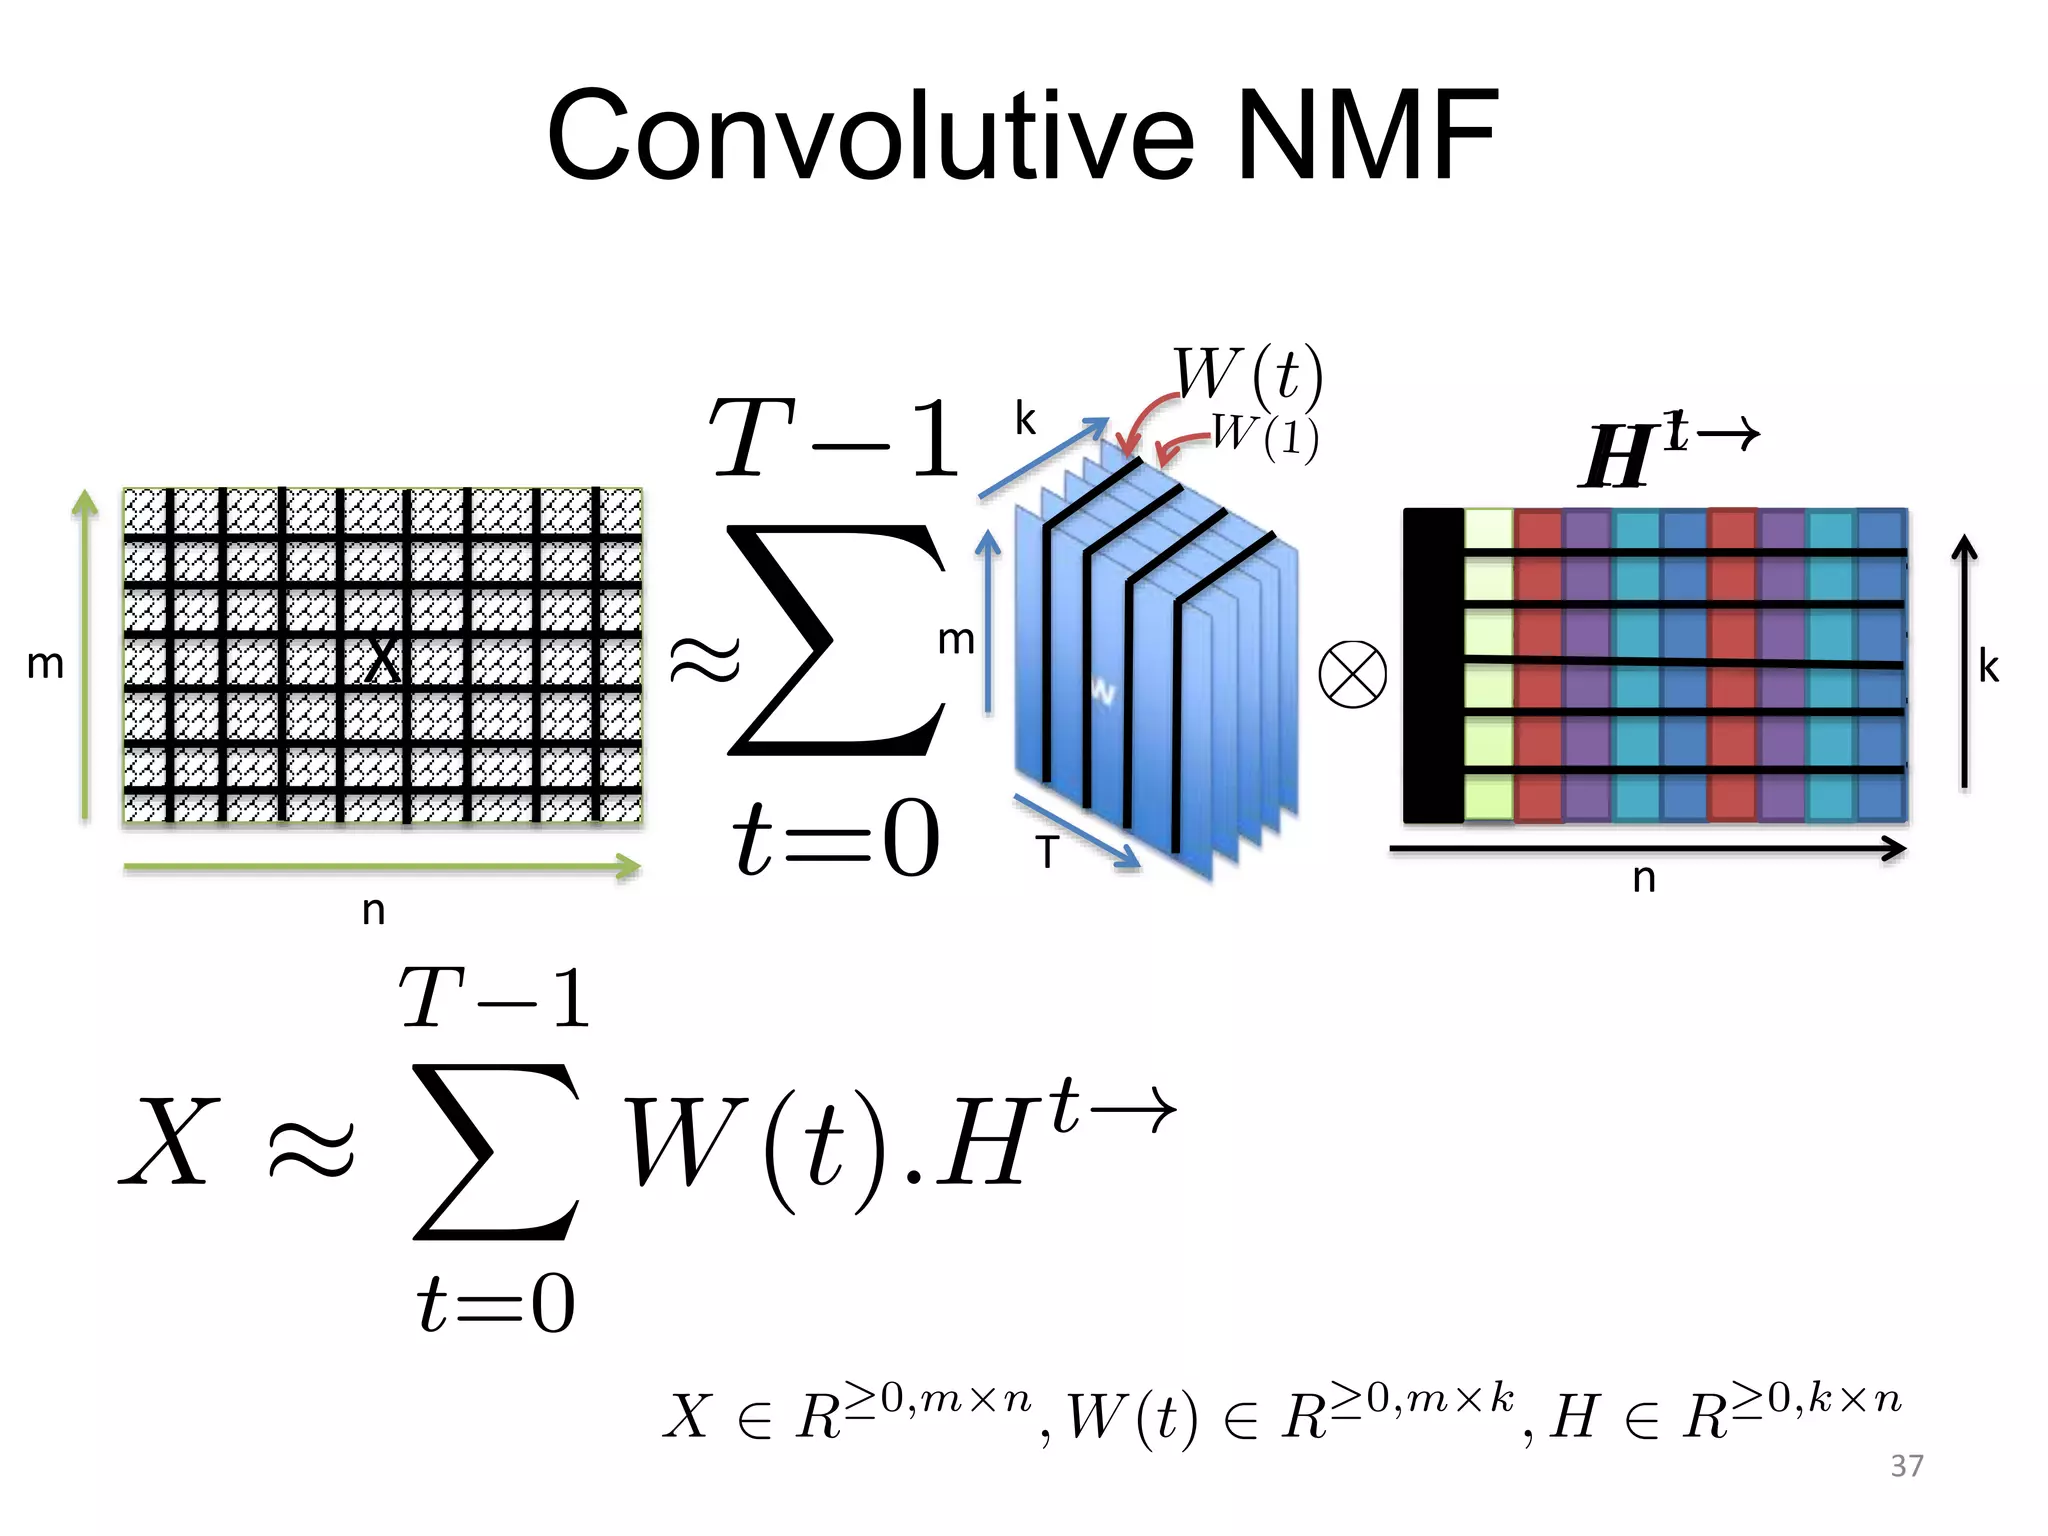
3
Example Based Audio Editing
Ramin Anushiravani
Advisor: Paris Smaragdis
Qualifying Exam Fall 15 1
Outline
• Motivation
– Why? What? How?
• Equalizer Matching
• Noise Matching
• Reverberation Matching
• Summary
2
Why? Motivation.
, ,
3
What? Graphic Equalizer.
iTunes Equalizer setting
4
How? Signal Processing!
Input
Example
Trim
Resample
to 44.1
kHz
STFT Function ISTFT
Result
Normalize
R: hop size
: time frame
L: length of the signal
Smith, J.O. Spectral Audio Signal Processing,
http://ccrma.stanford.edu/~jos/sasp/, online book,
2011 edition
k: frequency index
w: window function
Preprocessing
5
Inverse
Equalizer Matching
Power
Spectrum
STFT
Power
Spectrum
Element-wise multiplication
P Average Power Spectrum
input
example result
L Total Number of frames
Time-Invariant
6
Demo
7
Noise Matching
Denoise
Denoise
EQ
EQ +
SNRx
1
2
2:
1:
Equalizing noisy signals
Equalizing just the noise
-
-
8
Demo
example input
9
Musical
noise
Demo…
10
Denoising
Spectral Subtraction
Noise profile estimate
Estimate clean power spectrum Noise suppression
factor
Fourier transform of the noisy
signal in one frame
In practice,
• Noise profile is estimated over multiple frequency bands.
• Spectral subtraction fails at low SNR regions by creating musical noises. This artifact is
reduced by post-filtering the spectral subtraction.
(Philipos C. Loizou, Speech Enhancement
Theory and Practice, 2013)
Additive stationary noise
( Esch and Vary, Efficient Musical Noise Suppression for
Speech Enhancement Systems, 2009)
11
Reverberation
Krannert Center for the Performing Arts, Foellinger Great Hall
12
Reverberation
Falkland Palace Bottle Dungeon
reverb sound
dry sound reverb kernel
(OpenAir database, www.openairlib.net)
Approximate in the
magnitude STFT domain
Convolution between
time frames of
magnitude X and H at
each frequency index
(R. Talmon, I. Cohen, and S. Gannot, “Relative
transfer function identification using convolutive
transfer function approximation,” IEEE Trans.
Audio, Speech, and Language Process, 2009.)
13
Reverb kernel
=
14
Reverberation Matching 1
Adry
Ra
Bdry
Rb
Dereverberation
Dereverberation
Ideal case – Perfect decomposition of reverb sounds into dry sounds and
reverb kernels.
Running out of letters!
input
example
Focus is on decomposing the magnitude spectrograms into magnitude spectrograms.
I took the signals back to time domain using the reverberated input phase information.
15
Convolutive Non-negative Matrix Factorization
Update Equations:
,
Paul O’Grady & Barak Pearkmutter, Convolutive NMF with a
Sparseness Constraint, MLSP Conference, 2006
Convolution of non-
negative matrices
Shift operator
Spectrum at time frame t
Matrix of size
Ly x k with all
its elements
set to 1.
16
Dereverberation
• Initialize with positive random values.
• Initialize with positive exponential decays.
• On each iteration, enforce anti-sparsity on ,
I dropped indices and absolute values, but they’re there.
17
Set of dry speech bases (trained offline)
Corresponding activation
Reverberated activation matrix
Dereverberation
We can do better by using more prior knowledge.
Convolution is associative
average R over multiple
frequency bands
(Paris Smaragdis, “Convolutive speech
bases and their application to supervised
speech separation,” in Speech And Audio
Processing. IEEE, 2007)
18
Demo
Dereverberated
Reverb
HrWc
R
Hc
Fixed
19
Result
Original Input
Demo…
20
Reverberation Matching 2
Adry
Ra
Bdry
Rb
Dereverberation
Dereverberation
input
example
result
+
Suppress Artifact
Match Kernels
21
Example- Input
Example- Result
Summary
=>
Find power spectrums => Find EQ filter to match them. => Multiply the
EQ filter with every time frame in the input sound magnitude spectrogram.
=>
Denoise => EQ match the estimated clean and noise signals
individually. => Add the resulting input noise to the resulting clean signal
using their original SNR.
=>
Decompose to dry sound and reverb kernels => Convolve the
estimated dry input sound with the example sound’s estimated reverb
kernel.
22
23
24
Equalizer Matching
Log Mag-dB
Log spaced frequency-Hz
25
Spectral Subtraction
noisy Signal clean Signal noise
A common assumption in most papers:
Noise and the clean signal are uncorrelated.
(Philipos C. Loizou, Speech Enhancement
Theory and Practice, 2013)
Fourier Transform over a segment of x(n).
AWGN. Same over all clean input segments.
Estimated Noise PSD.
In practice H is learned
over different
frequency bands.
26
Musical Noise Reduction
( Esch and Vary, Efficient Musical Noise Suppression for
Speech Enhancement Systems, 2009)
Aim: Retain the naturalness of the
remaining background noise.
How?
• 1
Detect low SNR frames based on the
noisy signal and the estimated clean signal.
• 2
Design a smoothing window based on 1.
Lower the SNR, longer the window.
• 3
Design a post-filter to smooth the low SNR
frames, i.e. an FIR low pass filter designed
based on 2.
• 3
Element-wise multiply the noise suppression
factor by 2.
Step 3
Enhanced Spectral Subtraction 27
SS + Musical Noise Reduction
G.*H Musical Suppression PostFilterSNR= 22 dB
Noisy Input
Much Better!
.^2 .^2
(
(
.^0.5
28
Metrics for Ideal Reverberation
time
Magnitude-dB
Energy Decay Relief
Energy Decay Curve
EDC at multiple frequency bands
29
Reverberation Model
• Time Domain Statistical Model
Where b(t) is a zero mean Gaussian noise. is related to reverberation time.
• Reverberation time = RT60= Length of time to drop below 60 dB below the original level.
Sabine Formula:
Volume of the enclosure
Effective absorbing area
Area
of each wall
Absorption
coefficient
Reflection Coefficients:
30
Image Source Method
Source
Microphone
Mirror image
of the original source
Actual path
Perceived path
Image source produces
another image source
(Allen, J and Berkley, D. 'Image Method
for efficiently simulating small‐room acoustics'. The Journal of the
Acoustical Society of America, Vol 65, No.4, pp. 943‐950, 1978)
(Pictures from: Alex Tu, Reverberation
simulation from impulse response using
the Image Source Method)
Parameters that control which image source in which dimension
Reflection coefficients of the six surfaces in a rectangular
Time delay of the considered image source
31
Non-Negative Matrix Factorization
,
• Applying Gradient Descent under positive initial conditions for W and H and a ‘clever’ learning rate results in
the following multiplicative update rules,
(Lee and Seung, 1999)
Normalize W
32
Why NMF? (Lee and Seung, 1999)
Visually meaningful.
Decomposition can only be
positive. Part based
presentation.
Statistically meaningful.
Eigen faces are in the
direction of the largest
variance. Subtraction can
occur.
33
Why NMF?
m,Frequency
n, time Frame
k, Components = 2 n, time framem,Frequency
k,Components=2
W HX
34
Why Not NMF?
(Adopted from: Paul O’Grady & Barak Pearkmutter, Convolutive NMF
with a Sparseness Constraint, MLSP Conference, 2006)
35
Convolutive NMF
36
Convolutive NMF
T
H
m
k
k
n
X
n
m
37
Convolutive NMF
Iteration 1Iteration 2Iteration 3Iteration 10
38
Spectral Subtraction
SNR= 22 dB
Musical Noise –
mainly at low SNR regions
Noisy Input
Denoised-ish?
Go back to time domain
Use noisy input phase
H – Noise Suppression Factor
.^2 .^2
(
(.^0.5
39
With Musical Noise
SNR= 22 dB
Same results, better colormap?
Without Musical Noise
Noisy Signal
40

example based audio editing

  • 1.
    3 Example Based AudioEditing Ramin Anushiravani Advisor: Paris Smaragdis Qualifying Exam Fall 15 1
  • 2.
    Outline • Motivation – Why?What? How? • Equalizer Matching • Noise Matching • Reverberation Matching • Summary 2
  • 3.
  • 4.
  • 5.
    How? Signal Processing! Input Example Trim Resample to44.1 kHz STFT Function ISTFT Result Normalize R: hop size : time frame L: length of the signal Smith, J.O. Spectral Audio Signal Processing, http://ccrma.stanford.edu/~jos/sasp/, online book, 2011 edition k: frequency index w: window function Preprocessing 5
  • 6.
    Inverse Equalizer Matching Power Spectrum STFT Power Spectrum Element-wise multiplication PAverage Power Spectrum input example result L Total Number of frames Time-Invariant 6
  • 7.
  • 8.
    Noise Matching Denoise Denoise EQ EQ + SNRx 1 2 2: 1: Equalizingnoisy signals Equalizing just the noise - - 8
  • 9.
  • 10.
  • 11.
    Denoising Spectral Subtraction Noise profileestimate Estimate clean power spectrum Noise suppression factor Fourier transform of the noisy signal in one frame In practice, • Noise profile is estimated over multiple frequency bands. • Spectral subtraction fails at low SNR regions by creating musical noises. This artifact is reduced by post-filtering the spectral subtraction. (Philipos C. Loizou, Speech Enhancement Theory and Practice, 2013) Additive stationary noise ( Esch and Vary, Efficient Musical Noise Suppression for Speech Enhancement Systems, 2009) 11
  • 12.
    Reverberation Krannert Center forthe Performing Arts, Foellinger Great Hall 12
  • 13.
    Reverberation Falkland Palace BottleDungeon reverb sound dry sound reverb kernel (OpenAir database, www.openairlib.net) Approximate in the magnitude STFT domain Convolution between time frames of magnitude X and H at each frequency index (R. Talmon, I. Cohen, and S. Gannot, “Relative transfer function identification using convolutive transfer function approximation,” IEEE Trans. Audio, Speech, and Language Process, 2009.) 13
  • 14.
  • 15.
    Reverberation Matching 1 Adry Ra Bdry Rb Dereverberation Dereverberation Idealcase – Perfect decomposition of reverb sounds into dry sounds and reverb kernels. Running out of letters! input example Focus is on decomposing the magnitude spectrograms into magnitude spectrograms. I took the signals back to time domain using the reverberated input phase information. 15
  • 16.
    Convolutive Non-negative MatrixFactorization Update Equations: , Paul O’Grady & Barak Pearkmutter, Convolutive NMF with a Sparseness Constraint, MLSP Conference, 2006 Convolution of non- negative matrices Shift operator Spectrum at time frame t Matrix of size Ly x k with all its elements set to 1. 16
  • 17.
    Dereverberation • Initialize withpositive random values. • Initialize with positive exponential decays. • On each iteration, enforce anti-sparsity on , I dropped indices and absolute values, but they’re there. 17
  • 18.
    Set of dryspeech bases (trained offline) Corresponding activation Reverberated activation matrix Dereverberation We can do better by using more prior knowledge. Convolution is associative average R over multiple frequency bands (Paris Smaragdis, “Convolutive speech bases and their application to supervised speech separation,” in Speech And Audio Processing. IEEE, 2007) 18
  • 19.
  • 20.
  • 21.
  • 22.
    Summary => Find power spectrums=> Find EQ filter to match them. => Multiply the EQ filter with every time frame in the input sound magnitude spectrogram. => Denoise => EQ match the estimated clean and noise signals individually. => Add the resulting input noise to the resulting clean signal using their original SNR. => Decompose to dry sound and reverb kernels => Convolve the estimated dry input sound with the example sound’s estimated reverb kernel. 22
  • 23.
  • 24.
  • 25.
    Equalizer Matching Log Mag-dB Logspaced frequency-Hz 25
  • 26.
    Spectral Subtraction noisy Signalclean Signal noise A common assumption in most papers: Noise and the clean signal are uncorrelated. (Philipos C. Loizou, Speech Enhancement Theory and Practice, 2013) Fourier Transform over a segment of x(n). AWGN. Same over all clean input segments. Estimated Noise PSD. In practice H is learned over different frequency bands. 26
  • 27.
    Musical Noise Reduction (Esch and Vary, Efficient Musical Noise Suppression for Speech Enhancement Systems, 2009) Aim: Retain the naturalness of the remaining background noise. How? • 1 Detect low SNR frames based on the noisy signal and the estimated clean signal. • 2 Design a smoothing window based on 1. Lower the SNR, longer the window. • 3 Design a post-filter to smooth the low SNR frames, i.e. an FIR low pass filter designed based on 2. • 3 Element-wise multiply the noise suppression factor by 2. Step 3 Enhanced Spectral Subtraction 27
  • 28.
    SS + MusicalNoise Reduction G.*H Musical Suppression PostFilterSNR= 22 dB Noisy Input Much Better! .^2 .^2 ( ( .^0.5 28
  • 29.
    Metrics for IdealReverberation time Magnitude-dB Energy Decay Relief Energy Decay Curve EDC at multiple frequency bands 29
  • 30.
    Reverberation Model • TimeDomain Statistical Model Where b(t) is a zero mean Gaussian noise. is related to reverberation time. • Reverberation time = RT60= Length of time to drop below 60 dB below the original level. Sabine Formula: Volume of the enclosure Effective absorbing area Area of each wall Absorption coefficient Reflection Coefficients: 30
  • 31.
    Image Source Method Source Microphone Mirrorimage of the original source Actual path Perceived path Image source produces another image source (Allen, J and Berkley, D. 'Image Method for efficiently simulating small‐room acoustics'. The Journal of the Acoustical Society of America, Vol 65, No.4, pp. 943‐950, 1978) (Pictures from: Alex Tu, Reverberation simulation from impulse response using the Image Source Method) Parameters that control which image source in which dimension Reflection coefficients of the six surfaces in a rectangular Time delay of the considered image source 31
  • 32.
    Non-Negative Matrix Factorization , •Applying Gradient Descent under positive initial conditions for W and H and a ‘clever’ learning rate results in the following multiplicative update rules, (Lee and Seung, 1999) Normalize W 32
  • 33.
    Why NMF? (Leeand Seung, 1999) Visually meaningful. Decomposition can only be positive. Part based presentation. Statistically meaningful. Eigen faces are in the direction of the largest variance. Subtraction can occur. 33
  • 34.
    Why NMF? m,Frequency n, timeFrame k, Components = 2 n, time framem,Frequency k,Components=2 W HX 34
  • 35.
    Why Not NMF? (Adoptedfrom: Paul O’Grady & Barak Pearkmutter, Convolutive NMF with a Sparseness Constraint, MLSP Conference, 2006) 35
  • 36.
  • 37.
  • 38.
    Convolutive NMF Iteration 1Iteration2Iteration 3Iteration 10 38
  • 39.
    Spectral Subtraction SNR= 22dB Musical Noise – mainly at low SNR regions Noisy Input Denoised-ish? Go back to time domain Use noisy input phase H – Noise Suppression Factor .^2 .^2 ( (.^0.5 39
  • 40.
    With Musical Noise SNR=22 dB Same results, better colormap? Without Musical Noise Noisy Signal 40

Editor's Notes

  • #5 Why? What?
  • #6 Fix the STFT equations
  • #9 Use the powerful yet so simple equalizer matching to do denoising as well.
  • #14 Well, now we can’t ignore time here anymore. Reverbs are usually longer than a time-frame and are presented in a convolutive manner. FIR filtering here gives you too many taps, and even when inversing you have to deal with whether its minimum phase and invertible and …
  • #15 Use a sound that gives you a less artifacty result.
  • #16 Def of conv2
  • #22 Put some sounds here…
  • #23 If you’re interested I designed a user inteface to play with.
  • #27 Might want to get rid of details and only show some to intrigue questions
  • #30   is the total amount of signal energy remaining in the reverberator impulse response at time   (Smith, J.O. "Delay Lines", in Physical Audio Signal Processing, http://ccrma.stanford.edu/~jos/pasp/Delay_Lines.html, online book, 2010 edition)
  • #31 Polask statistical reverb model
  • #32 http://ses.library.usyd.edu.au/bitstream/2123/10601/2/Reverberation%20simulation%20from%20impulse%20response.pdf
  • #40 Use a more interesting realistic noise on false colormap Add musical noise result as well