SlideShare a Scribd company logo
1 of 10
Download to read offline
Contents                                                           Stockmarket Indices (rebased with 31 Oct 2012 = 100)

      2   National accounts                                                  Bahrain            Kuwait           Oman           Saudi Arabia
      3   Balance of payments and trade
      4   Budget and population                                              Dubai              Abu Dhabi        Qatar
      4   Money and prices                                         105
      5   Feature analysis: New macro forecasts                    104
      6   Economic news
      6   Public companies news                                    103
      7   Private sector news
      8   Banking sector data and snapshot                         102
     10   Qatar Exchange market data                               101

News Headlines                                                     100

                                                                   99
Economic News
                                                                   98
    Fastest growing economy in GCC in 2013
    S&P maintains AA rating for Qatar                             97
    KPMG: Qatar’s prospects “bright” with gas abundance
                                                                   96
    GCC insulated from future global shocks
    Budget slips into QR18.5bn deficit in Q2 2012                 95
    Upsurge in project tenders due to World Cup preparations       31‐Oct    5‐Nov    10‐Nov     15‐Nov    20‐Nov   25‐Nov   30‐Nov
    $140bn on infrastructure projects over next five years
    Inward FDI stock estimated at $31bn in Qatar                  The Qatar Exchange (QE) Index ended November in negative
    $13.1bn investment in power over next eight years             territory, declining 1.7%. All sectors declined across the board,
    Emir approves setting up of public utilities panel            with notable declines in the real estate, consumer and insurance
    The QCB issued QR4bn in treasury bills                        sectors. However, the marginal 0.4% loss posted by the
                                                                   transportation sector, owing to the cancellation of Milaha’s rights
                                                                   issue, limited the index’s overall decline. It is worth mentioning
Public companies                                                   that among the large caps, Doha Bank was the primary laggard
                                                                   due to its expected capital increase.
    Qatar Holding asset management JV with Credit Suisse
    Qatar Holding cashes in on remaining Barclays warrants        Elsewhere in the GCC, Kuwait was the only market to make
    QP eyes shale gas opportunities in US                         convincing gains (up 3.1%) while Abu Dhabi was flattish.
    Qatar to supply gas for Croatian LNG terminal                 Kuwait’s performance was helped by market chatter that the
    QP and Total agree another 25 years of oil field operations   Kuwait Investment Authority (KIA) was intervening in the market
    QP and Shell’s Al-Karaana project to be awarded in 2013       after a drop of 3.6% in October (owing to political unrest). Other
                                                                   regional markets ended in negative territory. The looming US
                                                                   fiscal cliff along with political/social unrest in the MENA region
Private Sector                                                     has been a drag on the regional markets. The Saudi market was
                                                                   particularly impacted following weak corporate earnings
    Qatar may rival UAE financial crown                           expectations and speculation on the King’s health.
    Two Qatari companies in FT Top 500 list
    QNB Group raises $1bn to fuel expansion drive
                                                                   Qatar Economic Insight 2012 Published
    QNB offers competitive land financing rate
    Ahli Bank: Top shareholder to sell most of its stake
                                                                                                            QNB’s latest report provides
    EFSA: EFG-Hermes needs approvals for QInvest venture
                                                                                                            a detailed overview of the
    QInvest arranges Islamic syndicated facility for Mazaya
                                                                                                            Qatari economy and includes
    Qatar Telecom signs $500mn debut Islamic finance deal
                                                                                                            historical data, analysis and
    Emir inaugurated QAPCO’s QR2.2bn LDPE plant
                                                                                                            forecasts.
    QP-QAPCO $7bn JV project on track for 2018 completion
    Qatar National Cement inks contract for clinker plant                                                  For further detail please
    Qatar, Algeria in steel factory deal                                                                   see the full report. The
    Algeria and Qatar to build fertilizer complex in Algeria                                               printed report is available
    Plans for tenders for railway coach manufacture                                                        on request.
    Mowasalat builds more bus infrastructure for FIFA World Cup
    Al Meera Holding to acquire assets of Oman-based Safeer
    Gulf Warehousing Co opens branches in KSA and Dubai
Qatar Monthly Economic Monitor
                                                                                                                            th
                                                                                                                           6 December 2012


National Accounts
Nominal GDP (QR bn)                                 2008       2009      2010     2011    Q2-12     QoQ%      YoY%     Oil prices now look set to
Total                                               419.6      356.0     463.5    630.9    173.4    -1.1%     11.9%    average US$ 111/barrel in 2012,
Oil & Gas                                           230.3      159.5     239.7    364.5     96.8    -6.4%      8.2%    versus our forecast (made
Non-oil                                             189.3      196.5     223.7    266.4     76.6     6.4%     16.9%    in 2011) for US$ 110. We have
Agriculture and Fishing                               0.5        0.4       0.5      0.6      0.1    -0.7%      1.4%
                                                                                                                       marginally revised up our
Industry                                             74.1       60.9      75.4     89.1     27.4     6.8%     15.0%
                                                                                                                       2012 nominal GDP forecast
Manufacturing                                        44.9       33.6      49.2     62.7     19.4     5.4%     14.6%
                                                                                                                       to QR711 bn (12.7% growth
Electricity, Gas and Water                            2.1        1.8       2.1      2.6      0.7    23.1%     10.3%
                                                                                                                       with 8.8% in oil and gas
Construction                                         27.2       25.5      24.1     23.8      7.1     9.6%     17.0%
                                                                                                                       sectors and 18.0% in non-oil)
Services                                            111.1      132.1     143.8    173.2     48.1    47.6%     18.2%
Trade, Restaurants and Hotels                        23.4       29.8      32.3     35.7     10.0     9.4%     10.6%
Transport and Communications                         14.8       16.2      18.3     21.9      6.3    14.2%     16.0%    Government services is up
Financial and Business Services                      51.6       58.1      62.1     73.7     17.9     6.5%      6.2%    39% YoY due to the rise in
Social Services                                       3.5        4.1       4.3      4.9      1.4     4.9%     11.0%    salaries for Qatari nationals,
Government Services                                  26.3       32.1      35.8     46.7     14.8     0.4%     39.0%    by contrast in real terms
Household Services                                    1.7        1.8       1.9      2.0      0.6     8.2%     16.2%    the sector grew only 1.6%
Imputed Bank Service Charges                        -10.1      -10.2     -11.0    -11.7     -2.8     4.1%      -5.0%
Import Duties                                         3.5        3.1       4.0      3.5      1.0    11.6%     13.0%
Source: QSA


Real GDP (% change, YoY)                            2008       2009      2010     2011    2012F     Q2-12     QoQ%     Following the completion of
Total                                                17.7       12.0      16.7     13.0      5.6      5.0        2.5   most planned expansions in
Oil & Gas                                            13.2        4.5      28.8     15.7      2.7      0.8       -0.1   the gas sector, non-oil is now
Non-oil                                              21.3       17.6       8.6     10.8      8.0      8.5        4.5   driving growth
Agriculture and Fishing                              36.7      -17.0      19.0      4.5      3.3      1.8       -1.9
Industry                                             45.8        9.3       9.6      7.0      8.7      9.1        4.5
                                                                                                                       We have slightly revised up
Manufacturing                                        18.9       13.7      22.4      7.9      8.2      8.0        6.0
                                                                                                                       our forecast for 2012 real
Electricity, Gas and Water                           12.3       -0.4       1.9     23.9     13.6     10.3       23.1
                                                                                                                       GDP growth from 5.4% last
Construction                                         79.2        6.9       0.4      4.9      8.8     10.0        1.7
                                                                                                                       month to 5.6%. This is owing
Services                                             13.2       21.9       7.0     13.2      7.6      8.1        4.4
Trade, Restaurants and Hotels                         6.4       15.7       9.0      9.0      4.5      4.1        3.8   to: oil prices being higher

Transport and Communications                         51.0       22.7      10.2     18.0     15.5     18.0       11.7   than expected; strong
Financial and Business Services                       8.9       25.8       7.2      8.0      9.8     12.1       10.2   indications of non-oil activity,
Social Services                                       4.5       21.5       1.2     12.3      3.1      2.4        0.9   such as higher population
Government Services                                   8.9       23.6       4.1     20.1      3.0      1.6       -3.8   growth and rising rent
Household Services                                    3.8        4.3       2.2      3.4     12.3     11.1        5.8   prices; higher imports; and
Imputed Bank Service Charges                         35.6        1.0       3.3      4.3      8.4      8.6       10.7   an uptick in oil production
Import Duties                                       -21.4      -11.3      33.6    -16.5      7.8      8.3       10.1
Source: QSA and QNB Group Forecasts for 2012


                                  Non-oil          Oil & Gas           Real change (%QoQ, RHS)

            180                                                                                                 10%


            120                                                                                                 4%
    QR bn


             60                                                                                                 -2%


             0                                                                                                  -8%
                  Q2 10       Q3 10        Q4 10    Q1 11      Q2 11     Q3 11    Q4 11     Q1 12    Q2 12
Qatar Monthly Economic Monitor
                                                                                                                                                                th
                                                                                                                                                               6 December 2012


Balance of Payments and Trade
Balance of Payments (US$ bn)                                     2008           2009           2010           2011          Q2-12    QoQ%          YoY%                       The fall in exports in the last
Current Account Balance                                           26.6             6.4          23.8           52.0            9.6       -2.4%    -36.2%                      year is mainly a result of
Trade Balance                                                     42.2           25.6           53.9           87.4           18.5       -6.8%    -19.1%                      lower production of crude
    Exports                                                       67.3           48.0           74.8         114.3            27.3       -1.4%     -5.7%                      oil, which was compounded in
    Imports                                                      -25.1          -22.5          -20.9          -26.9           -8.8    12.5%        45.1%
                                                                                                                                                                              Q2 2012 versus Q1 as crude
Invisibles                                                       -15.6          -19.2          -30.1          -35.4           -8.9   -11.2%        14.1%
                                                                                                                                                                              oil prices were lower,
    Services                                                       -3.8           -3.9          -5.8           -9.5           -3.6    28.6%        55.9%
                                                                                                                                                                              however, these trends have
    Income                                                         -6.8           -9.4         -12.9          -13.3           -2.2   -36.5%        -8.6%
                                                                                                                                                                              now reversed
    Transfers                                                      -5.0           -5.8         -11.4          -12.7           -3.0   -17.2%            0.5%
Capital & Financial Account Balance                              -24.0             0.6         -10.7          -62.6           -5.2        36%          -75%
Capital Account                                                    -1.4           -1.8          -2.1           -3.6           -1.1       -10%          22%                    Strong growth in imports in

Financial Account                                                -22.6             2.4          -8.6          -59.0           -4.1        56%          -79%                   Q2 has been driven by
    Direct Investment (outwards)                                   -3.7           -3.2          -1.9           -6.0           -2.1   -208%             -19%                   Machinery and Transport
    Direct Investment (into Qatar)                                  3.8            8.1           4.7           -0.1           -0.2       244%     -9429%                      Equipment, an indication that
    Portfolio investment (net)                                         -              -              -        -18.9           -2.9   -171%         433%                       project activity may be
                         40                                                                                                                        37                         picking up
     Reserves (US$ bn)


                                                                                                   31
       International


                         30
                                                                                                                                                                              International reserves have
                         20                                                                                                                                                   rebounded from a low of
                                                                                                                                                                              US$14bn in Nov-11 to
                         10                                                                                                    14
                                                                                                                                                                              US$37bn in Sep-12
                         0
                         Jan-08   Sep-08            May-09              Jan-10             Sep-10             May-11             Jan-12          Sep-12

Source: QCB, plus UNCTAD for Direct Investment prior to 2011; Note: this is a simplified table and does not show all Balance of Payment lines

Top 5 Export Destinations (US$ bn)                               2008           2009           2010           2011          Q2-12    QoQ%          YoY%                       Exports to Japan have
Japan                                                             18.8           14.5           19.7           27.4            7.9   -10.5%        24.3%                      surged 24.3% YoY as
Pending                                                           12.0             7.6          10.8           18.9            5.9       1.7%      30.0%                      additional LNG cargoes were
European Economic Community (EEC)                                   3.1            4.0           9.1           16.9            3.2       -7.6%    -34.4%                      dispatched to assist with its
India                                                               2.9            3.7           5.6           10.3            4.1    22.8%        54.1%
                                                                                                                                                                              energy crisis following the
Singapore                                                           6.4            4.2           5.0            6.8            2.3    32.3%        33.6%
                                                                                                                                                                              closure of its nuclear plants

Top 5 Import Sources (US$ bn)                                    2008           2009           2010           2011          Q2-12    QoQ%          YoY%
European Economic Community (EEC)                                   9.3            8.1           7.1            6.6            1.5   -26.8%        12.5%
United States                                                       2.5            3.1           3.5            3.1            0.5   -45.8%       -21.3%
United Arab Emirates                                                1.8            1.8           2.3            3.0            0.8       0.0%          3.0%
Saudi Arabia                                                        1.4            1.3           1.7            2.2            0.6       0.0%          3.0%
Japan                                                               2.7            1.8           1.3            1.1            0.4   -22.4%        40.3%
Source: IMF Direction of Trade Statisics; Note: the IMF's exports and imports by country differ slightly from QSA figures

Crude oil (US$ / barrel)                                         2008           2009           2010           2011          Oct-12   MoM%          YoY%                       Crude production has been
Oil production ('000 bpd)                                        842.8         781.0          733.0          734.0          735.0*       1.7%      -2.1%                      lower, on average, so far
Qatar average price                                               94.8           62.0           77.7         108.4           110.6       3.0%          4.1%                   this year as maintenance
    Dukhan                                                        96.9           62.6           78.4         109.7           112.0       -1.9%         3.7%                   work is required at some
    Marine                                                        93.5           61.6           77.2         107.5           110.0       -2.1%         3.4%
                                                                                                                                                                              mature fields, however, it
        140                                                                                                                                      760
                                                                                                                                                                              has ticked up in recent
                                                                                                                                                       '000 barrels per day


                                                                                      Average price                         Production
                     130                                                                                                                         750                          months
      US$ / barrel


                     120                                                                                                                         740

                     110                                                                                                                         730

                     100                                                                                                                         720

                     90                                                                                                                          710
                      Oct-11               Jan-12                          Apr-12                        Jul-12                      Oct-12


Source: OPEC (Direct communications), Reuters; Note: Monthly figures for 2011 have estimated based on downward revisions in OPEC annual figures; September 2012 figure
Qatar Monthly Economic Monitor
                                                                                                                                                                                          th
                                                                                                                                                                                         6 December 2012


Budget and Population
Government Budget (QR bn)                                                 2008/09     2009/10            2010/11                 2011/12        Q2-12       QoQ%                 YoY%         Revenue is seasonal and
Balance                                                                      40.6               53.7             12.8               44.5         -18.5                                        highly volatile. Q2
     % of GDP                                                               9.7%        15.1%                    2.8%              7.1%        -10.7%                                         revenue is usually lower
Revenue                                                                     140.6         168.8                 155.5              203.4          11.0      -79.6%             -65.9%         and it is likely to bounce
Expenditure                                                                 100.0         115.1                 142.7              158.9          29.5      -34.0%             -14.4%
                                                                                                                                                                                              back in H2

Population (m)                                                              2008            2009                 2010              2011        Nov-12       MoM%                 YoY%
                                                                                                                                                                                              Population growth has
Total                                                                        1.45               1.64             1.72               1.73          1.85         5.0%                   7.1%
                                                                                                                                                                                              accelerated, pointing to a
     Male                                                                    1.11               1.27             1.30               1.30          1.36         4.0%                   6.7%
                                                                                                                                                                                              pickup in activity. The
     Female                                                                  0.34               0.37             0.42               0.43          0.48         7.9%                   8.3%
                                                                                                                                                                                              average YoY population
Source: QSA; Monthly data is based on those physically in Qatar, based on entries and exits over the borders, while the annual series relates to residency
                                                                                                                                                                                              growth over the last 12
                           1.9                                                                                                                                                                months was 5.9%
       Population (m)


                                                                                                                                                                                              compared with 1.2% in


                           1.8
                           1.7                                                                                                                                                                2011. The growth in
                           1.6                                                                                                                                                                female expatriates is
                           1.5                                                                                                                                                                particularly strong


Money and Prices
Inflation (% ch, 12mth average YoY)                                         2008           2009                 2010              2011         Oct-12       MoM%              YoY%           Rents have increased for
Overall (weights shown below)                                                15.2               -4.9             -2.4               1.9           1.8             0.4                  2.7   four consecutive months
Food, beverages & tobacco (13.2%)                                            19.9               1.3               2.1               4.3           4.0           -0.8                   4.1   and are positive YoY for
Clothing & footwear (5.8%)                                                   11.8               -4.5             -1.3               7.5           3.5             0.9                  3.0   the first time since 2008,
Rents, water & maintenance (32.2%)                                           19.7         -12.0                 -12.8              -4.8          -4.5             0.7                  0.6
                                                                                                                                                                                             confirming the reversal of
Furniture, textiles & appliances (8.2%)                                         7.7             -2.0              4.1               2.9           5.5           -0.8                   3.1
                                                                                                                                                                                             the downward trend in
Health care (2.0%)                                                              4.2             1.7               3.5               2.6           1.8             0.7                  1.0
                                                                                                                                                                                             rent inflation
Transport & communication (20.5%)                                               9.3             -4.4              2.6               6.4           2.9           -0.8                   1.4
Entertainment, leisure & culture (10.9%)                                        9.9             -1.2              2.9               2.0           6.0             4.5                  5.8
                                                                                                                                                                                             The increases are
Miscellaneous goods & services (7.2%)                                        12.4               7.3               4.7               5.6           5.2             0.4                  4.3
                                                                                                                                                                                             probably related to an
Source: QSA
                                3%                                                                                                                                                           increase in immigration
                                                                                                                                                                                             and point to a pickup in
             Inflation (%YoY)


                                                                                                                                                                                             overall economic activity


                                0%
                                      Jan-10


                                                        Jul-10


                                                                 Oct-10


                                                                            Jan-11


                                                                                                       Jul-11


                                                                                                                        Oct-11


                                                                                                                                      Jan-12


                                                                                                                                                             Jul-12


                                                                                                                                                                             Oct-12
                                               Apr-10


                                                                                       Apr-11


                                                                                                                                                  Apr-12


                                -3%


                                -6%

Money Supply (QR bn)                                                        2008           2009                 2010              2011         Sep-12       MoM%              YoY%
Broad money (M2)                                                           184.0         215.1                  264.7             310.0         374.7        1.5%             18.5%
     M1                                                                      50.9           53.1                 68.3              81.8          90.1        4.4%             24.7%
     Quasi-money                                                           133.1         162.0                  196.4             228.1         284.6        0.6%             16.7%


Interest rates (%, end period)                                              2008           2009                 2010              2011         Sep-12      MoM bp           YoY bp           Lending rates fell sharply
QCB deposit                                                                     2.0             2.0               1.5               0.8           0.8                  0                0    following QCB action in
QCB lending                                                                     5.5             5.5               5.5               4.5           4.5                  0                0
                                                                                                                                                                                             2011, but are now picking
Interbank overnight                                                             2.0             2.0               1.4               0.7           0.8                  2               29
                                                                                                                                                                                             up marginally
Demand deposit                                                                  1.8             2.0               1.3               0.6           0.6                 14                2
Overdraft                                                                       8.8             8.8               8.2               7.4           6.9             -61                  -95
Credit card                                                                  20.7           20.0                 19.9              10.7          11.3                 90              -195

    Source: QCB
Qatar Monthly Economic Monitor
                                                                                                                             th
                                                                                                                            6 December 2012


 Feature analysis: QNB Group extends key forecasts to 2014

We have updated our key macroeconomic forecasts and                   Real GDP (% change)
extended our coverage to 2014. Energy prices and production
are at the core of our forecast methodology, as government                                            Overall               Oil & Gas          Non-Oil
revenue from oil and gas determines activity in much of the
economy. Our original forecast for 2012 Brent oil prices was                15.7
US$110/barrel, which is very close to the annual average so far
this year. We expect oil prices to weaken to US$108/b in 2013
and US$102/b in 2014. Important developments since our last                         10.8
forecasts include the stabilisation of rent prices, a pickup in
population growth and more rapid growth in imports. All of this                                          8.0
points to a pickup in project activity, as covered in our last                                                               6.4                6.0
monthly report.                                                                                                     3.6
                                                                                                                                        4.3
                                                                                                2.7
As a result of these factors, we have slightly revised up our
forecast for 2012 real GDP growth from 5.4% last month to
5.6%. This level remains well below the 13.0% growth of 2011
as major LNG expansion projects have been completed and as                    2011               2012f               2013f               2014f
oil production was cut back in early 2012, though it has recently
risen from mid-year lows.                                                     13.0                 5.6                 5.2                    5.3

Investment in the redevelopment of oil fields should yield higher   Source: QSA and QNB Group forecasts (f)
production in 2013-14 and the launch of the second phase of
the Pearl GTL project should boost gas production. The first
stage of the Barzan gas project (a new project to supply the          Mid-Year Population
domestic market) should begin to come online in late 2014,
further boosting growth in the oil and gas sector.                                                               Total (m)               % change
Growth has slowed in the non-oil sector from 10.8% in 2011 to a
forecast 8.0% in 2012. There has been a lull in activity in early                                 5.4
2012 as the process of tendering major infrastructure projects
has taken longer than expected. This is one reason why
government expenditure was lower in the first half of 2012 than
                                                                                                                      3.1                 2.8
in the first half of 2011. This has had a particular impact on
government services, which we expect to grow by 3.0% in 2012
versus 20.1% in 2011, and trade restaurants and hotels, which
we expect to grow by 4.5% in 2012 versus 9.0% in 2011.                        1.0

We forecast that non-oil growth will moderate further to 6.4% in
2013 and 6.0% in 2014. This is a slowdown from exceptionally
strong growth in previous years, but it remains relatively high              2011                2012f               2013f              2014f
compared to other emerging and regional economies. Notably,                   1.73                1.83                1.88               1.93
we expect a moderation in manufacturing after some major
capacity expansions in 2011-12.                                     Source: QSA and QNB Group forecasts

We forecast a 5.4% increase in population in 2012, which is
most probably related to an initial ramp up of expatriate workers     CPI Inflation (% change)
being brought in to assist with the implementation of projects.
We expect population growth to moderate to 3.1% in 2013 and                                                                         Overall CPI
2.8% in 2014. This will lead to a broader deceleration in growth,
particularly in transport, storage and communications, a sector                                                                     Non-rent CPI
that is closely linked to manufacturing and population growth.        4.7
CPI inflation is set to average 2.0% in 2012. This is slightly
higher than forecasted earlier in the year as rental prices have                                4.0                       3.3
turned a corner quicker than expected (rent accounts for 32% of                                                                                     3.0
the CPI basket). Non-rent inflation is expected to be 4.0% in
                                                                                                                          3.2
2012. Prices of the following categories have all risen by over
4.0%: food, beverages and tobacco; furniture, textiles and home                                 2.0
                                                                                                                                                    2.7
                                                                      1.9
appliances; entertainment and culture; and miscellaneous
goods (mainly education). While we expect non-rent inflation to
moderate in 2013-14, a bounce back in rents (forecast to rise
3.7% in 2013 and 4.1% in 2014) will drive up overall inflation.
                                                                     2011                     2012f                    2013f                        2014f
                                                                    Source: QSA and QNB Group analysis


                                                                                                                                          Page 5 of 10
Qatar Monthly Economic Monitor
                                                                                                                 th
                                                                                                                6 December 2012


 Economic News
 Fastest growing economy in GCC – According to a Fitch                equivalent to 10.7% of GDP. Qatar's budget usually faces a
  Ratings report, Qatar’s economy will remain the fastest              deficit in the first quarter, which begins in April, and then
  growing among all GCC economies in 2013, driven by the               bounces back to a surplus during the rest of the year mainly
  government’s huge capital investment program. (Gulf-                 owing to the timing of revenue flows. (Reuters)
  Times.com)
                                                                      Upsurge in project tenders due to World Cup
 S&P maintains AA rating for Qatar – Global ratings agency            preparations – According to MEED Events, Qatar is set to
  Standard & Poor’s (S&P) has maintained its AA/Stable/A-1+            see an upsurge in project tenders in the next two years, as the
  sovereign credit ratings for Qatar. The ratings reflect S&P’s        country enters the crucial phase of its preparations for the
  view of its high levels of economic wealth and strong fiscal         2022 FIFA World Cup. New tenders, bidding and awards are
  and external balance sheets with modest levels of debt and           expected to reach $30bn a year from 2013-2014. (MEED)
  large external liquidity. S&P expects Qatar to maintain a
                                                                      Qatar to invest $140bn on infrastructure projects over
  comfortable budget surplus of about 6% of GDP on average
                                                                       next five years – According to Qatar’s Economy and Finance
  between 2012 and 2015. S&P expects the trade surplus to
                                                                       Minister, HE Yousef Hussein Kamal, Qatar will investment
  remain strong in 2012 because of oil prices. (S&P)
                                                                       US$140bn in 2013-17 on large infrastructure projects
 KPMG: Qatar’s prospects “really bright” in view of its gas           including the first phase of railway development, as well as
  abundance – KPMG International Chairman Michael Andrew               education and social development sectors’ plans, in an effort
  said Qatar’s prospects are really bright in view of the nation’s     to put its long-term investment strategy into action. (Gulf-
  abundant natural gas, which is the “energy source of future”.        Times.com)
  He said Qatar is one of the “most efficient” producers of gas in
                                                                      Inward FDI stock estimated at $31bn in Qatar – Inward
  the world. However, Andrew stressed Qatar needed to change
                                                                       foreign direct investment (FDI) into Qatar has been resilient on
  its ownership rules if it is to succeed in tapping foreign
                                                                       the back of oil & gas investments. QNB estimated the current
  investment, which is key to diversifying the national economy.
                                                                       stock of inward FDI to be around $31bn, accounting for 17.8%
  He also hailed Qatar’s efforts towards realizing a knowledge-
                                                                       of the country’s GDP. Around half of inward FDI was towards
  based economy over the next few years. (Gulf-Times.com)
                                                                       the oil & gas sector and the remainder in the finance and real
 GCC insulated from future global shocks – According to a             estate sectors. (QNB)
  QNB report, the GCC region is “insulated” from potential
                                                                      $13.1bn investment in power over next eight years –
  shocks, despite the gloomy outlook for world economy. The            mainly in the transmission and distribution segments. Driven
  IMF estimates that 1% lower real GDP in either the US or euro        by high GDP growth rates and population explosion, power
  Area would lead to 0.4% lower GDP in the GCC a year later,           consumption in Qatar has increased at a compound rate of
  while a 1% fall in China’s growth would lead to a 0.1% fall in       9.3% during the 2001-2011 period. (Peninsula Qatar)
  the GCC. In Qatar and Kuwait, the breakeven oil price rose by
  just over $15 a barrel from 2008-12 to around $40 and $50           Emir approves setting up of public utilities panel – HH the
  respectively. In Oman, Saudi Arabia and the UAE the                  Emir Sheikh Hamad bin Khalifa Al Thani ratified the cabinet’s
  breakeven price is around $80. Although this remains below           decision for setting up a coordinating committee to manage
  oil prices of over $100 per barrel, the QNB report says that a       services and public utilities. The panel is being set up to help
  sustained drop in oil prices could prompt some GCC countries         the Public Works Authority (Ashghal) to remove hurdles in
  to implement fiscal consolidation, which may lead to softer          executing pubic projects by coordinating with various state and
  growth in the non-oil economy. QNB expects that oil prices will      non-government agencies, including private sector companies.
  fall slightly to $108 in 2013. (QNB)                                 (Peninsula Qatar)
 Budget slips into QR18.5bn deficit in Q2 2012 – According           The QCB issued QR4bn in treasury bills – In early
  QCB data, Qatar's government budget slipped into a deficit of        November, the Qatar Central Bank (QCB) issued treasury bills
  QR18.5bn in the first quarter of its fiscal year 2012-13,            worth QR4bn with maturities of 91, 182 and 273 days. (QCB)

 Public Companies News
 Qatar Holding creates asset management JV with Credit                considering partnerships with one or more shale gas players to
  Suisse – Credit Suisse and Qatar Holding are establishing an         participate in such a project. (Bloomberg)
  asset management JV, Aventicum Capital Management. The
                                                                      Qatar to supply gas for Croatian LNG terminal – According
  JV will operate out of two divisions including a Doha-based
                                                                       to Croatian Economy Minister Radimir Cacic, Qatar will supply
  business focused on investment strategies in the Middle East,
                                                                       gas for the proposed Croatian LNG terminal on the island of
  Turkey and other frontier markets, as well as an international
                                                                       Krk for the next 25 years. He said Qatar may also invest in
  business, based outside of the region. The Doha-based
                                                                       further developing the terminal. (Bloomberg)
  division will be launched in early 2013, followed by the launch
  of the international business later in the year. The Doha-based     QP and Total agree to continue operations on Al Khalij oil
  division will be licensed and regulated by the Qatar Financial       field for another 25 years – QP and Total have signed an
  Center. (Gulf-Times.com)                                             agreement extending their operations at the Al Khalij field for
                                                                       another 25 years. Under the new agreement, QP holds 60%
 Qatar Holding cashes in on remaining Barclays warrants –
                                                                       operating interest, while Total holds the remainder.
  Its remaining holding of 379m units of Barclays warrants –
                                                                       (Bloomberg)
  instruments that convert into shares – have been monetized as
  part of its active portfolio management, without affecting its      QP and Shell’s Al-Karaana project to be awarded in 2013 –
  6.65% stake in the bank. In a separate statement, Deutsche           The front-end engineering design (FEED) contract for the Al-
  Bank AG and Goldman Sachs Group Inc said they would sell             Karaana Petrochemicals Project at Ras Laffan is expected to
  up to 303.3m Barclays ordinary shares in relation to the             be awarded in early 2013. The project, being set up jointly by
  monetization of the warrants by Qatar. (Reuters)                     Qatar Petroleum (QP) and Shell, would produce cost-
                                                                       competitive products to be sold worldwide. (Gulf-Times.com)
 QP eyes shale gas opportunities in US – Qatar Petroleum
  (QP) is exploring opportunities in upstream US shale gas
  projects that would enable it to export LNG. The company is

                                                                                                                           Page 6 of 10
Qatar Monthly Economic Monitor
                                                                                                                  th
                                                                                                                 6 December 2012


 Private Sector News
 Qatar may rival UAE financial crown – The UAE's financial            and QAPCO at Ras Laffan has reached the engineering
  community has warned that competition from Qatar may                 phase. The project is expected to be completed by 2018.
  create a powerful rival to the Dubai International Financial         (Gulf-Times.com).
  Center if its market law is not developed further. New market
                                                                      Qatar National Cement inks a consulting contract for
  regulations for onshore fund management issued by the UAE
                                                                       clinker plant – QNCC signed a consulting contract to build a
  Securities and Commodities Authority have substantially
                                                                       clinker plant with a capacity of 5,000-7,500 tons/day. The
  increased the regulatory burden on fund managers. The new
                                                                       tender for building the plant will be out in January 2013. The
  regime is unpopular among firms based in Dubai, which could
                                                                       new plant is expected to start production in 2015 and will
  persuade them to establish themselves elsewhere. In the
                                                                       increase QNCC’s annual output capacity to around 6m tons.
  meantime, the nearby Qatar Financial Centre appears
                                                                       (QE)
  increasingly competitive. (Gulfbase.com)
                                                                      Qatar, Algeria in steel factory deal – Qatar and Algeria have
 Two Qatari companies in FT Top 500 list – Two Qatari
                                                                       signed a MoU for establishing a steel factory in Algeria with a
  companies, QNB Group and Industries Qatar, remain in the
                                                                       production capacity of 5mn tons a year. The factory, during its
  Financial Times’ (FT) list of the top 500 global companies
                                                                       first phase, will produce 2mn tons, at an estimated investment
  based on market capitalization as at the end of September
                                                                       cost of $2bn. (Gulf-Times.com)
  2012. Market capitalization for QNB and Industries Qatar rose
  5% and 15%, respectively, in the year up to September 2012.         Algeria and Qatar to build fertilizer complex in Souk
  QNB’s rise comes on the back of strong financial results.            Ahras – Algeria and Qatar are planning to construct a
  (Gulf-Times.com)                                                     phosphate fertilizer complex in Algeria through a partnership.
                                                                       The proposed project is expected to produce phosphate and
 QNB Group raises $1bn to fuel expansion drive – A QNB
                                                                       nitrogen fertilizers. (Bloomberg)
  bond sale raised $1bn. The bonds, priced to yield 145 basis
  points above the mid-swap rate, offer a coupon of 2.125% and        Plans for tenders for railway coach manufacture – Qatar
  mature in February 2018. QNB’s order books reached $3bn              has plans to float tenders for the manufacture and supply of rail
  ahead of the bond launch. HSBC Holdings, Deutsche Bank,              coaches, and installation of control systems for its multi-billion
  Mitsubishi UFJ Securities, Standard Chartered and QNB                dollar Greater Doha Metro project by the second quarter of
  Capital arranged the transaction under the bank’s euro               2013. Qatar Rail said a workshop will be held next month for
  Medium-Term Note program. (Bloomberg)                                prospective      bidders—companies       and    contractors—to
                                                                       familiarize them with the tendering process, and safety aspects
 QNB offers competitive land financing rate – a new                   of the control systems. (Peninsula Qatar)
  campaign aims to provide the lowest interest rate of 4.5% to
  Qatari customers who seek land financing from the bank.             Mowasalat builds more bus infrastructure for FIFA World
  Further, QNB offers zero payments and interest for the first six     Cup – Mowasalat is implementing major plans to provide
  months to those customers who hold or will hold salary               better public transport facilities in the country due to the
  accounts with QNB. Additionally, self-employed customers are         increased usage of public transport over the coming decade in
  also eligible for the offer. (Gulf-Times.com)                        the wake of Qatar’s preparations for the 2022 FIFA World
                                                                       Cup. Plans include a hub in Doha city and new stations in
 Ahli Bank: Top shareholder to sell most of its stake – Ahli          West Doha, Al Khor and Al Wakrah and a servicing and
  Bank announced its strategic partner, Bahrain's Ahli United
                                                                       maintenance facility in Ain Khalid. (Gulf-Times.com)
  Bank, would sell nearly all its stake in the Qatari bank. QCB is
  reviewing the proposed sale. (Reuters)                              Al Meera Holding to acquire assets of Oman-based Safeer
                                                                       – Al Meera Holding and Al Meera Development Company has
 EFSA: EFG-Hermes needs more approvals for QInvest                    signed a Sale & Purchase Agreement (SPA) to buy assets of
  Venture – According to the Egyptian Financial Supervisory
                                                                       Safeer stores based in the Sultanate of Oman. The two
  Authority (EFSA), EFG-Hermes Holding SAE, which seeks to
                                                                       companies will have a total stake of 70% in a new subsidiary
  create an investment bank with QInvest, needs to get further
                                                                       established to run the acquired business. (Peninsula Qatar)
  approvals from the Egyptian Exchange and EFSA for the deal.
  (Bloomberg)                                                         Gulf Warehousing Co opens branches in Saudi Arabia
                                                                       and Dubai – Gulf Warehousing Company has opened
 QInvest arranges $106.7m Islamic syndicated project                  branches in Jeddah and Riyadh in Saudi Arabia and in Dubai.
  finance facility for Mazaya Qatar – QInvest has arranged a
                                                                       Further, the company plans to open another branch soon in
  dual-currency 8-year syndicated facility worth $106.7mn for
                                                                       Bahrain after the formalities are processed by the end of
  Mazaya Qatar Real Estate Development to finance the
                                                                       2012. (QE)
  development of the Sidra Village Residential Project. QInvest
  acted as a financial advisor and the sole bookrunner for the
  facility. (Gulfbase.com)
 Qatar Telecom signs $500mn debut Islamic finance deal –
  Qatar Telecom has signed its debut Islamic financing facility
  worth $500mn. The deal, which runs for 18 months and is
  structured as a revolving murabaha facility, was provided by
  Qatar Islamic Bank in its capacity as the sole mandated lead
  arranger. Qatar Telecom had sent out requests for proposals
  to banks for a syndicated loan of up to $1bn. (Reuters)
 Emir inaugurated QAPCO’s QR2.2bn LDPE plant – HH the
  Emir Sheikh Hamad bin Khalifa al Thani inaugurated Qatar
  Petrochemical Company’s (QAPCO) QR2.2bn new low-
  density polyethylene plant (LDPE) at the Mesaieed Industrial
  City on November 20. (Qatar Tribune)
 QP-QAPCO $7bn JV project on track for 2018 completion
  – The petrochemical project being developed jointly by QP

                                                                                                                            Page 7 of 10
Qatar Monthly Economic Monitor
                                                                                                                                                                                                     th
                                                                                                                                                                                                    6 December 2012


Banking Sector Snapshot – end-November 2012
Review and Outlook                                                                   Banking Sector Index vs. QE All Share Index

Liquidity for the Qatari banking system improved with                         110
deposits for the month of October up by 1.8% MoM versus a
marginal increase of 0.4% MoM in the loan book. The sector                  105
loan-to-deposit ratio (LDR) declined to 110% in October versus
                                                                            100
112% at the end of September 2012. Furthermore, the domiciled
loan-to-deposit ratio for the sector followed suit and stood at
                                                                                        95
104% vs. 105% in September. Liquidity has significantly
improved throughout the year (current LDR of 110% vs. the 2012
                                                                                        90
high of 124% in April). We forecast loan growth in excess of 20%
for 2012 and expect NIMs to contract by approximately 10bps.
                                                                                        85


                                                                                                                                                                                                                                                                                       5-Oct-2012

                                                                                                                                                                                                                                                                                                    5-Nov-2012
                                                                                                                 31-Jan-2012
                                                                                                 31-Dec-2011


                                                                                                                                        2-Mar-2012


                                                                                                                                                                                                                         4-Jul-2012
                                                                                                                                                                                3-May-2012
The public sector led deposit growth in the month of


                                                                                                                                                                                                   3-Jun-2012
                                                                                                                                                              2-Apr-2012


                                                                                                                                                                                                                                               4-Aug-2012

                                                                                                                                                                                                                                                                      4-Sep-2012
October. Scrutinizing the segment details, public sector deposits
expanded 4.6% and 32.4%, MoM and YTD, respectively. As is
generally the case, government institutions contributed to the
bulk of the growth. This segment grew by 9.3% MoM (83.4%                                                         QE All Share Index                                                          QE Banks & Financial Services Index
YTD). The government and semi-government institutions                     Source: Bloomberg
segments were negative contributors to growth, declining by
2.5% and 2.9% MoM, respectively. On the other hand, private                          Banking Sector - Loan to Deposit (LTD)
sector deposits ended October flat. The companies/institutions
segment shed 1.4% MoM. This decline was mitigated by a 1.4%                                    130%                                                                                                                                                                                    500,000
growth in deposits from consumers. Consequently, total system
deposits inched up by 1.8% MoM (20.6% YTD). It should be                                       120%                                                                                                                                                                                    400,000
                                                                       Loan to Deposit Ratio


noted that most of the growth in deposits was realized in May
and July.                                                                                      110%                                                                                                                                                                                    300,000


                                                                                                                                                                                                                                                                                                                 QR mn
The overall loan book witnessed flat growth of 0.4% MoM
                                                                                               100%                                                                                                                                                                                    200,000
(20.1% YTD). Total domestic public sector loans were down by
2.2% MoM (+35.0% YTD). The driver behind this drop was
                                                                                               90%                                                                                                                                                                                     100,000
mainly the government segment, which contracted by 11.1%
MoM (-7.9% YTD). The drop from this segment was mitigated by
                                                                                               80%                                                                                                                                                                                     -
the government and semi-government institutions, which
                                                                                                                               Oct-11
                                                                                                                                        Nov-11
                                                                                                                                                     Dec-11


                                                                                                                                                                                                                                                                            Oct-12
                                                                                                                                                                           Feb-12
                                                                                                                                                                                       Mar-12


                                                                                                                                                                                                                                      Jul-12
                                                                                                                                                                                                                May-12
                                                                                                                                                                 Jan-12


                                                                                                                                                                                                                         Jun-12


                                                                                                                                                                                                                                                 Aug-12
                                                                                                                                                                                                                                                             Sep-12
                                                                                                               Sep-11


                                                                                                                                                                                                Apr-12


witnessed flat growth MoM (+54.8% and +32.7% YTD,
respectively). It should be noted that government institutions
                                                                                                                  Loans                                           Deposits                                           Loan to Deposit Ratio
represent 70% of total public sector loans. Moreover, a
significant portion of the growth in public sector loans took place       Source: Qatar Central Bank (QCB)

in the second quarter, which witnessed a 26% QoQ expansion.
                                                                                     Loan Pie
Private sector loans gained some traction and registered a 2.6%
increase MoM (11.0% YTD).
Consumption loans ended October flat (+5.8% YTD). All of
the other sub-segments under private sector loans gained                                                                                                                                                 52%
across the board, most notably real estate (+1.1% MoM,
+8.2% YTD) services (+12.8% MoM, 18.3% YTD),
contractors (3.1% MoM, 3.3% YTD) and general trade (2.4%
MoM and 26.4% YTD).
Specific loan loss provisions rested at 1.3% of average
trailing 12-months loans (October: 1.3%), indicating minimal                                                                                                                                                                           6%
growth in provisions. We expect 2012 provisions to be in the                                                                                                  42%
range of 1.3% to 1.5%.
NIMs expected to come under pressure. Interbank rates (3M
and 6M), have been trending lower in recent months.
                                                                                                                    International                                                        Public Sector                                                      Private Sector


                                                                      Source: QCB (as of end October 2012)


                                                                                                                                                                                                                                                                                     Page 8 of 10
Qatar Monthly Economic Monitor
                                                                                                               th
                                                                                                              6 December 2012


 Banking Sector Indicators


(In QR mn)                                      2010      2011     1Q-12     2Q-12    Sep-12        Oct-12   Change MoM       Change YTD
Total Assets                                  567,482   694,301   700,546   742,817   789,456      799,856         1.3%            15.2%
Total Credit (Loans)                          314,481   403,563   412,247   460,946   482,719      484,667         0.4%            20.1%
Total Deposits                                306,788   363,612   348,356   378,254   430,938      438,686         1.8%            20.6%
Loan to Deposit Ratio                           103%      111%      118%      122%      112%         110%         -1.4%             -0.5%

Credit Facilities (Geographic)
Total Domestic Credit                         293,920   376,695   384,622   432,472   452,086      454,051         0.4%            20.5%
Total International Credit                     20,561    26,867    27,625    28,475    30,634       30,615        -0.1%            13.9%

Domestic Credit Facilities - Public Sector
Government                                     36,303    40,801    32,235    31,967    42,258       37,578       -11.1%            -7.9%
Government Institutions                        50,452    90,619   105,268   136,992   140,125      140,298         0.1%            54.8%
Semi-Government Institutions                   16,303    17,750    15,100    23,199    23,558       23,557         0.0%            32.7%
Total Domestic Public Sector Credit           103,058   149,170   152,603   192,158   205,941      201,433        -2.2%            35.0%

Domestic Credit Facilities - Private Sector
General Trade                                  24,875    26,855    27,590    29,610    33,149       33,951         2.4%            26.4%
Industry                                        6,648     6,534     5,755     6,883     8,070        8,142         0.9%            24.6%
Contractors                                    18,411    16,220    16,532    15,195    16,249       16,757         3.1%             3.3%
Real Estate                                    51,042    76,220    80,113    81,976    81,624       82,488         1.1%             8.2%
Consumption & Others                           60,345    71,986    76,386    79,210    75,881       76,130         0.3%             5.8%
Services                                       29,541    29,709    25,643    27,439    31,171       35,151        12.8%            18.3%
Total Domestic Private Sector Credit          190,862   227,525   232,019   240,314   246,144      252,618         2.6%            11.0%

Deposit Details (Geographic)
Resident Deposits                             277,107   343,777   327,183   351,575   400,441      407,569         1.8%            18.6%
Non-resident Deposits                          29,681    19,835    21,174    26,679    30,497       31,117         2.0%            56.9%


Deposits - Public Sector
Government                                     18,486    40,825    31,352    26,354    33,842       33,009        -2.5%           -19.1%
Government Institutions                        32,277    57,351    46,679    54,822    96,268      105,205         9.3%            83.4%
Semi Government Institutions                   21,309    27,700    23,039    26,679    29,277       28,428        -2.9%             2.6%
Total Public Sector Deposit                    72,071   125,876   101,070   107,855   159,387      166,642         4.6%            32.4%

Deposits - Private Sector
Personal                                       90,828   103,093   111,843   117,147   117,470      119,106         1.4%            15.5%
Companies & Institutions                      114,207   114,809   114,270   126,574   123,584      121,821        -1.4%             6.1%
Total Private Sector Deposit                  205,036   217,902   226,113   243,721   241,054      240,927        -0.1%            10.6%


                                                                                                                          Page 9 of 10
Qatar Monthly Economic Monitor
                                                                                                                                                              th
                                                                                                                                                             6 December 2012


   Qatar Exchange Market Performance


                                                                                 Price % Change 5-                   % Change          Market Cap.
  Company Name                                                            (November 29)       Day                     Monthly           QR Million          TTM P/E           P/B     Div. Yield
  Qatar National Bank                                                                130.60              (0.99)             (2.46)            91,385             10.8          2.0             2.8
  Qatar Islamic Bank                                                                  75.00              (1.83)             (2.22)            17,722             12.6          1.6             6.0
  Commercial Bank of Qatar                                                            73.50               1.10               2.23             18,187               9.4         1.3             8.2
  Doha Bank                                                                           50.80              (2.31)             (7.13)            10,500               8.1         1.4             8.9
  Al Ahli Bank                                                                        52.00              (3.70)             (2.80)              5,831            12.7          2.0            N/A
  Qatar International Islamic Bank                                                    52.50               0.00               0.19               7,947            11.7          1.6             6.7
  Masraf Al Rayan                                                                     26.30              (0.19)             (0.38)            19,725             13.3          2.1             1.9
  Al Khaliji Bank                                                                     16.90               1.20              (2.31)              6,084            12.0          1.1             5.9
  National Leasing                                                                    45.00              (1.96)             (2.91)              2,227              8.2         1.7             6.8
  Dlala Holding                                                                       35.35               2.32               2.17                 707            19.1          3.0             2.8
  Qatar & Oman Investment                                                             12.49              (0.79)             (2.65)                393            19.5          1.2             4.0
  Islamic Holding Group                                                               37.50               0.00              (1.32)                150            23.0          3.4             2.7
  Banking and Financial Services                                                                                                            180,858
  Zad Holding                                                                         57.80              (0.17)             (5.56)                756              7.2         0.6            N/A
  Qatar German Co. for Medical Devices                                                13.72              (2.49)             (9.74)                158            40.2          0.8            N/A
  Salam International Investment                                                      12.64              (2.84)             (3.29)              1,445            12.8          0.9             7.2
  Medicare Group                                                                      39.70              (1.00)             (1.98)              1,117            24.3          1.5             2.8
  Qatar Cinema & Film Distribution                                                    58.00               4.50              (0.51)                331            17.0          2.4             2.4
  Qatar Fuel                                                                         276.00              (1.18)             (1.08)            14,345             12.6          2.7             2.9
  Qatar Meat and Livestock                                                            60.50              (4.42)           (18.46)               1,089            12.8          4.2             5.0
  Al Meera Consumer Goods                                                            157.30              (0.44)             (2.60)              1,573            15.7          5.8             4.5
  Consumer Goods and Services                                                                                                                 20,815
  Qatar Industrial Manufacturing                                                      51.00              (3.77)             (3.23)              2,020            10.1          1.6             5.9
  Qatar National Cement                                                              100.60              (0.98)             (1.37)              4,940            11.3          2.2             6.0
  Industries Qatar                                                                   152.30               1.20               0.20             83,765             10.0          2.9             4.9
  Qatari Investors Group                                                              22.90              (2.14)             (7.29)              2,847            21.6          1.4             2.2
  Qatar Electricity and Water                                                        130.50              (0.08)             (2.03)            13,050             10.6          4.1             5.0
  Mannai Corp.                                                                        90.50              (4.74)             (5.63)              3,096            10.2          2.4             5.5
  Aamal                                                                               15.15               0.26              (2.88)              8,249            15.8          1.2            N/A
  Gulf International Services                                                         29.25              (0.85)             (2.66)              4,349            10.5          1.7             4.0
  Industrials                                                                                                                               122,315
  Qatar Insurance                                                                     67.00               0.00              (2.90)              5,976            10.9          1.7             5.0
  Doha Insurance                                                                      29.70               4.95              (3.88)                695            11.3          1.5            N/A
  Qatar General Insurance & Reinsurance                                               48.00               2.35              (3.03)              2,406            15.7          0.9             2.4
  Al Khaleej Takaful Insurance                                                        44.70               1.59              (2.30)                636              9.9         1.2             6.7
  Qatar Islamic Insurance                                                             58.00               1.75              (1.36)                870            17.7          3.3             5.2
  Insurance                                                                                                                                   10,583
  United Development                                                                  17.10               0.12              (4.26)              5,767              1.7         0.6            N/A
  Barwa Real Estate                                                                   28.10               0.72              (2.43)            10,934               9.1         0.9             3.6
  Ezdan Real Estate                                                                   18.45              (0.70)             (2.12)            48,939              N/M          1.8             0.8
  Mazaya Qatar Real Estate Development                                                10.55               0.38              (9.29)              1,055            23.7          1.0            N/A
  Real Estate                                                                                                                                 66,695
  Qatar Telecom                                                                      104.20              (0.19)             (1.33)            33,377             11.6          1.3             1.6
  Vodafone Qatar                                                                        8.35             (3.91)             (7.22)              7,059             N/M          1.1            N/A
  Telecoms                                                                                                                                    40,437
  Qatar Navigation (Milaha)                                                           65.00               3.17               0.93               7,444              9.7         0.7             5.4
  Gulf Warehousing                                                                    40.95              (0.85)              2.38               1,623            21.4          2.4             3.7
  Qatar Gas Transport (Nakilat)                                                       15.18              (0.07)             (2.00)              8,501            10.9          7.3             5.6
  Transportation                                                                                                                              17,568
  Qatar Exchange                                                                                                                            459,270
  Source: Bloomberg, * Trailing Twelve Months


 This report is produced by QNB Group’s Economics Team in collaboration with QNB Financial Services. Past issues are available online at
 http://tinyurl.com/QatarMonthly. For questions, or to receive it by email each month, please contact:
         QNB Economics                                Saugata Sarkar                             Ahmed M. Shehada                                 Keith Whitney
         QNB Group                                    Head of Research, QNBFS                    Head of Trading, QNBFS                           Head of Sales, QNBFS
         Tel: (+974) 4453 4642                        Tel: (+974) 4476 6534                      Tel: (+974) 4476 6535                            Tel: (+974) 4476 6533
         economics@qnb.com.qa                         saugata.sarkar@qnbfs.com.qa                ahmed.shehada@qnbfs.com.qa                       keith.whitney@qnbfs.com.qa
DISCLAIMER: This publication has been prepared by Qatar National Bank (“QNB”) and QNB Financial Services SPC (“QNBFS”), a wholly-owned subsidiary. QNB is regulated by the Qatar
Central Bank, QNBFS is regulated by the Qatar Financial Markets Authority and the Qatar Exchange. This publication expresses the views and opinions of QNB Group and QNBFS at a given
time only. It is not an offer, promotion or recommendation to buy or sell securities or other investments, nor is it intended to constitute legal, tax, accounting, or financial advice. We therefore
strongly advise potential investors to seek independent professional advice before making any investment decision. Although the information in this report has been obtained from sources
that are believed to be reliable, we have not independently verified all such information and it may not be accurate or complete. While this publication has been prepared with the utmost
degree of care by our analysts, no warranties are provided as to the accuracy and completeness of the information it may contain, and any liability in that respect is declined. QNB/QNBFS
reserve the right to amend the views and opinions expressed in this publication at any time. They may also express viewpoints or make investment decisions that differ significantly from, or
even contradict, the views and opinions included in this report.
COPYRIGHT: This report is distributed on a complimentary basis to valued business partners of QNB. It may not be reproduced in whole or in part without permission.

More Related Content

What's hot

QNBFS Weekly Market Report December 02, 2021
QNBFS Weekly Market Report December 02, 2021QNBFS Weekly Market Report December 02, 2021
QNBFS Weekly Market Report December 02, 2021QNB Group
 
24 February Daily market report
24 February Daily market report 24 February Daily market report
24 February Daily market report QNB Group
 
QNBFS Daily Market Report November 22, 2018
QNBFS Daily Market Report November 22, 2018QNBFS Daily Market Report November 22, 2018
QNBFS Daily Market Report November 22, 2018QNB Group
 
Weekly Market Report
Weekly Market Report Weekly Market Report
Weekly Market Report QNB Group
 
Weekly Market Report
Weekly Market Report Weekly Market Report
Weekly Market Report QNB Group
 
12 April Daily market report
12 April Daily market report12 April Daily market report
12 April Daily market reportQNB Group
 
30 June Technical Market Report
30 June Technical Market Report30 June Technical Market Report
30 June Technical Market ReportQNB Group
 
Weekly market report
Weekly market reportWeekly market report
Weekly market reportQNB Group
 
Weekly market report
Weekly market report Weekly market report
Weekly market report QNB Group
 
R8 en-fact sheet
R8 en-fact sheetR8 en-fact sheet
R8 en-fact sheetsweetpea811
 
Weekly Market Report
Weekly Market ReportWeekly Market Report
Weekly Market ReportQNB Group
 
7 July Daily market report
7 July Daily market report7 July Daily market report
7 July Daily market reportQNB Group
 
23 September Daily Market Report
23 September Daily Market Report 23 September Daily Market Report
23 September Daily Market Report QNB Group
 
QNBFS Daily Market Report April 07, 2019
QNBFS Daily Market Report April 07, 2019QNBFS Daily Market Report April 07, 2019
QNBFS Daily Market Report April 07, 2019QNB Group
 
QNBFS Weekly Market Report August 10, 2017
QNBFS Weekly Market Report August 10, 2017QNBFS Weekly Market Report August 10, 2017
QNBFS Weekly Market Report August 10, 2017QNB Group
 
14 December Daily market report
14 December Daily market report 14 December Daily market report
14 December Daily market report QNB Group
 
QNBFS Daily Market Report January 31, 2022
QNBFS Daily Market Report January 31, 2022QNBFS Daily Market Report January 31, 2022
QNBFS Daily Market Report January 31, 2022QNB Group
 
Weekly market report
Weekly market reportWeekly market report
Weekly market reportQNB Group
 
Weekly Market Report
Weekly Market ReportWeekly Market Report
Weekly Market ReportQNB Group
 

What's hot (20)

QNBFS Weekly Market Report December 02, 2021
QNBFS Weekly Market Report December 02, 2021QNBFS Weekly Market Report December 02, 2021
QNBFS Weekly Market Report December 02, 2021
 
24 February Daily market report
24 February Daily market report 24 February Daily market report
24 February Daily market report
 
QNBFS Daily Market Report November 22, 2018
QNBFS Daily Market Report November 22, 2018QNBFS Daily Market Report November 22, 2018
QNBFS Daily Market Report November 22, 2018
 
Weekly Market Report
Weekly Market Report Weekly Market Report
Weekly Market Report
 
Merge and Acquisition Report Q1 2019
Merge and Acquisition Report Q1 2019Merge and Acquisition Report Q1 2019
Merge and Acquisition Report Q1 2019
 
Weekly Market Report
Weekly Market Report Weekly Market Report
Weekly Market Report
 
12 April Daily market report
12 April Daily market report12 April Daily market report
12 April Daily market report
 
30 June Technical Market Report
30 June Technical Market Report30 June Technical Market Report
30 June Technical Market Report
 
Weekly market report
Weekly market reportWeekly market report
Weekly market report
 
Weekly market report
Weekly market report Weekly market report
Weekly market report
 
R8 en-fact sheet
R8 en-fact sheetR8 en-fact sheet
R8 en-fact sheet
 
Weekly Market Report
Weekly Market ReportWeekly Market Report
Weekly Market Report
 
7 July Daily market report
7 July Daily market report7 July Daily market report
7 July Daily market report
 
23 September Daily Market Report
23 September Daily Market Report 23 September Daily Market Report
23 September Daily Market Report
 
QNBFS Daily Market Report April 07, 2019
QNBFS Daily Market Report April 07, 2019QNBFS Daily Market Report April 07, 2019
QNBFS Daily Market Report April 07, 2019
 
QNBFS Weekly Market Report August 10, 2017
QNBFS Weekly Market Report August 10, 2017QNBFS Weekly Market Report August 10, 2017
QNBFS Weekly Market Report August 10, 2017
 
14 December Daily market report
14 December Daily market report 14 December Daily market report
14 December Daily market report
 
QNBFS Daily Market Report January 31, 2022
QNBFS Daily Market Report January 31, 2022QNBFS Daily Market Report January 31, 2022
QNBFS Daily Market Report January 31, 2022
 
Weekly market report
Weekly market reportWeekly market report
Weekly market report
 
Weekly Market Report
Weekly Market ReportWeekly Market Report
Weekly Market Report
 

Viewers also liked

中國醫藥大學針灸研究所101學年度入學招生
中國醫藥大學針灸研究所101學年度入學招生中國醫藥大學針灸研究所101學年度入學招生
中國醫藥大學針灸研究所101學年度入學招生Dino Chi
 
Imagenes
ImagenesImagenes
Imagenesbaggrit
 
Benefits
BenefitsBenefits
BenefitsDFC2011
 
32 Ways a Digital Marketing Consultant Can Help Grow Your Business
32 Ways a Digital Marketing Consultant Can Help Grow Your Business32 Ways a Digital Marketing Consultant Can Help Grow Your Business
32 Ways a Digital Marketing Consultant Can Help Grow Your BusinessBarry Feldman
 

Viewers also liked (6)

Charlie and Matthew .4p
Charlie and Matthew .4pCharlie and Matthew .4p
Charlie and Matthew .4p
 
中國醫藥大學針灸研究所101學年度入學招生
中國醫藥大學針灸研究所101學年度入學招生中國醫藥大學針灸研究所101學年度入學招生
中國醫藥大學針灸研究所101學年度入學招生
 
Phan dam
Phan damPhan dam
Phan dam
 
Imagenes
ImagenesImagenes
Imagenes
 
Benefits
BenefitsBenefits
Benefits
 
32 Ways a Digital Marketing Consultant Can Help Grow Your Business
32 Ways a Digital Marketing Consultant Can Help Grow Your Business32 Ways a Digital Marketing Consultant Can Help Grow Your Business
32 Ways a Digital Marketing Consultant Can Help Grow Your Business
 

Similar to Qatar monthly monitor 6th december 2012

QNBFS Daily Market Report April 08, 2019
QNBFS Daily Market Report April 08, 2019QNBFS Daily Market Report April 08, 2019
QNBFS Daily Market Report April 08, 2019QNB Group
 
7 September Daily market report
7 September Daily market report 7 September Daily market report
7 September Daily market report QNB Group
 
2 June Daily Market Report
2 June Daily Market Report2 June Daily Market Report
2 June Daily Market ReportQNB Group
 
Weekly Market Report
Weekly Market ReportWeekly Market Report
Weekly Market ReportQNB Group
 
16 September Daily Market Report
16 September Daily Market Report 16 September Daily Market Report
16 September Daily Market Report QNB Group
 
QNBFS Weekly Market Report June 03, 2021
QNBFS Weekly Market Report June 03, 2021QNBFS Weekly Market Report June 03, 2021
QNBFS Weekly Market Report June 03, 2021QNB Group
 
QNBFS Daily Market Report November 16, 2020
QNBFS Daily Market Report November 16, 2020QNBFS Daily Market Report November 16, 2020
QNBFS Daily Market Report November 16, 2020QNB Group
 
QNBFS Daily Market Report February 18, 2019
QNBFS Daily Market Report February 18, 2019QNBFS Daily Market Report February 18, 2019
QNBFS Daily Market Report February 18, 2019QNB Group
 
QNBFS Daily Market Report May 21, 2018
QNBFS Daily Market Report May 21, 2018QNBFS Daily Market Report May 21, 2018
QNBFS Daily Market Report May 21, 2018QNB Group
 
QNBFS Daily Market Report April 12, 2021
QNBFS Daily Market Report April 12, 2021QNBFS Daily Market Report April 12, 2021
QNBFS Daily Market Report April 12, 2021QNB Group
 
QNBFS Daily Market Report June 22, 2022
QNBFS Daily Market Report June 22, 2022QNBFS Daily Market Report June 22, 2022
QNBFS Daily Market Report June 22, 2022QNB Group
 
QNBFS Daily Market Report June 14, 2021
QNBFS Daily Market Report June 14, 2021QNBFS Daily Market Report June 14, 2021
QNBFS Daily Market Report June 14, 2021QNB Group
 
QNBFS Daily Market Report July 10, 2023
QNBFS Daily Market Report July 10, 2023QNBFS Daily Market Report July 10, 2023
QNBFS Daily Market Report July 10, 2023AntsarAbdullah
 
QNBFS Weekly Market Report June 07, 2018
QNBFS Weekly Market Report June 07, 2018QNBFS Weekly Market Report June 07, 2018
QNBFS Weekly Market Report June 07, 2018QNB Group
 
2 June Daily market report
2 June Daily market report 2 June Daily market report
2 June Daily market report QNB Group
 
QNBFS Daily Market Report July 07, 2022
QNBFS Daily Market Report July 07, 2022QNBFS Daily Market Report July 07, 2022
QNBFS Daily Market Report July 07, 2022QNB Group
 
QNBFS Daily Market Report January 20, 2019
QNBFS Daily Market Report January 20, 2019QNBFS Daily Market Report January 20, 2019
QNBFS Daily Market Report January 20, 2019QNB Group
 
30 September Daily Market Report
30 September Daily Market Report30 September Daily Market Report
30 September Daily Market ReportQNB Group
 
18 May Daily market report
18 May Daily market report 18 May Daily market report
18 May Daily market report QNB Group
 
QNBFS Daily Market Report August 18, 2019
QNBFS Daily Market Report August 18, 2019QNBFS Daily Market Report August 18, 2019
QNBFS Daily Market Report August 18, 2019QNB Group
 

Similar to Qatar monthly monitor 6th december 2012 (20)

QNBFS Daily Market Report April 08, 2019
QNBFS Daily Market Report April 08, 2019QNBFS Daily Market Report April 08, 2019
QNBFS Daily Market Report April 08, 2019
 
7 September Daily market report
7 September Daily market report 7 September Daily market report
7 September Daily market report
 
2 June Daily Market Report
2 June Daily Market Report2 June Daily Market Report
2 June Daily Market Report
 
Weekly Market Report
Weekly Market ReportWeekly Market Report
Weekly Market Report
 
16 September Daily Market Report
16 September Daily Market Report 16 September Daily Market Report
16 September Daily Market Report
 
QNBFS Weekly Market Report June 03, 2021
QNBFS Weekly Market Report June 03, 2021QNBFS Weekly Market Report June 03, 2021
QNBFS Weekly Market Report June 03, 2021
 
QNBFS Daily Market Report November 16, 2020
QNBFS Daily Market Report November 16, 2020QNBFS Daily Market Report November 16, 2020
QNBFS Daily Market Report November 16, 2020
 
QNBFS Daily Market Report February 18, 2019
QNBFS Daily Market Report February 18, 2019QNBFS Daily Market Report February 18, 2019
QNBFS Daily Market Report February 18, 2019
 
QNBFS Daily Market Report May 21, 2018
QNBFS Daily Market Report May 21, 2018QNBFS Daily Market Report May 21, 2018
QNBFS Daily Market Report May 21, 2018
 
QNBFS Daily Market Report April 12, 2021
QNBFS Daily Market Report April 12, 2021QNBFS Daily Market Report April 12, 2021
QNBFS Daily Market Report April 12, 2021
 
QNBFS Daily Market Report June 22, 2022
QNBFS Daily Market Report June 22, 2022QNBFS Daily Market Report June 22, 2022
QNBFS Daily Market Report June 22, 2022
 
QNBFS Daily Market Report June 14, 2021
QNBFS Daily Market Report June 14, 2021QNBFS Daily Market Report June 14, 2021
QNBFS Daily Market Report June 14, 2021
 
QNBFS Daily Market Report July 10, 2023
QNBFS Daily Market Report July 10, 2023QNBFS Daily Market Report July 10, 2023
QNBFS Daily Market Report July 10, 2023
 
QNBFS Weekly Market Report June 07, 2018
QNBFS Weekly Market Report June 07, 2018QNBFS Weekly Market Report June 07, 2018
QNBFS Weekly Market Report June 07, 2018
 
2 June Daily market report
2 June Daily market report 2 June Daily market report
2 June Daily market report
 
QNBFS Daily Market Report July 07, 2022
QNBFS Daily Market Report July 07, 2022QNBFS Daily Market Report July 07, 2022
QNBFS Daily Market Report July 07, 2022
 
QNBFS Daily Market Report January 20, 2019
QNBFS Daily Market Report January 20, 2019QNBFS Daily Market Report January 20, 2019
QNBFS Daily Market Report January 20, 2019
 
30 September Daily Market Report
30 September Daily Market Report30 September Daily Market Report
30 September Daily Market Report
 
18 May Daily market report
18 May Daily market report 18 May Daily market report
18 May Daily market report
 
QNBFS Daily Market Report August 18, 2019
QNBFS Daily Market Report August 18, 2019QNBFS Daily Market Report August 18, 2019
QNBFS Daily Market Report August 18, 2019
 

More from QNB Group

QNBFS Daily Market Report December 24, 2023
QNBFS Daily Market Report December 24, 2023QNBFS Daily Market Report December 24, 2023
QNBFS Daily Market Report December 24, 2023QNB Group
 
QNBFS Daily Market Report November 29, 2023
QNBFS Daily Market Report November 29, 2023QNBFS Daily Market Report November 29, 2023
QNBFS Daily Market Report November 29, 2023QNB Group
 
QNBFS Weekly Market Report November 23, 2023
QNBFS Weekly Market Report November 23, 2023QNBFS Weekly Market Report November 23, 2023
QNBFS Weekly Market Report November 23, 2023QNB Group
 
QNBFS Weekly Market Report November 16, 2023
QNBFS Weekly Market Report November 16, 2023QNBFS Weekly Market Report November 16, 2023
QNBFS Weekly Market Report November 16, 2023QNB Group
 
QNBFS Daily Technical Trader Qatar - November 14, 2023 التحليل الفني اليومي ل...
QNBFS Daily Technical Trader Qatar - November 14, 2023 التحليل الفني اليومي ل...QNBFS Daily Technical Trader Qatar - November 14, 2023 التحليل الفني اليومي ل...
QNBFS Daily Technical Trader Qatar - November 14, 2023 التحليل الفني اليومي ل...QNB Group
 
QNBFS Daily Technical Trader Qatar - November 06, 2023 التحليل الفني اليومي ل...
QNBFS Daily Technical Trader Qatar - November 06, 2023 التحليل الفني اليومي ل...QNBFS Daily Technical Trader Qatar - November 06, 2023 التحليل الفني اليومي ل...
QNBFS Daily Technical Trader Qatar - November 06, 2023 التحليل الفني اليومي ل...QNB Group
 
QNBFS Daily Market Report October 30, 2023
QNBFS Daily Market Report October 30, 2023QNBFS Daily Market Report October 30, 2023
QNBFS Daily Market Report October 30, 2023QNB Group
 
QNBFS Daily Technical Trader Qatar - October 25, 2023 التحليل الفني اليومي لب...
QNBFS Daily Technical Trader Qatar - October 25, 2023 التحليل الفني اليومي لب...QNBFS Daily Technical Trader Qatar - October 25, 2023 التحليل الفني اليومي لب...
QNBFS Daily Technical Trader Qatar - October 25, 2023 التحليل الفني اليومي لب...QNB Group
 
QNBFS Daily Technical Trader Qatar - October 10, 2023 التحليل الفني اليومي لب...
QNBFS Daily Technical Trader Qatar - October 10, 2023 التحليل الفني اليومي لب...QNBFS Daily Technical Trader Qatar - October 10, 2023 التحليل الفني اليومي لب...
QNBFS Daily Technical Trader Qatar - October 10, 2023 التحليل الفني اليومي لب...QNB Group
 
QNBFS Daily Technical Trader Qatar - October 11, 2023 التحليل الفني اليومي لب...
QNBFS Daily Technical Trader Qatar - October 11, 2023 التحليل الفني اليومي لب...QNBFS Daily Technical Trader Qatar - October 11, 2023 التحليل الفني اليومي لب...
QNBFS Daily Technical Trader Qatar - October 11, 2023 التحليل الفني اليومي لب...QNB Group
 
QNBFS Daily Technical Trader Qatar - October 10, 2023 التحليل الفني اليومي لب...
QNBFS Daily Technical Trader Qatar - October 10, 2023 التحليل الفني اليومي لب...QNBFS Daily Technical Trader Qatar - October 10, 2023 التحليل الفني اليومي لب...
QNBFS Daily Technical Trader Qatar - October 10, 2023 التحليل الفني اليومي لب...QNB Group
 
QNBFS Daily Market Report October 04, 2023
QNBFS Daily Market Report October 04, 2023QNBFS Daily Market Report October 04, 2023
QNBFS Daily Market Report October 04, 2023QNB Group
 
QNBFS Daily Technical Trader Qatar - October 04, 2023 التحليل الفني اليومي لب...
QNBFS Daily Technical Trader Qatar - October 04, 2023 التحليل الفني اليومي لب...QNBFS Daily Technical Trader Qatar - October 04, 2023 التحليل الفني اليومي لب...
QNBFS Daily Technical Trader Qatar - October 04, 2023 التحليل الفني اليومي لب...QNB Group
 
QNBFS Daily Technical Trader Qatar - September 28, 2023 التحليل الفني اليومي ...
QNBFS Daily Technical Trader Qatar - September 28, 2023 التحليل الفني اليومي ...QNBFS Daily Technical Trader Qatar - September 28, 2023 التحليل الفني اليومي ...
QNBFS Daily Technical Trader Qatar - September 28, 2023 التحليل الفني اليومي ...QNB Group
 
QNBFS Daily Market Report September 24, 2023
QNBFS Daily Market Report September 24, 2023QNBFS Daily Market Report September 24, 2023
QNBFS Daily Market Report September 24, 2023QNB Group
 
QNBFS Daily Technical Trader Qatar - September 24, 2023 التحليل الفني اليومي ...
QNBFS Daily Technical Trader Qatar - September 24, 2023 التحليل الفني اليومي ...QNBFS Daily Technical Trader Qatar - September 24, 2023 التحليل الفني اليومي ...
QNBFS Daily Technical Trader Qatar - September 24, 2023 التحليل الفني اليومي ...QNB Group
 
QNBFS Daily Technical Trader Qatar - September 19, 2023 التحليل الفني اليومي ...
QNBFS Daily Technical Trader Qatar - September 19, 2023 التحليل الفني اليومي ...QNBFS Daily Technical Trader Qatar - September 19, 2023 التحليل الفني اليومي ...
QNBFS Daily Technical Trader Qatar - September 19, 2023 التحليل الفني اليومي ...QNB Group
 
QNBFS Daily Market Report September 17, 2023
QNBFS Daily Market Report September 17, 2023QNBFS Daily Market Report September 17, 2023
QNBFS Daily Market Report September 17, 2023QNB Group
 
QNBFS Weekly Market Report September 07, 2023
QNBFS Weekly Market Report September 07, 2023QNBFS Weekly Market Report September 07, 2023
QNBFS Weekly Market Report September 07, 2023QNB Group
 
QNBFS Daily Technical Trader Qatar - September 07, 2023 التحليل الفني اليومي ...
QNBFS Daily Technical Trader Qatar - September 07, 2023 التحليل الفني اليومي ...QNBFS Daily Technical Trader Qatar - September 07, 2023 التحليل الفني اليومي ...
QNBFS Daily Technical Trader Qatar - September 07, 2023 التحليل الفني اليومي ...QNB Group
 

More from QNB Group (20)

QNBFS Daily Market Report December 24, 2023
QNBFS Daily Market Report December 24, 2023QNBFS Daily Market Report December 24, 2023
QNBFS Daily Market Report December 24, 2023
 
QNBFS Daily Market Report November 29, 2023
QNBFS Daily Market Report November 29, 2023QNBFS Daily Market Report November 29, 2023
QNBFS Daily Market Report November 29, 2023
 
QNBFS Weekly Market Report November 23, 2023
QNBFS Weekly Market Report November 23, 2023QNBFS Weekly Market Report November 23, 2023
QNBFS Weekly Market Report November 23, 2023
 
QNBFS Weekly Market Report November 16, 2023
QNBFS Weekly Market Report November 16, 2023QNBFS Weekly Market Report November 16, 2023
QNBFS Weekly Market Report November 16, 2023
 
QNBFS Daily Technical Trader Qatar - November 14, 2023 التحليل الفني اليومي ل...
QNBFS Daily Technical Trader Qatar - November 14, 2023 التحليل الفني اليومي ل...QNBFS Daily Technical Trader Qatar - November 14, 2023 التحليل الفني اليومي ل...
QNBFS Daily Technical Trader Qatar - November 14, 2023 التحليل الفني اليومي ل...
 
QNBFS Daily Technical Trader Qatar - November 06, 2023 التحليل الفني اليومي ل...
QNBFS Daily Technical Trader Qatar - November 06, 2023 التحليل الفني اليومي ل...QNBFS Daily Technical Trader Qatar - November 06, 2023 التحليل الفني اليومي ل...
QNBFS Daily Technical Trader Qatar - November 06, 2023 التحليل الفني اليومي ل...
 
QNBFS Daily Market Report October 30, 2023
QNBFS Daily Market Report October 30, 2023QNBFS Daily Market Report October 30, 2023
QNBFS Daily Market Report October 30, 2023
 
QNBFS Daily Technical Trader Qatar - October 25, 2023 التحليل الفني اليومي لب...
QNBFS Daily Technical Trader Qatar - October 25, 2023 التحليل الفني اليومي لب...QNBFS Daily Technical Trader Qatar - October 25, 2023 التحليل الفني اليومي لب...
QNBFS Daily Technical Trader Qatar - October 25, 2023 التحليل الفني اليومي لب...
 
QNBFS Daily Technical Trader Qatar - October 10, 2023 التحليل الفني اليومي لب...
QNBFS Daily Technical Trader Qatar - October 10, 2023 التحليل الفني اليومي لب...QNBFS Daily Technical Trader Qatar - October 10, 2023 التحليل الفني اليومي لب...
QNBFS Daily Technical Trader Qatar - October 10, 2023 التحليل الفني اليومي لب...
 
QNBFS Daily Technical Trader Qatar - October 11, 2023 التحليل الفني اليومي لب...
QNBFS Daily Technical Trader Qatar - October 11, 2023 التحليل الفني اليومي لب...QNBFS Daily Technical Trader Qatar - October 11, 2023 التحليل الفني اليومي لب...
QNBFS Daily Technical Trader Qatar - October 11, 2023 التحليل الفني اليومي لب...
 
QNBFS Daily Technical Trader Qatar - October 10, 2023 التحليل الفني اليومي لب...
QNBFS Daily Technical Trader Qatar - October 10, 2023 التحليل الفني اليومي لب...QNBFS Daily Technical Trader Qatar - October 10, 2023 التحليل الفني اليومي لب...
QNBFS Daily Technical Trader Qatar - October 10, 2023 التحليل الفني اليومي لب...
 
QNBFS Daily Market Report October 04, 2023
QNBFS Daily Market Report October 04, 2023QNBFS Daily Market Report October 04, 2023
QNBFS Daily Market Report October 04, 2023
 
QNBFS Daily Technical Trader Qatar - October 04, 2023 التحليل الفني اليومي لب...
QNBFS Daily Technical Trader Qatar - October 04, 2023 التحليل الفني اليومي لب...QNBFS Daily Technical Trader Qatar - October 04, 2023 التحليل الفني اليومي لب...
QNBFS Daily Technical Trader Qatar - October 04, 2023 التحليل الفني اليومي لب...
 
QNBFS Daily Technical Trader Qatar - September 28, 2023 التحليل الفني اليومي ...
QNBFS Daily Technical Trader Qatar - September 28, 2023 التحليل الفني اليومي ...QNBFS Daily Technical Trader Qatar - September 28, 2023 التحليل الفني اليومي ...
QNBFS Daily Technical Trader Qatar - September 28, 2023 التحليل الفني اليومي ...
 
QNBFS Daily Market Report September 24, 2023
QNBFS Daily Market Report September 24, 2023QNBFS Daily Market Report September 24, 2023
QNBFS Daily Market Report September 24, 2023
 
QNBFS Daily Technical Trader Qatar - September 24, 2023 التحليل الفني اليومي ...
QNBFS Daily Technical Trader Qatar - September 24, 2023 التحليل الفني اليومي ...QNBFS Daily Technical Trader Qatar - September 24, 2023 التحليل الفني اليومي ...
QNBFS Daily Technical Trader Qatar - September 24, 2023 التحليل الفني اليومي ...
 
QNBFS Daily Technical Trader Qatar - September 19, 2023 التحليل الفني اليومي ...
QNBFS Daily Technical Trader Qatar - September 19, 2023 التحليل الفني اليومي ...QNBFS Daily Technical Trader Qatar - September 19, 2023 التحليل الفني اليومي ...
QNBFS Daily Technical Trader Qatar - September 19, 2023 التحليل الفني اليومي ...
 
QNBFS Daily Market Report September 17, 2023
QNBFS Daily Market Report September 17, 2023QNBFS Daily Market Report September 17, 2023
QNBFS Daily Market Report September 17, 2023
 
QNBFS Weekly Market Report September 07, 2023
QNBFS Weekly Market Report September 07, 2023QNBFS Weekly Market Report September 07, 2023
QNBFS Weekly Market Report September 07, 2023
 
QNBFS Daily Technical Trader Qatar - September 07, 2023 التحليل الفني اليومي ...
QNBFS Daily Technical Trader Qatar - September 07, 2023 التحليل الفني اليومي ...QNBFS Daily Technical Trader Qatar - September 07, 2023 التحليل الفني اليومي ...
QNBFS Daily Technical Trader Qatar - September 07, 2023 التحليل الفني اليومي ...
 

Qatar monthly monitor 6th december 2012

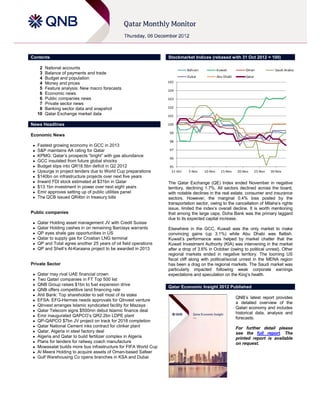
  • 1. Contents Stockmarket Indices (rebased with 31 Oct 2012 = 100) 2 National accounts Bahrain Kuwait Oman Saudi Arabia 3 Balance of payments and trade 4 Budget and population Dubai Abu Dhabi Qatar 4 Money and prices 105 5 Feature analysis: New macro forecasts 104 6 Economic news 6 Public companies news 103 7 Private sector news 8 Banking sector data and snapshot 102 10 Qatar Exchange market data 101 News Headlines 100 99 Economic News 98  Fastest growing economy in GCC in 2013  S&P maintains AA rating for Qatar 97  KPMG: Qatar’s prospects “bright” with gas abundance 96  GCC insulated from future global shocks  Budget slips into QR18.5bn deficit in Q2 2012 95  Upsurge in project tenders due to World Cup preparations 31‐Oct 5‐Nov 10‐Nov 15‐Nov 20‐Nov 25‐Nov 30‐Nov  $140bn on infrastructure projects over next five years  Inward FDI stock estimated at $31bn in Qatar The Qatar Exchange (QE) Index ended November in negative  $13.1bn investment in power over next eight years territory, declining 1.7%. All sectors declined across the board,  Emir approves setting up of public utilities panel with notable declines in the real estate, consumer and insurance  The QCB issued QR4bn in treasury bills sectors. However, the marginal 0.4% loss posted by the transportation sector, owing to the cancellation of Milaha’s rights issue, limited the index’s overall decline. It is worth mentioning Public companies that among the large caps, Doha Bank was the primary laggard due to its expected capital increase.  Qatar Holding asset management JV with Credit Suisse  Qatar Holding cashes in on remaining Barclays warrants Elsewhere in the GCC, Kuwait was the only market to make  QP eyes shale gas opportunities in US convincing gains (up 3.1%) while Abu Dhabi was flattish.  Qatar to supply gas for Croatian LNG terminal Kuwait’s performance was helped by market chatter that the  QP and Total agree another 25 years of oil field operations Kuwait Investment Authority (KIA) was intervening in the market  QP and Shell’s Al-Karaana project to be awarded in 2013 after a drop of 3.6% in October (owing to political unrest). Other regional markets ended in negative territory. The looming US fiscal cliff along with political/social unrest in the MENA region Private Sector has been a drag on the regional markets. The Saudi market was particularly impacted following weak corporate earnings  Qatar may rival UAE financial crown expectations and speculation on the King’s health.  Two Qatari companies in FT Top 500 list  QNB Group raises $1bn to fuel expansion drive Qatar Economic Insight 2012 Published  QNB offers competitive land financing rate  Ahli Bank: Top shareholder to sell most of its stake QNB’s latest report provides  EFSA: EFG-Hermes needs approvals for QInvest venture a detailed overview of the  QInvest arranges Islamic syndicated facility for Mazaya Qatari economy and includes  Qatar Telecom signs $500mn debut Islamic finance deal historical data, analysis and  Emir inaugurated QAPCO’s QR2.2bn LDPE plant forecasts.  QP-QAPCO $7bn JV project on track for 2018 completion  Qatar National Cement inks contract for clinker plant For further detail please  Qatar, Algeria in steel factory deal see the full report. The  Algeria and Qatar to build fertilizer complex in Algeria printed report is available  Plans for tenders for railway coach manufacture on request.  Mowasalat builds more bus infrastructure for FIFA World Cup  Al Meera Holding to acquire assets of Oman-based Safeer  Gulf Warehousing Co opens branches in KSA and Dubai
  • 2. Qatar Monthly Economic Monitor th 6 December 2012 National Accounts Nominal GDP (QR bn) 2008 2009 2010 2011 Q2-12 QoQ% YoY% Oil prices now look set to Total 419.6 356.0 463.5 630.9 173.4 -1.1% 11.9% average US$ 111/barrel in 2012, Oil & Gas 230.3 159.5 239.7 364.5 96.8 -6.4% 8.2% versus our forecast (made Non-oil 189.3 196.5 223.7 266.4 76.6 6.4% 16.9% in 2011) for US$ 110. We have Agriculture and Fishing 0.5 0.4 0.5 0.6 0.1 -0.7% 1.4% marginally revised up our Industry 74.1 60.9 75.4 89.1 27.4 6.8% 15.0% 2012 nominal GDP forecast Manufacturing 44.9 33.6 49.2 62.7 19.4 5.4% 14.6% to QR711 bn (12.7% growth Electricity, Gas and Water 2.1 1.8 2.1 2.6 0.7 23.1% 10.3% with 8.8% in oil and gas Construction 27.2 25.5 24.1 23.8 7.1 9.6% 17.0% sectors and 18.0% in non-oil) Services 111.1 132.1 143.8 173.2 48.1 47.6% 18.2% Trade, Restaurants and Hotels 23.4 29.8 32.3 35.7 10.0 9.4% 10.6% Transport and Communications 14.8 16.2 18.3 21.9 6.3 14.2% 16.0% Government services is up Financial and Business Services 51.6 58.1 62.1 73.7 17.9 6.5% 6.2% 39% YoY due to the rise in Social Services 3.5 4.1 4.3 4.9 1.4 4.9% 11.0% salaries for Qatari nationals, Government Services 26.3 32.1 35.8 46.7 14.8 0.4% 39.0% by contrast in real terms Household Services 1.7 1.8 1.9 2.0 0.6 8.2% 16.2% the sector grew only 1.6% Imputed Bank Service Charges -10.1 -10.2 -11.0 -11.7 -2.8 4.1% -5.0% Import Duties 3.5 3.1 4.0 3.5 1.0 11.6% 13.0% Source: QSA Real GDP (% change, YoY) 2008 2009 2010 2011 2012F Q2-12 QoQ% Following the completion of Total 17.7 12.0 16.7 13.0 5.6 5.0 2.5 most planned expansions in Oil & Gas 13.2 4.5 28.8 15.7 2.7 0.8 -0.1 the gas sector, non-oil is now Non-oil 21.3 17.6 8.6 10.8 8.0 8.5 4.5 driving growth Agriculture and Fishing 36.7 -17.0 19.0 4.5 3.3 1.8 -1.9 Industry 45.8 9.3 9.6 7.0 8.7 9.1 4.5 We have slightly revised up Manufacturing 18.9 13.7 22.4 7.9 8.2 8.0 6.0 our forecast for 2012 real Electricity, Gas and Water 12.3 -0.4 1.9 23.9 13.6 10.3 23.1 GDP growth from 5.4% last Construction 79.2 6.9 0.4 4.9 8.8 10.0 1.7 month to 5.6%. This is owing Services 13.2 21.9 7.0 13.2 7.6 8.1 4.4 Trade, Restaurants and Hotels 6.4 15.7 9.0 9.0 4.5 4.1 3.8 to: oil prices being higher Transport and Communications 51.0 22.7 10.2 18.0 15.5 18.0 11.7 than expected; strong Financial and Business Services 8.9 25.8 7.2 8.0 9.8 12.1 10.2 indications of non-oil activity, Social Services 4.5 21.5 1.2 12.3 3.1 2.4 0.9 such as higher population Government Services 8.9 23.6 4.1 20.1 3.0 1.6 -3.8 growth and rising rent Household Services 3.8 4.3 2.2 3.4 12.3 11.1 5.8 prices; higher imports; and Imputed Bank Service Charges 35.6 1.0 3.3 4.3 8.4 8.6 10.7 an uptick in oil production Import Duties -21.4 -11.3 33.6 -16.5 7.8 8.3 10.1 Source: QSA and QNB Group Forecasts for 2012     Non-oil Oil & Gas Real change (%QoQ, RHS) 180 10% 120 4% QR bn 60 -2% 0 -8% Q2 10 Q3 10 Q4 10 Q1 11 Q2 11 Q3 11 Q4 11 Q1 12 Q2 12
  • 3. Qatar Monthly Economic Monitor th 6 December 2012 Balance of Payments and Trade Balance of Payments (US$ bn) 2008 2009 2010 2011 Q2-12 QoQ% YoY% The fall in exports in the last Current Account Balance 26.6 6.4 23.8 52.0 9.6 -2.4% -36.2% year is mainly a result of Trade Balance 42.2 25.6 53.9 87.4 18.5 -6.8% -19.1% lower production of crude Exports 67.3 48.0 74.8 114.3 27.3 -1.4% -5.7% oil, which was compounded in Imports -25.1 -22.5 -20.9 -26.9 -8.8 12.5% 45.1% Q2 2012 versus Q1 as crude Invisibles -15.6 -19.2 -30.1 -35.4 -8.9 -11.2% 14.1% oil prices were lower, Services -3.8 -3.9 -5.8 -9.5 -3.6 28.6% 55.9% however, these trends have Income -6.8 -9.4 -12.9 -13.3 -2.2 -36.5% -8.6% now reversed Transfers -5.0 -5.8 -11.4 -12.7 -3.0 -17.2% 0.5% Capital & Financial Account Balance -24.0 0.6 -10.7 -62.6 -5.2 36% -75% Capital Account -1.4 -1.8 -2.1 -3.6 -1.1 -10% 22% Strong growth in imports in Financial Account -22.6 2.4 -8.6 -59.0 -4.1 56% -79% Q2 has been driven by Direct Investment (outwards) -3.7 -3.2 -1.9 -6.0 -2.1 -208% -19% Machinery and Transport Direct Investment (into Qatar) 3.8 8.1 4.7 -0.1 -0.2 244% -9429% Equipment, an indication that Portfolio investment (net) - - - -18.9 -2.9 -171% 433% project activity may be   40 37 picking up Reserves (US$ bn) 31 International 30 International reserves have 20 rebounded from a low of US$14bn in Nov-11 to 10 14 US$37bn in Sep-12 0 Jan-08 Sep-08 May-09 Jan-10 Sep-10 May-11 Jan-12 Sep-12 Source: QCB, plus UNCTAD for Direct Investment prior to 2011; Note: this is a simplified table and does not show all Balance of Payment lines Top 5 Export Destinations (US$ bn) 2008 2009 2010 2011 Q2-12 QoQ% YoY% Exports to Japan have Japan 18.8 14.5 19.7 27.4 7.9 -10.5% 24.3% surged 24.3% YoY as Pending 12.0 7.6 10.8 18.9 5.9 1.7% 30.0% additional LNG cargoes were European Economic Community (EEC) 3.1 4.0 9.1 16.9 3.2 -7.6% -34.4% dispatched to assist with its India 2.9 3.7 5.6 10.3 4.1 22.8% 54.1% energy crisis following the Singapore 6.4 4.2 5.0 6.8 2.3 32.3% 33.6% closure of its nuclear plants Top 5 Import Sources (US$ bn) 2008 2009 2010 2011 Q2-12 QoQ% YoY% European Economic Community (EEC) 9.3 8.1 7.1 6.6 1.5 -26.8% 12.5% United States 2.5 3.1 3.5 3.1 0.5 -45.8% -21.3% United Arab Emirates 1.8 1.8 2.3 3.0 0.8 0.0% 3.0% Saudi Arabia 1.4 1.3 1.7 2.2 0.6 0.0% 3.0% Japan 2.7 1.8 1.3 1.1 0.4 -22.4% 40.3% Source: IMF Direction of Trade Statisics; Note: the IMF's exports and imports by country differ slightly from QSA figures Crude oil (US$ / barrel) 2008 2009 2010 2011 Oct-12 MoM% YoY% Crude production has been Oil production ('000 bpd) 842.8 781.0 733.0 734.0 735.0* 1.7% -2.1% lower, on average, so far Qatar average price 94.8 62.0 77.7 108.4 110.6 3.0% 4.1% this year as maintenance Dukhan 96.9 62.6 78.4 109.7 112.0 -1.9% 3.7% work is required at some Marine 93.5 61.6 77.2 107.5 110.0 -2.1% 3.4% mature fields, however, it   140 760 has ticked up in recent '000 barrels per day Average price Production 130 750 months US$ / barrel   120 740 110 730 100 720 90 710 Oct-11 Jan-12 Apr-12 Jul-12 Oct-12 Source: OPEC (Direct communications), Reuters; Note: Monthly figures for 2011 have estimated based on downward revisions in OPEC annual figures; September 2012 figure
  • 4. Qatar Monthly Economic Monitor th 6 December 2012 Budget and Population Government Budget (QR bn) 2008/09 2009/10 2010/11 2011/12 Q2-12 QoQ% YoY% Revenue is seasonal and Balance 40.6 53.7 12.8 44.5 -18.5 highly volatile. Q2 % of GDP 9.7% 15.1% 2.8% 7.1% -10.7% revenue is usually lower Revenue 140.6 168.8 155.5 203.4 11.0 -79.6% -65.9% and it is likely to bounce Expenditure 100.0 115.1 142.7 158.9 29.5 -34.0% -14.4% back in H2 Population (m) 2008 2009 2010 2011 Nov-12 MoM% YoY% Population growth has Total 1.45 1.64 1.72 1.73 1.85 5.0% 7.1% accelerated, pointing to a Male 1.11 1.27 1.30 1.30 1.36 4.0% 6.7% pickup in activity. The Female 0.34 0.37 0.42 0.43 0.48 7.9% 8.3% average YoY population Source: QSA; Monthly data is based on those physically in Qatar, based on entries and exits over the borders, while the annual series relates to residency   growth over the last 12 1.9 months was 5.9% Population (m) compared with 1.2% in   1.8 1.7 2011. The growth in 1.6 female expatriates is 1.5 particularly strong Money and Prices Inflation (% ch, 12mth average YoY) 2008 2009 2010 2011 Oct-12 MoM% YoY% Rents have increased for Overall (weights shown below) 15.2 -4.9 -2.4 1.9 1.8 0.4 2.7 four consecutive months Food, beverages & tobacco (13.2%) 19.9 1.3 2.1 4.3 4.0 -0.8 4.1 and are positive YoY for Clothing & footwear (5.8%) 11.8 -4.5 -1.3 7.5 3.5 0.9 3.0 the first time since 2008, Rents, water & maintenance (32.2%) 19.7 -12.0 -12.8 -4.8 -4.5 0.7 0.6 confirming the reversal of Furniture, textiles & appliances (8.2%) 7.7 -2.0 4.1 2.9 5.5 -0.8 3.1 the downward trend in Health care (2.0%) 4.2 1.7 3.5 2.6 1.8 0.7 1.0 rent inflation Transport & communication (20.5%) 9.3 -4.4 2.6 6.4 2.9 -0.8 1.4 Entertainment, leisure & culture (10.9%) 9.9 -1.2 2.9 2.0 6.0 4.5 5.8 The increases are Miscellaneous goods & services (7.2%) 12.4 7.3 4.7 5.6 5.2 0.4 4.3 probably related to an Source: QSA   3% increase in immigration and point to a pickup in Inflation (%YoY) overall economic activity   0% Jan-10 Jul-10 Oct-10 Jan-11 Jul-11 Oct-11 Jan-12 Jul-12 Oct-12 Apr-10 Apr-11 Apr-12 -3% -6% Money Supply (QR bn) 2008 2009 2010 2011 Sep-12 MoM% YoY% Broad money (M2) 184.0 215.1 264.7 310.0 374.7 1.5% 18.5% M1 50.9 53.1 68.3 81.8 90.1 4.4% 24.7% Quasi-money 133.1 162.0 196.4 228.1 284.6 0.6% 16.7% Interest rates (%, end period) 2008 2009 2010 2011 Sep-12 MoM bp YoY bp Lending rates fell sharply QCB deposit 2.0 2.0 1.5 0.8 0.8 0 0 following QCB action in QCB lending 5.5 5.5 5.5 4.5 4.5 0 0 2011, but are now picking Interbank overnight 2.0 2.0 1.4 0.7 0.8 2 29 up marginally Demand deposit 1.8 2.0 1.3 0.6 0.6 14 2 Overdraft 8.8 8.8 8.2 7.4 6.9 -61 -95 Credit card 20.7 20.0 19.9 10.7 11.3 90 -195 Source: QCB
  • 5. Qatar Monthly Economic Monitor th 6 December 2012 Feature analysis: QNB Group extends key forecasts to 2014 We have updated our key macroeconomic forecasts and Real GDP (% change) extended our coverage to 2014. Energy prices and production are at the core of our forecast methodology, as government Overall Oil & Gas Non-Oil revenue from oil and gas determines activity in much of the economy. Our original forecast for 2012 Brent oil prices was 15.7 US$110/barrel, which is very close to the annual average so far this year. We expect oil prices to weaken to US$108/b in 2013 and US$102/b in 2014. Important developments since our last 10.8 forecasts include the stabilisation of rent prices, a pickup in population growth and more rapid growth in imports. All of this 8.0 points to a pickup in project activity, as covered in our last 6.4 6.0 monthly report. 3.6 4.3 2.7 As a result of these factors, we have slightly revised up our forecast for 2012 real GDP growth from 5.4% last month to 5.6%. This level remains well below the 13.0% growth of 2011 as major LNG expansion projects have been completed and as 2011 2012f 2013f 2014f oil production was cut back in early 2012, though it has recently risen from mid-year lows. 13.0 5.6 5.2 5.3 Investment in the redevelopment of oil fields should yield higher Source: QSA and QNB Group forecasts (f) production in 2013-14 and the launch of the second phase of the Pearl GTL project should boost gas production. The first stage of the Barzan gas project (a new project to supply the Mid-Year Population domestic market) should begin to come online in late 2014, further boosting growth in the oil and gas sector. Total (m) % change Growth has slowed in the non-oil sector from 10.8% in 2011 to a forecast 8.0% in 2012. There has been a lull in activity in early 5.4 2012 as the process of tendering major infrastructure projects has taken longer than expected. This is one reason why government expenditure was lower in the first half of 2012 than 3.1 2.8 in the first half of 2011. This has had a particular impact on government services, which we expect to grow by 3.0% in 2012 versus 20.1% in 2011, and trade restaurants and hotels, which we expect to grow by 4.5% in 2012 versus 9.0% in 2011. 1.0 We forecast that non-oil growth will moderate further to 6.4% in 2013 and 6.0% in 2014. This is a slowdown from exceptionally strong growth in previous years, but it remains relatively high 2011 2012f 2013f 2014f compared to other emerging and regional economies. Notably, 1.73 1.83 1.88 1.93 we expect a moderation in manufacturing after some major capacity expansions in 2011-12. Source: QSA and QNB Group forecasts We forecast a 5.4% increase in population in 2012, which is most probably related to an initial ramp up of expatriate workers CPI Inflation (% change) being brought in to assist with the implementation of projects. We expect population growth to moderate to 3.1% in 2013 and Overall CPI 2.8% in 2014. This will lead to a broader deceleration in growth, particularly in transport, storage and communications, a sector Non-rent CPI that is closely linked to manufacturing and population growth. 4.7 CPI inflation is set to average 2.0% in 2012. This is slightly higher than forecasted earlier in the year as rental prices have 4.0 3.3 turned a corner quicker than expected (rent accounts for 32% of 3.0 the CPI basket). Non-rent inflation is expected to be 4.0% in 3.2 2012. Prices of the following categories have all risen by over 4.0%: food, beverages and tobacco; furniture, textiles and home 2.0 2.7 1.9 appliances; entertainment and culture; and miscellaneous goods (mainly education). While we expect non-rent inflation to moderate in 2013-14, a bounce back in rents (forecast to rise 3.7% in 2013 and 4.1% in 2014) will drive up overall inflation. 2011 2012f 2013f 2014f Source: QSA and QNB Group analysis   Page 5 of 10
  • 6. Qatar Monthly Economic Monitor th 6 December 2012 Economic News  Fastest growing economy in GCC – According to a Fitch equivalent to 10.7% of GDP. Qatar's budget usually faces a Ratings report, Qatar’s economy will remain the fastest deficit in the first quarter, which begins in April, and then growing among all GCC economies in 2013, driven by the bounces back to a surplus during the rest of the year mainly government’s huge capital investment program. (Gulf- owing to the timing of revenue flows. (Reuters) Times.com)  Upsurge in project tenders due to World Cup  S&P maintains AA rating for Qatar – Global ratings agency preparations – According to MEED Events, Qatar is set to Standard & Poor’s (S&P) has maintained its AA/Stable/A-1+ see an upsurge in project tenders in the next two years, as the sovereign credit ratings for Qatar. The ratings reflect S&P’s country enters the crucial phase of its preparations for the view of its high levels of economic wealth and strong fiscal 2022 FIFA World Cup. New tenders, bidding and awards are and external balance sheets with modest levels of debt and expected to reach $30bn a year from 2013-2014. (MEED) large external liquidity. S&P expects Qatar to maintain a  Qatar to invest $140bn on infrastructure projects over comfortable budget surplus of about 6% of GDP on average next five years – According to Qatar’s Economy and Finance between 2012 and 2015. S&P expects the trade surplus to Minister, HE Yousef Hussein Kamal, Qatar will investment remain strong in 2012 because of oil prices. (S&P) US$140bn in 2013-17 on large infrastructure projects  KPMG: Qatar’s prospects “really bright” in view of its gas including the first phase of railway development, as well as abundance – KPMG International Chairman Michael Andrew education and social development sectors’ plans, in an effort said Qatar’s prospects are really bright in view of the nation’s to put its long-term investment strategy into action. (Gulf- abundant natural gas, which is the “energy source of future”. Times.com) He said Qatar is one of the “most efficient” producers of gas in  Inward FDI stock estimated at $31bn in Qatar – Inward the world. However, Andrew stressed Qatar needed to change foreign direct investment (FDI) into Qatar has been resilient on its ownership rules if it is to succeed in tapping foreign the back of oil & gas investments. QNB estimated the current investment, which is key to diversifying the national economy. stock of inward FDI to be around $31bn, accounting for 17.8% He also hailed Qatar’s efforts towards realizing a knowledge- of the country’s GDP. Around half of inward FDI was towards based economy over the next few years. (Gulf-Times.com) the oil & gas sector and the remainder in the finance and real  GCC insulated from future global shocks – According to a estate sectors. (QNB) QNB report, the GCC region is “insulated” from potential  $13.1bn investment in power over next eight years – shocks, despite the gloomy outlook for world economy. The mainly in the transmission and distribution segments. Driven IMF estimates that 1% lower real GDP in either the US or euro by high GDP growth rates and population explosion, power Area would lead to 0.4% lower GDP in the GCC a year later, consumption in Qatar has increased at a compound rate of while a 1% fall in China’s growth would lead to a 0.1% fall in 9.3% during the 2001-2011 period. (Peninsula Qatar) the GCC. In Qatar and Kuwait, the breakeven oil price rose by just over $15 a barrel from 2008-12 to around $40 and $50  Emir approves setting up of public utilities panel – HH the respectively. In Oman, Saudi Arabia and the UAE the Emir Sheikh Hamad bin Khalifa Al Thani ratified the cabinet’s breakeven price is around $80. Although this remains below decision for setting up a coordinating committee to manage oil prices of over $100 per barrel, the QNB report says that a services and public utilities. The panel is being set up to help sustained drop in oil prices could prompt some GCC countries the Public Works Authority (Ashghal) to remove hurdles in to implement fiscal consolidation, which may lead to softer executing pubic projects by coordinating with various state and growth in the non-oil economy. QNB expects that oil prices will non-government agencies, including private sector companies. fall slightly to $108 in 2013. (QNB) (Peninsula Qatar)  Budget slips into QR18.5bn deficit in Q2 2012 – According  The QCB issued QR4bn in treasury bills – In early QCB data, Qatar's government budget slipped into a deficit of November, the Qatar Central Bank (QCB) issued treasury bills QR18.5bn in the first quarter of its fiscal year 2012-13, worth QR4bn with maturities of 91, 182 and 273 days. (QCB) Public Companies News  Qatar Holding creates asset management JV with Credit considering partnerships with one or more shale gas players to Suisse – Credit Suisse and Qatar Holding are establishing an participate in such a project. (Bloomberg) asset management JV, Aventicum Capital Management. The  Qatar to supply gas for Croatian LNG terminal – According JV will operate out of two divisions including a Doha-based to Croatian Economy Minister Radimir Cacic, Qatar will supply business focused on investment strategies in the Middle East, gas for the proposed Croatian LNG terminal on the island of Turkey and other frontier markets, as well as an international Krk for the next 25 years. He said Qatar may also invest in business, based outside of the region. The Doha-based further developing the terminal. (Bloomberg) division will be launched in early 2013, followed by the launch of the international business later in the year. The Doha-based  QP and Total agree to continue operations on Al Khalij oil division will be licensed and regulated by the Qatar Financial field for another 25 years – QP and Total have signed an Center. (Gulf-Times.com) agreement extending their operations at the Al Khalij field for another 25 years. Under the new agreement, QP holds 60%  Qatar Holding cashes in on remaining Barclays warrants – operating interest, while Total holds the remainder. Its remaining holding of 379m units of Barclays warrants – (Bloomberg) instruments that convert into shares – have been monetized as part of its active portfolio management, without affecting its  QP and Shell’s Al-Karaana project to be awarded in 2013 – 6.65% stake in the bank. In a separate statement, Deutsche The front-end engineering design (FEED) contract for the Al- Bank AG and Goldman Sachs Group Inc said they would sell Karaana Petrochemicals Project at Ras Laffan is expected to up to 303.3m Barclays ordinary shares in relation to the be awarded in early 2013. The project, being set up jointly by monetization of the warrants by Qatar. (Reuters) Qatar Petroleum (QP) and Shell, would produce cost- competitive products to be sold worldwide. (Gulf-Times.com)  QP eyes shale gas opportunities in US – Qatar Petroleum (QP) is exploring opportunities in upstream US shale gas projects that would enable it to export LNG. The company is Page 6 of 10
  • 7. Qatar Monthly Economic Monitor th 6 December 2012 Private Sector News  Qatar may rival UAE financial crown – The UAE's financial and QAPCO at Ras Laffan has reached the engineering community has warned that competition from Qatar may phase. The project is expected to be completed by 2018. create a powerful rival to the Dubai International Financial (Gulf-Times.com). Center if its market law is not developed further. New market  Qatar National Cement inks a consulting contract for regulations for onshore fund management issued by the UAE clinker plant – QNCC signed a consulting contract to build a Securities and Commodities Authority have substantially clinker plant with a capacity of 5,000-7,500 tons/day. The increased the regulatory burden on fund managers. The new tender for building the plant will be out in January 2013. The regime is unpopular among firms based in Dubai, which could new plant is expected to start production in 2015 and will persuade them to establish themselves elsewhere. In the increase QNCC’s annual output capacity to around 6m tons. meantime, the nearby Qatar Financial Centre appears (QE) increasingly competitive. (Gulfbase.com)  Qatar, Algeria in steel factory deal – Qatar and Algeria have  Two Qatari companies in FT Top 500 list – Two Qatari signed a MoU for establishing a steel factory in Algeria with a companies, QNB Group and Industries Qatar, remain in the production capacity of 5mn tons a year. The factory, during its Financial Times’ (FT) list of the top 500 global companies first phase, will produce 2mn tons, at an estimated investment based on market capitalization as at the end of September cost of $2bn. (Gulf-Times.com) 2012. Market capitalization for QNB and Industries Qatar rose 5% and 15%, respectively, in the year up to September 2012.  Algeria and Qatar to build fertilizer complex in Souk QNB’s rise comes on the back of strong financial results. Ahras – Algeria and Qatar are planning to construct a (Gulf-Times.com) phosphate fertilizer complex in Algeria through a partnership. The proposed project is expected to produce phosphate and  QNB Group raises $1bn to fuel expansion drive – A QNB nitrogen fertilizers. (Bloomberg) bond sale raised $1bn. The bonds, priced to yield 145 basis points above the mid-swap rate, offer a coupon of 2.125% and  Plans for tenders for railway coach manufacture – Qatar mature in February 2018. QNB’s order books reached $3bn has plans to float tenders for the manufacture and supply of rail ahead of the bond launch. HSBC Holdings, Deutsche Bank, coaches, and installation of control systems for its multi-billion Mitsubishi UFJ Securities, Standard Chartered and QNB dollar Greater Doha Metro project by the second quarter of Capital arranged the transaction under the bank’s euro 2013. Qatar Rail said a workshop will be held next month for Medium-Term Note program. (Bloomberg) prospective bidders—companies and contractors—to familiarize them with the tendering process, and safety aspects  QNB offers competitive land financing rate – a new of the control systems. (Peninsula Qatar) campaign aims to provide the lowest interest rate of 4.5% to Qatari customers who seek land financing from the bank.  Mowasalat builds more bus infrastructure for FIFA World Further, QNB offers zero payments and interest for the first six Cup – Mowasalat is implementing major plans to provide months to those customers who hold or will hold salary better public transport facilities in the country due to the accounts with QNB. Additionally, self-employed customers are increased usage of public transport over the coming decade in also eligible for the offer. (Gulf-Times.com) the wake of Qatar’s preparations for the 2022 FIFA World Cup. Plans include a hub in Doha city and new stations in  Ahli Bank: Top shareholder to sell most of its stake – Ahli West Doha, Al Khor and Al Wakrah and a servicing and Bank announced its strategic partner, Bahrain's Ahli United maintenance facility in Ain Khalid. (Gulf-Times.com) Bank, would sell nearly all its stake in the Qatari bank. QCB is reviewing the proposed sale. (Reuters)  Al Meera Holding to acquire assets of Oman-based Safeer – Al Meera Holding and Al Meera Development Company has  EFSA: EFG-Hermes needs more approvals for QInvest signed a Sale & Purchase Agreement (SPA) to buy assets of Venture – According to the Egyptian Financial Supervisory Safeer stores based in the Sultanate of Oman. The two Authority (EFSA), EFG-Hermes Holding SAE, which seeks to companies will have a total stake of 70% in a new subsidiary create an investment bank with QInvest, needs to get further established to run the acquired business. (Peninsula Qatar) approvals from the Egyptian Exchange and EFSA for the deal. (Bloomberg)  Gulf Warehousing Co opens branches in Saudi Arabia and Dubai – Gulf Warehousing Company has opened  QInvest arranges $106.7m Islamic syndicated project branches in Jeddah and Riyadh in Saudi Arabia and in Dubai. finance facility for Mazaya Qatar – QInvest has arranged a Further, the company plans to open another branch soon in dual-currency 8-year syndicated facility worth $106.7mn for Bahrain after the formalities are processed by the end of Mazaya Qatar Real Estate Development to finance the 2012. (QE) development of the Sidra Village Residential Project. QInvest acted as a financial advisor and the sole bookrunner for the facility. (Gulfbase.com)  Qatar Telecom signs $500mn debut Islamic finance deal – Qatar Telecom has signed its debut Islamic financing facility worth $500mn. The deal, which runs for 18 months and is structured as a revolving murabaha facility, was provided by Qatar Islamic Bank in its capacity as the sole mandated lead arranger. Qatar Telecom had sent out requests for proposals to banks for a syndicated loan of up to $1bn. (Reuters)  Emir inaugurated QAPCO’s QR2.2bn LDPE plant – HH the Emir Sheikh Hamad bin Khalifa al Thani inaugurated Qatar Petrochemical Company’s (QAPCO) QR2.2bn new low- density polyethylene plant (LDPE) at the Mesaieed Industrial City on November 20. (Qatar Tribune)  QP-QAPCO $7bn JV project on track for 2018 completion – The petrochemical project being developed jointly by QP Page 7 of 10
  • 8. Qatar Monthly Economic Monitor th 6 December 2012 Banking Sector Snapshot – end-November 2012 Review and Outlook Banking Sector Index vs. QE All Share Index Liquidity for the Qatari banking system improved with 110 deposits for the month of October up by 1.8% MoM versus a marginal increase of 0.4% MoM in the loan book. The sector 105 loan-to-deposit ratio (LDR) declined to 110% in October versus 100 112% at the end of September 2012. Furthermore, the domiciled loan-to-deposit ratio for the sector followed suit and stood at 95 104% vs. 105% in September. Liquidity has significantly improved throughout the year (current LDR of 110% vs. the 2012 90 high of 124% in April). We forecast loan growth in excess of 20% for 2012 and expect NIMs to contract by approximately 10bps. 85 5-Oct-2012 5-Nov-2012 31-Jan-2012 31-Dec-2011 2-Mar-2012 4-Jul-2012 3-May-2012 The public sector led deposit growth in the month of 3-Jun-2012 2-Apr-2012 4-Aug-2012 4-Sep-2012 October. Scrutinizing the segment details, public sector deposits expanded 4.6% and 32.4%, MoM and YTD, respectively. As is generally the case, government institutions contributed to the bulk of the growth. This segment grew by 9.3% MoM (83.4% QE All Share Index QE Banks & Financial Services Index YTD). The government and semi-government institutions Source: Bloomberg segments were negative contributors to growth, declining by 2.5% and 2.9% MoM, respectively. On the other hand, private Banking Sector - Loan to Deposit (LTD) sector deposits ended October flat. The companies/institutions segment shed 1.4% MoM. This decline was mitigated by a 1.4% 130% 500,000 growth in deposits from consumers. Consequently, total system deposits inched up by 1.8% MoM (20.6% YTD). It should be 120% 400,000 Loan to Deposit Ratio noted that most of the growth in deposits was realized in May and July. 110% 300,000 QR mn The overall loan book witnessed flat growth of 0.4% MoM 100% 200,000 (20.1% YTD). Total domestic public sector loans were down by 2.2% MoM (+35.0% YTD). The driver behind this drop was 90% 100,000 mainly the government segment, which contracted by 11.1% MoM (-7.9% YTD). The drop from this segment was mitigated by 80% - the government and semi-government institutions, which Oct-11 Nov-11 Dec-11 Oct-12 Feb-12 Mar-12 Jul-12 May-12 Jan-12 Jun-12 Aug-12 Sep-12 Sep-11 Apr-12 witnessed flat growth MoM (+54.8% and +32.7% YTD, respectively). It should be noted that government institutions Loans Deposits Loan to Deposit Ratio represent 70% of total public sector loans. Moreover, a significant portion of the growth in public sector loans took place Source: Qatar Central Bank (QCB) in the second quarter, which witnessed a 26% QoQ expansion. Loan Pie Private sector loans gained some traction and registered a 2.6% increase MoM (11.0% YTD). Consumption loans ended October flat (+5.8% YTD). All of the other sub-segments under private sector loans gained 52% across the board, most notably real estate (+1.1% MoM, +8.2% YTD) services (+12.8% MoM, 18.3% YTD), contractors (3.1% MoM, 3.3% YTD) and general trade (2.4% MoM and 26.4% YTD). Specific loan loss provisions rested at 1.3% of average trailing 12-months loans (October: 1.3%), indicating minimal 6% growth in provisions. We expect 2012 provisions to be in the 42% range of 1.3% to 1.5%. NIMs expected to come under pressure. Interbank rates (3M and 6M), have been trending lower in recent months. International  Public Sector Private Sector Source: QCB (as of end October 2012) Page 8 of 10
  • 9. Qatar Monthly Economic Monitor th 6 December 2012 Banking Sector Indicators (In QR mn) 2010 2011 1Q-12 2Q-12 Sep-12 Oct-12 Change MoM Change YTD Total Assets 567,482 694,301 700,546 742,817 789,456 799,856 1.3% 15.2% Total Credit (Loans) 314,481 403,563 412,247 460,946 482,719 484,667 0.4% 20.1% Total Deposits 306,788 363,612 348,356 378,254 430,938 438,686 1.8% 20.6% Loan to Deposit Ratio 103% 111% 118% 122% 112% 110% -1.4% -0.5% Credit Facilities (Geographic) Total Domestic Credit 293,920 376,695 384,622 432,472 452,086 454,051 0.4% 20.5% Total International Credit 20,561 26,867 27,625 28,475 30,634 30,615 -0.1% 13.9% Domestic Credit Facilities - Public Sector Government 36,303 40,801 32,235 31,967 42,258 37,578 -11.1% -7.9% Government Institutions 50,452 90,619 105,268 136,992 140,125 140,298 0.1% 54.8% Semi-Government Institutions 16,303 17,750 15,100 23,199 23,558 23,557 0.0% 32.7% Total Domestic Public Sector Credit 103,058 149,170 152,603 192,158 205,941 201,433 -2.2% 35.0% Domestic Credit Facilities - Private Sector General Trade 24,875 26,855 27,590 29,610 33,149 33,951 2.4% 26.4% Industry 6,648 6,534 5,755 6,883 8,070 8,142 0.9% 24.6% Contractors 18,411 16,220 16,532 15,195 16,249 16,757 3.1% 3.3% Real Estate 51,042 76,220 80,113 81,976 81,624 82,488 1.1% 8.2% Consumption & Others 60,345 71,986 76,386 79,210 75,881 76,130 0.3% 5.8% Services 29,541 29,709 25,643 27,439 31,171 35,151 12.8% 18.3% Total Domestic Private Sector Credit 190,862 227,525 232,019 240,314 246,144 252,618 2.6% 11.0% Deposit Details (Geographic) Resident Deposits 277,107 343,777 327,183 351,575 400,441 407,569 1.8% 18.6% Non-resident Deposits 29,681 19,835 21,174 26,679 30,497 31,117 2.0% 56.9% Deposits - Public Sector Government 18,486 40,825 31,352 26,354 33,842 33,009 -2.5% -19.1% Government Institutions 32,277 57,351 46,679 54,822 96,268 105,205 9.3% 83.4% Semi Government Institutions 21,309 27,700 23,039 26,679 29,277 28,428 -2.9% 2.6% Total Public Sector Deposit 72,071 125,876 101,070 107,855 159,387 166,642 4.6% 32.4% Deposits - Private Sector Personal 90,828 103,093 111,843 117,147 117,470 119,106 1.4% 15.5% Companies & Institutions 114,207 114,809 114,270 126,574 123,584 121,821 -1.4% 6.1% Total Private Sector Deposit 205,036 217,902 226,113 243,721 241,054 240,927 -0.1% 10.6% Page 9 of 10
  • 10. Qatar Monthly Economic Monitor th 6 December 2012 Qatar Exchange Market Performance Price % Change 5- % Change Market Cap. Company Name (November 29) Day Monthly QR Million TTM P/E P/B Div. Yield Qatar National Bank 130.60 (0.99) (2.46) 91,385 10.8 2.0 2.8 Qatar Islamic Bank 75.00 (1.83) (2.22) 17,722 12.6 1.6 6.0 Commercial Bank of Qatar 73.50 1.10 2.23 18,187 9.4 1.3 8.2 Doha Bank 50.80 (2.31) (7.13) 10,500 8.1 1.4 8.9 Al Ahli Bank 52.00 (3.70) (2.80) 5,831 12.7 2.0 N/A Qatar International Islamic Bank 52.50 0.00 0.19 7,947 11.7 1.6 6.7 Masraf Al Rayan 26.30 (0.19) (0.38) 19,725 13.3 2.1 1.9 Al Khaliji Bank 16.90 1.20 (2.31) 6,084 12.0 1.1 5.9 National Leasing 45.00 (1.96) (2.91) 2,227 8.2 1.7 6.8 Dlala Holding 35.35 2.32 2.17 707 19.1 3.0 2.8 Qatar & Oman Investment 12.49 (0.79) (2.65) 393 19.5 1.2 4.0 Islamic Holding Group 37.50 0.00 (1.32) 150 23.0 3.4 2.7 Banking and Financial Services 180,858 Zad Holding 57.80 (0.17) (5.56) 756 7.2 0.6 N/A Qatar German Co. for Medical Devices 13.72 (2.49) (9.74) 158 40.2 0.8 N/A Salam International Investment 12.64 (2.84) (3.29) 1,445 12.8 0.9 7.2 Medicare Group 39.70 (1.00) (1.98) 1,117 24.3 1.5 2.8 Qatar Cinema & Film Distribution 58.00 4.50 (0.51) 331 17.0 2.4 2.4 Qatar Fuel 276.00 (1.18) (1.08) 14,345 12.6 2.7 2.9 Qatar Meat and Livestock 60.50 (4.42) (18.46) 1,089 12.8 4.2 5.0 Al Meera Consumer Goods 157.30 (0.44) (2.60) 1,573 15.7 5.8 4.5 Consumer Goods and Services 20,815 Qatar Industrial Manufacturing 51.00 (3.77) (3.23) 2,020 10.1 1.6 5.9 Qatar National Cement 100.60 (0.98) (1.37) 4,940 11.3 2.2 6.0 Industries Qatar 152.30 1.20 0.20 83,765 10.0 2.9 4.9 Qatari Investors Group 22.90 (2.14) (7.29) 2,847 21.6 1.4 2.2 Qatar Electricity and Water 130.50 (0.08) (2.03) 13,050 10.6 4.1 5.0 Mannai Corp. 90.50 (4.74) (5.63) 3,096 10.2 2.4 5.5 Aamal 15.15 0.26 (2.88) 8,249 15.8 1.2 N/A Gulf International Services 29.25 (0.85) (2.66) 4,349 10.5 1.7 4.0 Industrials 122,315 Qatar Insurance 67.00 0.00 (2.90) 5,976 10.9 1.7 5.0 Doha Insurance 29.70 4.95 (3.88) 695 11.3 1.5 N/A Qatar General Insurance & Reinsurance 48.00 2.35 (3.03) 2,406 15.7 0.9 2.4 Al Khaleej Takaful Insurance 44.70 1.59 (2.30) 636 9.9 1.2 6.7 Qatar Islamic Insurance 58.00 1.75 (1.36) 870 17.7 3.3 5.2 Insurance 10,583 United Development 17.10 0.12 (4.26) 5,767 1.7 0.6 N/A Barwa Real Estate 28.10 0.72 (2.43) 10,934 9.1 0.9 3.6 Ezdan Real Estate 18.45 (0.70) (2.12) 48,939 N/M 1.8 0.8 Mazaya Qatar Real Estate Development 10.55 0.38 (9.29) 1,055 23.7 1.0 N/A Real Estate 66,695 Qatar Telecom 104.20 (0.19) (1.33) 33,377 11.6 1.3 1.6 Vodafone Qatar 8.35 (3.91) (7.22) 7,059 N/M 1.1 N/A Telecoms 40,437 Qatar Navigation (Milaha) 65.00 3.17 0.93 7,444 9.7 0.7 5.4 Gulf Warehousing 40.95 (0.85) 2.38 1,623 21.4 2.4 3.7 Qatar Gas Transport (Nakilat) 15.18 (0.07) (2.00) 8,501 10.9 7.3 5.6 Transportation 17,568 Qatar Exchange 459,270 Source: Bloomberg, * Trailing Twelve Months This report is produced by QNB Group’s Economics Team in collaboration with QNB Financial Services. Past issues are available online at http://tinyurl.com/QatarMonthly. For questions, or to receive it by email each month, please contact: QNB Economics Saugata Sarkar Ahmed M. Shehada Keith Whitney QNB Group Head of Research, QNBFS Head of Trading, QNBFS Head of Sales, QNBFS Tel: (+974) 4453 4642 Tel: (+974) 4476 6534 Tel: (+974) 4476 6535 Tel: (+974) 4476 6533 economics@qnb.com.qa saugata.sarkar@qnbfs.com.qa ahmed.shehada@qnbfs.com.qa keith.whitney@qnbfs.com.qa DISCLAIMER: This publication has been prepared by Qatar National Bank (“QNB”) and QNB Financial Services SPC (“QNBFS”), a wholly-owned subsidiary. QNB is regulated by the Qatar Central Bank, QNBFS is regulated by the Qatar Financial Markets Authority and the Qatar Exchange. This publication expresses the views and opinions of QNB Group and QNBFS at a given time only. It is not an offer, promotion or recommendation to buy or sell securities or other investments, nor is it intended to constitute legal, tax, accounting, or financial advice. We therefore strongly advise potential investors to seek independent professional advice before making any investment decision. Although the information in this report has been obtained from sources that are believed to be reliable, we have not independently verified all such information and it may not be accurate or complete. While this publication has been prepared with the utmost degree of care by our analysts, no warranties are provided as to the accuracy and completeness of the information it may contain, and any liability in that respect is declined. QNB/QNBFS reserve the right to amend the views and opinions expressed in this publication at any time. They may also express viewpoints or make investment decisions that differ significantly from, or even contradict, the views and opinions included in this report. COPYRIGHT: This report is distributed on a complimentary basis to valued business partners of QNB. It may not be reproduced in whole or in part without permission.