Call Girls In Hari Nagar Dadb Block {8447779280}Hari Nagar {West Delhi Escort...
Q4 2010 Houston Office Market Research
1. Q4 2010 | OFFICE MARKET
HOUSTON OFFICE MARKET
RESEARCH & FORECAST REPORT
Houston’s Office Market Closes 2010 on a
Positive Note…For Both Landlords and Tenants
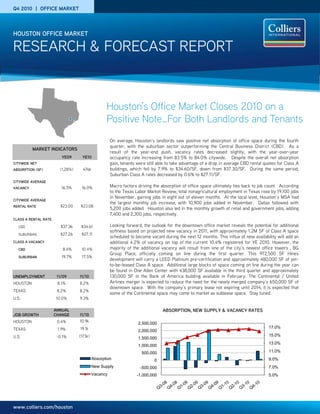
On average, Houston’s landlords saw positive net absorption of office space during the fourth
quarter, with the suburban sector outperforming the Central Business District (CBD). As a
MARKET INDICATORS
result of the year-end push, vacancy rates decreased slightly, with the year-over-year
YE09 YE10 occupancy rate increasing from 83.5% to 84.0% citywide. Despite the overall net absorption
CITYWIDE NET gain, tenants were still able to take advantage of a drop in average CBD rental quotes for Class A
ABSORPTION (SF) (1,281k) 476k buildings, which fell by 7.9% to $34.60/SF, down from $37.30/SF. During the same period,
Suburban Class A rates decreased by 0.6% to $27.11/SF.
CITYWIDE AVERAGE
VACANCY 16.5% 16.0% Macro factors driving the absorption of office space ultimately ties back to job count. According
to the Texas Labor Market Review, total nonagricultural employment in Texas rose by 19,100 jobs
in November, gaining jobs in eight out of eleven months. At the local level, Houston’s MSA had
CITYWIDE AVERAGE
the largest monthly job increase, with 10,900 jobs added in November. Dallas followed with
RENTAL RATE $23.00 $23.08
5,200 jobs added. Houston also led in the monthly growth of retail and government jobs, adding
7,400 and 2,300 jobs, respectively.
CLASS A RENTAL RATE
CBD $37.36 $34.61 Looking forward, the outlook for the downtown office market reveals the potential for additional
softness based on projected new vacancy in 2011, with approximately 1.2M SF of Class A space
SUBURBAN $27.26 $27.11
scheduled to become vacant during the next 12 months. This influx of new availability will add an
CLASS A VACANCY additional 4.2% of vacancy on top of the current 10.4% registered for YE 2010. However, the
CBD 8.4% 10.4% majority of the additional vacancy will result from one of the city’s newest office towers , BG
Group Place, officially coming on line during the first quarter. This 972,500 SF Hines
SUBURBAN 19.7% 17.5%
development will carry a LEED Platinum pre-certification and approximately 480,000 SF of yet-
to-be-leased Class A space. Additional large blocks of space coming on line during the year can
be found in One Allen Center with 438,000 SF available in the third quarter and approximately
UNEMPLOYMENT 11/09 11/10 130,000 SF in the Bank of America building available in February. The Continental / United
HOUSTON 8.1% 8.2% Airlines merger is expected to reduce the need for the newly merged company’s 650,000 SF of
downtown space. With the company’s primary lease not expiring until 2014, it is expected that
TEXAS 8.2% 8.2%
some of the Continental space may come to market as sublease space. Stay tuned.
U.S. 10.0% 9.3%
ANNUAL ABSORPTION, NEW SUPPLY & VACANCY RATES
JOB GROWTH CHANGE 11/10
HOUSTON 0.4% 10.9k
2,500,000
TEXAS 1.9% 19.1k 17.0%
2,000,000
U.S. -0.1% (173k) 1,500,000
15.0%
13.0%
1,000,000
500,000 11.0%
Absorption 0 9.0%
New Supply -500,000 7.0%
Vacancy -1,000,000 5.0%
www.colliers.com/houston
2. RESEARCH & FORECAST REPORT | Q4 2010 | HOUSTON OFFICE MARKET
VACANCY & AVAILABILITY ABSORPTION & DEMAND
CBD VS. SUBURBAN Vacancy levels were down overall for suburban Houston recorded positive net absorption of
properties and up slightly overall for CBD 618,000 SF in the fourth quarter, compared to
CLASS A OFFICE VACANCY
properties. Houston’s citywide office vacancy 46,000 SF negative net absorption at the same
20.0% for all property classes averaged 16.0% in the time last year. City-wide year-end net
18.0% fourth quarter, compared to 16.6% this time last absorption was positive 476,000 SF with
16.0% year. suburban Class A space contributing most of
14.0% that total with year-end positive net absorption
Vacancy in CBD Class A properties continued
12.0% of 748,000 SF, followed by suburban Class B
to soften reaching 10.4% compared to 8.4% a
10.0% space with positive net absorption at 191,000
year ago. CBD Class B properties posted 21.5%
8.0% SF. In contrast, CBD Class A and Class B space
vacancy, down from 22.8% 12 months earlier.
6.0% both reported negative net year-end absorption
4.0% While the overall suburban vacancy rate of 560,000 and 54,000 SF, respectively.
Q3-09Q4-09 Q1-10 Q2-10 Q3-10 Q4-10
remained in double-digits, Class A suburban
vacancy actually dropped between quarters to Prevailing economic uncertainty is likely to
CBD VACANCY SUBURBAN VACANCY 17.6% from 19.3%. By comparison, suburban continue negatively impacting CBD absorption
Class B vacancy remained unchanged at 16.3%. levels throughout 2011.
Citywide, a total of 53 office properties had a RENTAL RATES
minimum of 100,000 SF available for lease in Citywide rental rates have declined throughout
CLASS A OFFICE RENTS
both direct and sublease space—16 of those the year.
$40.00 properties have over 200,000 SF available—at
On a year-over-year basis, CBD Class A
$38.00 the end of the fourth quarter. Sublease space
average quoted rental rates dropped by 7.9% to
$36.00 totaled 4.3 million SF, including 2.0 million SF
$34.61/SF (from $37.36), while suburban Class
$34.00 of vacant space and 2.3 million SF of subleases
A rates decreased 0.6 % to $27.11/SF. CBD
$32.00 available for occupancy over the next 12
Class B rates increased by 0.2% to $23.95/SF
$30.00 months. The largest sublease space being
(from $23.91), while suburban Class B rates fell
$28.00 marketed is Devon Energy’s space, 282,000 SF
5.7% to $17.11/SF on a full-service basis. Until
$26.00 in Two Allen Center and 121,000 SF in Three
demand outpaces supply, the current tenant-
Allen Center (available for occupancy 4/2011) in
Q3-09Q4-09 Q1-10 Q2-10 Q3-10 Q4-10 friendly market is expected to continue.
the CBD. In Westchase, 3600 Briarpark has the
largest suburban contiguous block of sublease
CBD RENTS SUBURBAN RENTS
space available, 160,000 SF.
QUOTED GROSS RENTAL RATES FOR TOP PERFORMING OFFICE BUILDINGS
YEAR AVAIL.
BUILDING NAME ADDRESS SUBMARKET RBA (SF) LEASED RENT ($/SF) OWNER
BUILT SF
Wells Fargo Plaza 1000 Louisiana CBD 1,721,242 1983 94.6% 207,504 $40.45 Metropolitan Life Insurance Co.
Heritage Plaza 1111 Bagby CBD 1,149,635 1986 89.8% 223,179 $40.13 Brookfield Properties
1100 Louisiana 1100 Louisiana CBD 1,265,332 1980 99.7% 98,103 $39.74 Enterprise Products Partners
One Eldridge Place 777 N. Eldridge Pkwy. Energy Corridor 239,417 1985/2001 91.4% 35,114 $29.50 Behringer Harvard
Offices at Park 10 16290 Katy Freeway Energy Corridor 157,000 2006 97.8% 3,428 $28.00 Franklin Street Properties
Planned Community
Minute Maid Building 2150 Town Square Place E. Fort Bend 185,000 2008 76.2% 44,109 $30.00
Developers
Wells Fargo Bank Tower 1300 Post Oak Blvd. Galleria 491,254 1983 98.1% 91,226 $33.00 TIAA-CREF
Williams Tower 2800 Post Oak Blvd Galleria 1,476,973 1983 89.9% 380,024 $33.17 Hines REIT
11 Greenway Plaza 11 Greenway Greenway 745,956 1978 91.1% 99,956 $29.15 Crescent Real Estate Equities
One BriarLake Plaza 2000 W. Sam Houston Westchase 502,410 2000 97.2% 14,012 $39.73 Behringer Harvard
Waterway Square 4 Waterway Ave. Woodlands 232,364 2009 45.6% 126,408 $36.73 The Woodlands Development
Source: CoStar Property
COLLIERS INTERNATIONAL | P. 2
3. RESEARCH & FORECAST REPORT | Q4 2010 | HOUSTON OFFICE MARKET
SALES ACTIVITY new lease includes naming rights to the building, which will be ready for
Investment sales activity in the fourth quarter remained at a slow pace occupancy in February 2011. BG Group will be relocating from their
with a handful of properties changing hands. According to CoStar, there existing Galleria area space in mid to late 2011.
were 57 office sale transactions with a total dollar volume of $1.1 billion, The largest office lease renewal signed in fourth quarter was Invesco’s
averaging $169/SF with a 7.3% capitalization rate. renewal of 400,000 SF in 11 Greenway Plaza located in the Greenway
Among the most significant transactions closed in the fourth quarter submarket.
were:
Brookfield Properties acquisition of the 1.2M-square-foot Heritage Plaza
from Goddard Investment Group for $322 million ($280/SF) in the CBD
submarket, the building was completed in 1987 and at the time of sale
was 84.0% leased.
LNR Property Corporations acquisition of the 466,026 SF One Westchase
Center office building in the Westchase submarket from Walton Street
Capital for $63 million ($135/SF).
LEASING ACTIVITY
Houston’s office leasing activity reached 3.0 million SF in the fourth
quarter, compared to 3.6 million SF in the same quarter last year.
Leasing activity is still below levels prior to the economic downturn, and
an increasing number of office tenants are renewing lease commitments
with better concession packages or relocating to buildings/submarkets
offering more attractive terms.
The most significant new office lease signed in the fourth quarter in the
CBD was the British Gas lease of 354,000 SF in Hines’ new pre-certified
LEED Platinum development, BG Group Place (formally MainPlace). The
SIGNIFICANT SALES TRANSACTIONS CLOSED IN THE Q4 2010
YEAR SALE
BUILDING NAME SUBMARKET RBA (SF) BUYER SELLER $/SF CLOSED
BUILT PRICE
Heritage Plaza CBD 1,200,000 1987 Brookfield Properties Goddard Investment Group $322.0M $280 12/2010
One Westchase Center Westchase 466,026 1982 LNR Property Corp Walton Street Capital $63.0M $135 10/2010
919 Milam CBD 542,919 1956 M-M Properties PNC Bank $56.0M $103 11/2010
3900 Essex Greenway Plaza 235,620 1981 Beacon Investment Properties Fuller Realty Partners $34.0M $144 10/2010
2010 TOP OFFICE LEASES
BUILDING NAME/ADDRESS SUBMARKET SF TENANT LEASE DATE
KBR Tower & 500 Jefferson CBD 1,300,000 KBR* 02/2010
11 Greenway Plaza Greenway Plaza 400,000 Invesco* 11/2010
BG Group Place (Formerly MainPlace) CBD 354000 BG Group 10/2010 & 12/2010
2000 St. James Place West Loop/Galleria 335,000 Weatherford International 09/2010
1000 Main CBD 300,000 Shell Oil Co. 09/2010
Cullen Center CBD 291,536 KBR* 02/2010
Ten West Corporate Center II Katy Freeway 248,872 Mustang Engineering* 09/2010
Once Commerce Green Greenspoint 205,000 Nabors Corporate Services, Inc.* 08/2010
Galleria Tower II West Loop/Galleria 193,000 Southern Union 09/2010
Two Eldridge Place Katy Freeway 190,000 McDermott* 09/2010
Pinnacle Westchase Westchase 133,417 Aker Solutions 08/2010
Post Oak Central III West Loop/Galleria 130,846 SUEZ Energy* 05/2010
Wells Fargo Plaza CBD 122,896 U.S. General Services Administration 04/2010
5150 Westway Park Blvd. Northwest 92,420 CyrusOne 03/2010
Two Westlake Park Katy Freeway 92,000 BP* 09/2010
*Renewal and/or Expansion
COLLIERS INTERNATIONAL | P. 3
4. RESEARCH & FORECAST REPORT | Q4 2010 | HOUSTON OFFICE MARKET
HOUSTON OFFICE MARKET SUMMARY (CBD, SUBURBAN & CITYWIDE)
INVENTORY DIRECT VACANCY SUBLEASE VACANCY VACANCY VACANCY RATE (%) NET ABSORPTION (SF) RENTAL RATE
CLASS TOTAL (SF) (SF) RATE (%) (SF) RATE (%) TOTAL (SF) Q4-2010 Q3-2010 Q4-2010 YEAR-END AVG ($/SF)
CBD
A 26,670,173 2,190,951 8.2% 591,284 2.2% 2,782,235 10.4% 10.1% -123,616 -559,488 $34.61
B 9,426,890 1,996,855 21.2% 31,850 0.3% 2,028,705 21.5% 23.1% 6,997 -54,218 $23.95
C 1,416,525 772,229 54.5% 0 0.0% 772,229 54.5% 54.8% 9,718 20,839 $18.07
Total 37,513,588 4,960,035 13.2% 623,134 1.7% 5,583,169 14.9% 14.9% -106,901 -592,867 $30.01
SUBURBAN
A 69,047,289 11,451,671 16.6% 668,537 1.0% 12,120,308 17.6% 19.3% 664,035 748,190 $27.11
B 69,063,451 10,650,454 15.4% 624,500 0.9% 11,274,954 16.3% 16.3% 12,433 191,253 $17.71
C 19,281,248 2,137,111 11.1% 23,568 0.1% 2,160,679 11.2% 11.0% 48,296 129,203 $14.69
Total 157,391,988 24,239,236 15.4% 1,316,605 0.8% 25,555,941 16.2% 17.0% 724,764 1,068,646 $21.74
OVERALL
A 95,717,462 13,642,622 14.3% 1,259,821 1.3% 14,902,543 15.6% 16.7% 540,419 188,702 $28.63
B 78,490,341 12,647,309 16.1% 656,350 0.8% 13,303,659 16.9% 17.1% 19,430 137,035 $18.50
C 20,697,773 2,909,340 14.1% 23,568 0.1% 2,932,908 14.2% 14.0% 58,014 150,042 $15.07
Total 194,905,576 29,199,271 15.0% 1,939,739 1.0% 31,139,110 16.0% 16.6% 617,863 475,779 $23.08
HOUSTON SUBURBAN OFFICE MARKET SUMMARY
INVENTORY DIRECT VACANCY SUBLEASE VACANCY VACANCY VACANCY RATE (%) NET ABSORPTION (SF) RENTAL RATE
CLASS TOTAL (SF) (SF) RATE (%) (SF) RATE (%) TOTAL (SF) Q4-2010 Q4-2010 YTD AVG ($/SF)
ALLEN PARKWAY
A 1,217,048 211,890 17.4% 100,977 8.3% 312,867 25.7% 19,900 36,724 $26.17
B 3,082,567 219,451 7.1% 1,864 0.1% 221,315 7.2% (759) (36,961) $23.36
C 1,163,150 437,099 37.6% 0 0.0% 437,099 37.6% 2,934 15,497 $19.48
TOTAL 5,462,765 868,440 15.9% 102,841 1.9% 971,281 17.8% 22,075 15,260 $24.45
BAYTOWN
B 525,544 6,802 1.3% 0 0.0% 6,802 1.3% (2,202) (1,402) $14.46
C 60,396 2,603 4.3% 0 0.0% 2,603 4.3% 0 0 $14.62
TOTAL 585,940 9,405 1.6% 0 0.0% 9,405 1.6% (2,202) (1,402) $14.68
BELLAIRE
A 1,389,252 133,752 9.6% 8,169 0.6% 141,921 10.2% 1,137 (26,787) $22.97
B 952,823 49,499 5.2% 0 0.0% 49,499 5.2% (5,439) (59,063) $17.54
C 545,303 41,100 7.5% 0 0.0% 41,100 7.5% 6,492 (8,899) $15.07
TOTAL 2,887,378 224,351 7.8% 8,169 0.3% 232,520 8.1% 2,190 (94,749) $20.59
CONROE
A 60,000 0 0.0% 0 0.0% 0 0.0% 0 0 -
B 244,782 19,583 8.0% 0 0.0% 19,583 8.0% (2,426) 3,838 $15.30
C 302,939 0 0.0% 0 0.0% 0 0.0% 4,275 4,275 $15.00
TOTAL 607,721 19,583 3.2% 0 0.0% 19,583 3.2% 1,849 6,264 $15.25
E. FORT BEND
A 3,535,437 994,811 28.1% 11,669 0.3% 1,006,480 28.5% 42,581 (410,187) $27.49
B 1,911,468 198,611 10.4% 2,999 0.2% 201,610 10.5% 29,096 34,199 $18.93
C 142,013 3,255 2.3% 0 0.0% 3,255 2.3% (435) 4,837 $17.50
TOTAL 5,588,918 1,196,677 21.4% 14,668 0.3% 1,211,345 21.7% 71,242 (371,151) $24.43
COLLIERS INTERNATIONAL | P. 4
5. RESEARCH & FORECAST REPORT | Q4 2010 | HOUSTON OFFICE MARKET
HOUSTON SUBURBAN OFFICE MARKET SUMMARY
INVENTORY DIRECT VACANCY SUBLEASE VACANCY VACANCY VACANCY RATE (%) NET ABSORPTION (SF) RENTAL RATE
CLASS TOTAL (SF) (SF) RATE (%) (SF) RATE (%) TOTAL (SF) Q4-2010 Q4-2010 YTD AVG ($/SF)
FM 1960
A 2,272,886 886,250 39.0% 9,474 0.4% 895,824 39.4% (30,324) 3,176 $26.14
B 4,590,795 923,650 20.1% 63,522 1.4% 987,172 21.5% 25,440 65,030 $15.30
C 762,145 65,506 8.6% 2,463 0.3% 67,969 8.9% (2,728) 21,818 $14.36
TOTAL 7,625,826 1,875,506 24.6% 75,459 1.0% 1,950,965 25.6% (7,612) 90,024 $19.16
GREENWAY
A 6,167,603 907,325 14.7% 136,251 2.2% 1,043,576 16.9% 68,347 (26,009) $27.00
B 2,574,339 260,963 10.1% 1,459 0.1% 262,422 10.2% (1,305) (8,983) $21.24
C 873,877 244,814 28.0% 0 0.0% 244,814 28.0% 150 (15,065) $17.09
TOTAL 9,615,819 1,413,102 14.7% 137,710 1.4% 1,550,812 16.1% 67,192 1,961 $24.71
GULF FREEWAY/PASADENA
A 75,066 22,183 29.6% 6,273 8.4% 28,456 37.9% 1,231 1,778 $27.78
B 1,737,860 191,571 11.0% 6,870 0.4% 198,441 11.4% 10,141 12,892 $19.15
C 1,121,270 90,076 8.0% 3,590 0.3% 93,666 8.4% 10,141 17,513 $14.29
TOTAL 2,934,196 303,830 10.4% 16,733 0.6% 320,563 10.9% 43,254 53,924 $18.43
I-10 EAST
B 274,672 65,974 24.0% 9,260 3.4% 75,234 27.4% 13,157 22,500 $13.84
C 157,955 0 0.0% 6,536 4.1% 6,536 4.1% 0 (6,526) $11.17
TOTAL 432,627 65,974 15.2% 15,796 3.7% 81,770 18.9% 13,157 15,974 $13.67
KATY FREEWAY
A 11,070,152 2,336,839 21.1% 26,936 0.2% 2,363,775 21.4% 105,857 377,396 $27.95
B 6,902,590 840,476 12.2% 61,175 0.9% 901,651 13.1% (16,127) 285,099 $18.56
C 1,813,421 170,370 9.4% 1,522 0.1% 171,892 9.5% 19,578 38,054 $14.84
TOTAL 19,786,163 3,347,685 16.9% 89,633 0.5% 3,437,318 17.4% 109,308 700,549 $23.74
KINGWOOD/HUMBLE
A 158,640 25,904 16.3% 0 0.0% 25,904 16.3% 0 4,800 $29.50
B 1,798,683 185,136 10.3% 1,421 0.1% 186,557 10.4% 2,041 37,406 $20.07
C 669,712 28,852 4.3% 0 0.0% 28,852 4.3% (1,244) (594) $15.94
TOTAL 2,627,035 239,892 9.1% 1,421 0.1% 241,313 9.2% 797 41,612 $19.68
NASA/CLEAR LAKE
A 809,372 89,330 11.0% 6,214 0.8% 95,544 11.8% (7,512) (3,798) $22.65
B 3,083,055 225,108 7.3% 18,132 0.6% 243,240 7.9% (17,813) 16,089 $19.67
C 1,228,410 165,927 13.5% 0 0.0% 165,927 13.5% 16,823 10,142 $15.34
TOTAL 5,120,837 480,365 9.4% 24,346 0.5% 504,711 9.9% (8,502) 22,433 $19.15
NORTH BELT/GREENSPOINT
A 4,751,880 249,333 5.2% 62,232 1.3% 311,565 6.6% 17,567 60,735 $19.61
B 5,077,060 1,181,491 23.3% 106,781 2.1% 1,288,272 25.4% 98,613 (45,425) $15.45
C 1,323,627 227,041 17.2% 9,457 0.7% 236,498 17.9% (14,048) (43,232) $13.44
TOTAL 11,152,567 1,657,865 14.9% 178,470 1.6% 1,836,335 16.5% 102,132 (27,922) $16.04
NORTHEAST/OUTLIER
B 301,773 75,527 25.0% 0 0.0% 75,527 25.0% 0 7,616 $16.81
C 149,813 12,506 8.3% 0 0.0% 12,506 8.3% 0 (3,266) $12.00
TOTAL 451,586 88,033 19.5% 0 0.0% 88,033 19.5% 0 4,350 $15.86
COLLIERS INTERNATIONAL | P. 5
6. RESEARCH & FORECAST REPORT | Q4 2010 | HOUSTON OFFICE MARKET
HOUSTON SUBURBAN OFFICE MARKET SUMMARY
INVENTORY DIRECT VACANCY SUBLEASE VACANCY VACANCY VACANCY RATE (%) NET ABSORPTION (SF) RENTAL RATE
CLASS TOTAL (SF) (SF) RATE (%) (SF) RATE (%) TOTAL (SF) Q4-2010 Q4-2010 YTD AVG ($/SF)
NORTHWEST
A 3,724,724 1,254,663 33.7% 1,404 0.0% 1,256,067 33.7% 67,737 151,565 $25.33
B 6,702,759 1,466,035 21.9% 26,567 0.4% 1,492,602 22.3% 5,418 (59,339) $15.94
C 1,502,432 85,002 5.7% 0 0.0% 85,002 5.7% (3,844) 35,558 $12.11
TOTAL 11,929,915 2,805,700 23.5% 27,971 0.2% 2,833,671 23.8% 69,311 127,784 $19.93
NORTHWEST OUTLIER
A 89,750 0 0.0% 0 0.0% 0 0.0% 0 0 -
B 135,457 2,339 1.7% 0 0.0% 2,339 1.7% (745) 5,233 $17.00
TOTAL 225,207 2,339 1.0% 0 0.0% 2,339 1.0% (745) 5,233 $17.00
RICHMOND/FOUNTAINVIEW
B 742,993 72,737 9.8% 0 0.0% 72,737 9.8% (4,291) 2,004 $15.49
C 664,389 36,949 5.6% 0 0.0% 36,949 5.6% (7,125) 7,167 $13.36
TOTAL 1,407,382 116,811 8.3% 0 0.0% 116,811 8.3% (11,416) 9,171 $15.11
SAN FELIPE/VOSS
A 1,737,712 280,354 16.1% 2,688 0.2% 283,042 16.3% (7,423) (33,953) $29.21
B 3,271,828 302,753 9.3% 24,580 0.8% 327,333 10.0% (828) 7,469 $19.49
C 161,393 23,588 14.6% 0 0.0% 23,588 14.6% (2,185) 1,688 $17.61
TOTAL 5,170,933 606,695 11.7% 27,268 0.5% 633,963 12.3% (10,436) (28,172) $22.87
SOUTH
A 80,000 20,500 25.6% 0 0.0% 20,500 25.6% 54,000 59,500 $26.63
B 566,345 79,219 14.0% 0 0.00% 79,219 14.0% (5,403) 1,247 $19.78
C 223,029 38,920 17.50% 0 0.00% 38,920 17.50% 0 3,300 $16.70
Total 869,374 138,639 15.9% 0 0.00% 138,639 15.9% 48,597 64,047 $20.86
SOUTH MAIN/MED CENTER
A 3,916,577 301,209 7.7% 0 0.0% 301,209 7.7% 62,128 49,819 $29.13
B 3,776,316 324,283 8.6% 4,800 0.1% 329,083 8.7% 4,064 (97,223) $20.14
C 2,694,296 107,757 4.0% 0 0.0% 107,757 4.0% 5,159 20,523 $17.06
TOTAL 10,387,189 733,249 7.1% 4,800 0.0% 738,049 7.1% 71,351 (26,881) $23.45
SOUTHEAST/OUTLIER
A 159,304 0 0.0% 0 0.0% 0 0.0% 0 0 -
B 456,504 73,177 16.0% 0 0.0% 73,177 16.0% 0 (1,698) $21.68
C 22,783 12,533 55.0% 0 0.0% 12,533 55.0% 0 (12,533) $24.00
TOTAL 638,591 85,710 13.4% 0 0.0% 85,710 13.4% 0 (14,231) $21.90
SOUTHWEST
A 1,505,805 412,990 27.4% 41,486 2.8% 454,476 30.2% 12,675 (6,948) $15.05
B 6,046,811 1,386,284 22.9% 145,584 2.4% 1,531,868 25.3% (138,045) (168,462) $15.17
C 2,555,978 254,981 10.0% 0 0.0% 254,981 10.0% 4,004 16,705 $12.02
TOTAL 10,108,594 2,054,255 20.3% 187,070 1.9% 2,241,325 22.2% (121,366) (158,705) $14.78
SOUTHWEST FAR/OUTLIER
A 87,710 7,952 9.1% 0 0.0% 7,952 9.1% (5,581) 7,745 $29.69
B 616,117 76,624 12.8% 0 0.0% 76624 12.8% (1,371) 13,092 $26.75
C 128,735 0 0.0% 0 0.0% 0 0.0% 0 (3,000) -
TOTAL 832,562 86,576 10.4% 0 0.0% 86,576 10.4% (6,952) 12,256 $27.27
COLLIERS INTERNATIONAL | P. 6
7. RESEARCH & FORECAST REPORT | Q4 2010 | HOUSTON OFFICE MARKET
HOUSTON SUBURBAN OFFICE MARKET SUMMARY
INVENTORY DIRECT VACANCY SUBLEASE VACANCY VACANCY VACANCY RATE (%) NET ABSORPTION (SF) RENTAL RATE
CLASS TOTAL (SF) (SF) RATE (%) (SF) RATE (%) TOTAL (SF) Q4-2010 Q4-2010 YTD AVG ($/SF)
WEST LOOP/GALLERIA
A 16,194,891 1,551,172 9.6% 129,635 0.8% 1,680,807 10.4% 39,833 86,637 $29.06
B 5,546,693 1,275,959 23.0% 13,517 0.2% 1,289,476 23.2% (56,899) 18,710 $20.30
C 426,332 940 0.2% 0 0.0% 940 0.2% 1,504 22,454 $16.50
TOTAL 22,167,916 2,828,071 12.8% 143,152 0.6% 2,971,223 13.4% (15,562) 127,801 $26.26
WESTCHASE
A 7,794,880 1,314,104 16.9% 80,598 1.0% 1,394,702 17.9% 140,718 249,301 $29.82
B 5,141,521 744,868 14.5% 62,469 1.2% 807,337 15.7% 31,578 21,694 $18.49
C 441,936 53,425 12.1% 0 0.0% 53,425 12.1% 0 475 $15.16
TOTAL 13,378,337 2,112,397 15.8% 143,067 1.1% 2,255,464 16.9% 172,296 271,470 $25.05
THE WOODLANDS
A 2,248,600 451,110 20.1% 44,531 2.0% 495,641 22.0% 66,061 108,603 $29.48
B 3,002,096 402,334 13.4% 73,500 2.4% 475,834 15.9% 46,538 38,020 $19.32
C 145,914 33,867 23.2% 0 0.0% 33,867 23.2% 8,845 (8,790) -
TOTAL 5,396,610 887,311 16.4% 118,031 2.2% 1,005,342 18.6% 136,547 154,869 $23.86
OFFICE DEVELOPMENT PIPELINE
Houston’s development activity remained slow during the fourth quarter, with only Griffin
Partners’ four-story, 102,000 SF Nassau Bay Town Square office building being added to
3 the list of office buildings already under construction. Located in the NASA/Clear Lake
submarket, this pre-certified LEED Silver office building is scheduled to come on line 60%
pre-leased with Hamilton Sundstrand Corporation as the lead tenant. Also included in the
2.0 million SF currently under construction is Greenwood Corporation’s 156,000 SF
Chasewood Crossing II in the FM 1960-Highway 249 submarket (scheduled for completion
in April 2011).
1
2 Two CBD office projects—Hines’ 972,500-square-foot BG Group Place (formerly MainPlace,
slated for delivery by February 2011) and Trammell Crow Company’s Hess Tower (formerly
Discovery Tower, scheduled for completion by January 2011)—continue to be the sole high-
profile buildings under construction at the end of the fourth quarter. Notably, both
downtown projects began construction before the economic downturn of late 2008.
4
SELECT OFFICE BUILDINGS UNDER CONSTRUCTION
BUILDING NAME ADDRESS SUBMARKET SF LEASED DEVELOPER EST. DELIVERY
1 MainPlace 811 Main St. CBD 972,474 27.0% Hines Holdings Inc. 02/2011
2 Hess Tower 1501 McKinney St. CBD 844,763 100.0% TCC Development 01/2011
3 Chasewood Crossing II 19450 State Hwy 249 FM 1960/Hwy 249 156,000 0.0% Greenwood Corporation 04/2011
4 Nassau Bay Town Square I 18050 Saturn Ln NASA/Clear Lake 100,000 60.0% Griffin Partners Inc. 11/2011
Total SF Under Construction 2,073,237
COLLIERS INTERNATIONAL | P. 7
8. RESEARCH & FORECAST REPORT | Q4 2010 | HOUSTON OFFICE MARKET
480 offices in
61 countries on
6 continents
United States: 135
Canada: 39
Latin America: 17
Asia Pacific: 52
EMEA: 95
COLLIERS INTERNATIONAL | HOUSTON
1300 Post Oak Boulevard
Suite 200
Houston, Texas 77056
MAIN +1 713 222 2111
Accelerating success.
COLLIERS INTERNATIONAL | P. 8