SlideShare a Scribd company logo
1 of 4
Download to read offline
Q3 2011 | INDUSTRIAL


 CINCINNATI, OH

 THE KNOWLEDGE REPORT


                                                                                         Vacancy Up As Industrial Market Sees
                                                                                         More Space Hit the Market
                                                                                         As predicted three months ago, the Greater Cincinnati industrial market saw the overall vacancy rate
                                                                                         in the third quarter of 2011 rise to 9.0%. This increase was 20 basis points more than the second
                                                                                         quarter of 2011. As more industrial space came back into the market, the net absorption for the third
                                                                                         quarter totaled a negative 398,042 square feet. This increased the year-to-date negative net
                                                                                         absorption to more than 1 million square feet. Although this increase was expected, it was disappointing
MARKET INDICATORS                                                                        to see for a market that is trying to rebound from the lingering effects of the economic downturn
                                                                                         of 2008.
                                                    Q3 11             Q4 11*

                          VACANCY                                                        The overall weighted asking rate for industrial properties in the third quarter was $3.53 per square
                                                                                         foot, a relatively unchanged figure from the second quarter average of $3.54 per square foot. Flex/
   NET ABSORPTION
                                                                                         R&D space slightly increased to a rate of $6.06 per square foot, while distribution space was $2.87
        CONSTRUCTION                                 —                    —              per square foot. General industrial space was recorded at $3.70 per square foot, or a $0.09 decrease
                                                                                         from the previous quarter.
                RENTAL RATE                          —                    —
                                                                                         The two most active submarkets in the Greater Cincinnati industrial market were the Airport
                *Projected Change to Following Quarter                                   submarket and the Tri-County/Union Centre submarket. The Airport saw more than 600,000 square
                                                                                         feet of negative absorption and Tri-County/Union Centre recorded more than 600,000 square feet of
                                                                                         positive absorption. Although the negative absorption was a big hit at the Airport, it was a relief to
                                                                                         see Tri-County/Union Centre balance things out with a healthy amount of activity.

  OVERALL VACANCY RATE                                                                                  COMPLETIONS VS ABSORPTION

 9.5%
                                                                                                                                    Completions                 Absorption
                                                                                                       1,500,000
                                                                                                                                                                                                         The Cincinnati Industrial
                                                                              9.0%
 9.0%                                                                                                                                                                                                    Market’s vacancy rate
                                                                                                       1,000,000
                                                                                                                                                                                                         stands at 9.0%, year-to-date
                                                                                         Square Feet


 8.5%                                                                                                                                                                                                    net absorption totaled
                                                                                                         500,000                                                                                         (1,044,719) SF.
 8.0%
                                                                                                               0
 7.5%
        3Q 09


                  4Q 09


                            1Q 10


                                    2Q 10


                                            3Q 10


                                                      4Q 10


                                                              1Q 11


                                                                      2Q 11


                                                                                 3Q 11


                                                                                                        -500,000                                                                          (398,042) SF


                                                                                                       -1,000,000
                                                                                                                    3Q 09

                                                                                                                            4Q 09

                                                                                                                                     1Q 10

                                                                                                                                             2Q 10

                                                                                                                                                        3Q 10

                                                                                                                                                                  4Q 10

                                                                                                                                                                          1Q 11

                                                                                                                                                                                  2Q 11

                                                                                                                                                                                             3Q 11


                                                                                                                      Completions                    Absorption


www.colliers.com/cincinnati
THE KNOWLEDGE REPORT | Q3 2011 | INDUSTRIAL | CINCINNATI

                                                                                NORTHERN KENTUCKY                                               248,360 square feet of positive absorption. This
                                                                                                                                                helped to lower the overall vacancy rate for this
                                                                                In Northern Kentucky, the Airport submarket saw
                                                                                                                                                submarket by 120 basis points to 6.0%. 7575
                                                                                the biggest increase in vacancy as total net
                                                                                                                                                Empire Drive was the largest contributor to the
                                                                                absorption was negative 646,767 square feet for
                                                                                                                                                overall vacancy rate. The building is now 100%
                                                                                the third quarter. The overall vacancy rate at the
                                                                                                                                                occupied and 128,000 square feet of positive
                                                                                Airport increased by 230 basis points to 9.9%.
                                                                                                                                                absorption was recorded in the third quarter as
                                                                                Most of the negative absorption was concentrated
                                                                                                                                                a result.
                                                                                to distribution space and a small number of deals
     AVG. ASKING RATES (PER SF - NET)                                           were accountable for the increase in space given
                                                                                                                                                SUBURBAN OHIO MARKETS
                                                                                back to the market.
                                                                                                                                                On the north side of the river, the Tri-County/
$8
                                                                                1100 Burlington Pike was one of the largest loss                Union Centre submarket led the way in the third
$7
                                                                                leaders in Northern Kentucky. The former Square                 quarter of 2011. This submarket posted 616,547
$6
                                                                                D building now sits empty and 477,862 square                    square feet of positive absorption and lowered
$5
                                                                                feet of vacant space was added to our statistics.               the vacancy rate from 13.0% to 12.1%.
$4                                                                              2285 Litton Lane (182,000 square feet) became
$3                                                                              vacant and available and added to the negative                  SwimOutlet.com was one of the largest
$2                                                                              absorption total.                                               contributors to the positive news in Tri-County, as
     3Q 09


              4Q 09


                       1Q 10


                               2Q 10


                                       3Q 10


                                                4Q 10


                                                        1Q 11


                                                                2Q 11


                                                                        3Q 11


                                                                                                                                                the company signed a lease for 390,000 square
                                                                                The Florence/Walton submarket helped to offset                  feet at 4300 Port Union Road. Also in Tri-County
             General           Flex            Distribution                     some of the negative absorption by providing                    at World Park Building 31, A-T Controls signed a


 UPDATE               Recent Transactions


 LEASING ACTIVITY

 PROPERTY                                                        SUBMARKET                    TENANT                              LANDLORD                               SIZE          TYPE
 4300 Port Union Road                                            Tri-County/Union Centre      SwimOutlet.com                      DCT Port Union LLC                     390,000       Direct Lease
 Former Batavia Ford Transmission Plant                          Eastern Outlying             Global Scrap Management             IRG Batavia I LLC                      300,000       Direct Lease
 5443 Duff Drive                                                 Tri-County/Union Centre      HD Supply                           Duke Realty                            166,000       Direct Lease
 1605 Worldwide Blvd                                             Airport                      Owens & Minor Distribution          TRT-DCT LLC                            150,100       Direct Lease
 World Park Bldg 31                                              Tri-County/Union Centre      A-T Controls                        Duke Realty                            122,120       Direct Lease
 ProLogis Park Sharonville #2                                    Tri-County/Union Centre      hhGregg                             ProLogis                               100,800       Direct Lease
 910 Lila Avenue                                                 Eastern Outlying             3M                                  Naples Milfield Venture LLC            80,000        Direct Lease
 10345 S Medallion Blvd                                          Lockland/Evendale            Protective Packaging Solutions      Arka Hollywood I LLC                   69,720        Direct Lease
 Enterprise Station B                                            Florence/Walton              Magna-Tech Manufacturing            Dividend Capital Investments LLC       64,177        Direct Lease
 Mosteller Distribution Center                                   Tri-County/Union Centre      Keebler, Inc.                       Duke Realty                            63,410        Direct Lease
 6245 Creek Road                                                 Blue Ash                     CECO Environmental                  Mandceng LLC                           53,210        Direct Lease
 11725 Commons Drive                                             Tri-County/Union Centre      Full Throttle Indoor Karting, LLC   N/A                                    51,200        Direct Lease
 4170 Columbia Road                                              I-71 North                   Siemens                             Lebanon Discovery LLC                  51,200        Direct Lease
 Port Union Commerce Park Bldg 2                                 Hamilton                     Consentino                          DCT Port Union LLC                     33,600        Direct Lease
 Airpark Business Center III A                                   Airport                      Pella Windows                       Ashley/Hemmer LLC                      33,515        Direct Lease

 SALES ACTIVITY

 PROPERTY                                                        SUBMARKET                    BUYER                               SELLER                                 SIZE          SALES PRICE
 537 Grandin Road                                                I-71 North                   Hosea Project Movers                Sumco Phoenix Corp                     200,000       $825,000
 1111 Western Row Road                                           I-71 North                   Rhinestahl Corporation              Malhotra Family LLC                    120,584       $3,195,000
 3650-3680 Kemper Road                                           Tri-County/Union Centre      Slate Ridge Holdings                Triple D Ohio, LLC                     60,900        $2,150,000
 6480 Hamilton-Lebanon Road                                      Middletown                   Housatonic LLC Midwest              William R Johns & Carol M Johns        60,000        $1,750,000
 7944 Innovation Way                                             I-71 North                   Steve Ortner                        J & K Invest Ohio                      40,193        $1,800,000


Transactions are believed to be accurate but not guaranteed.


P. 2         | COLLIERS INTERNATIONAL
THE KNOWLEDGE REPORT | Q3 2011 | INDUSTRIAL | CINCINNATI


                            TOTAL         DIRECT        SUBLEASE          TOTAL        TOTAL VACANCY    PRIOR QUARTER       NET             YTD NET         AVERAGE
                          INVENTORY      VACANT SF      VACANT SF       VACANT SF          RATE         VACANCY RATE     ABOSRPTION       ABSORPTION       ASKING RATE

275 EAST CORRIDOR
Distribution                 1,382,500       670,000                0       670,000             48.5%            48.5%                0         -19,500           $2.99
Flex Space                     849,373       160,555                0       160,555             18.9%            18.9%                0         -35,883           $6.74
General                      5,691,129       135,500                0       135,500              2.4%             2.4%                0          25,989           $3.00
TOTAL                        7,923,002       966,055                0       966,055             12.2%            12.2%                0         -29,394           $3.52

AIRPORT
Distribution                19,478,687      2,005,305       182,000        2,187,305            11.2%             7.9%        -676,965          -61,795           $3.12
Flex Space                   2,513,805        379,868        49,400          429,268            17.1%            16.4%          30,198           17,799           $4.78
General                      5,886,254        151,200             0          151,200             2.6%             3.8%               0          250,070           $2.92
TOTAL                       27,878,746      2,536,373       231,400        2,767,773             9.9%             7.6%        -646,767          206,074           $3.35

BLUE ASH
Distribution                 2,069,634        198,320             0          198,320             9.6%             9.6%               0         -195,215           $2.31
Flex Space                   2,047,353        339,737        16,500          356,237            17.4%            17.8%           7,790            4,459           $7.38
General                      9,795,083        925,665             0          925,665             9.5%             6.5%        -285,115         -370,323           $3.79
TOTAL                       13,912,070      1,463,722        16,500        1,480,222            10.6%             8.6%        -277,325         -561,079           $4.75

CAMPBELL COUNTY
Distribution                   318,940             0                0             0             0.0%              0.0%                0                0
Flex Space                      20,000             0                0             0             0.0%              0.0%                0                0
General                      3,854,790        16,000                0        16,000             0.4%              0.4%                0                0
TOTAL                        4,193,730        16,000                0        16,000             0.4%              0.4%                0                0

CENTRAL/MIDTOWN
Distribution                 1,324,774        297,726               0        297,726            22.5%            27.3%         63,736           138,736           $2.02
Flex Space                   1,543,719         85,536               0         85,536             5.5%             5.5%              0            43,555           $8.77
General                     52,361,383      3,140,483               0      3,140,483             6.0%             6.1%         41,000          -891,663           $3.68
TOTAL                       55,229,876      3,523,745               0      3,523,745             6.4%             6.6%        104,736          -709,372           $3.58

COVINGTON
Distribution                   776,600             0              0               0             0.0%              0.0%               0                0
Flex Space                      40,000             0              0               0             0.0%              0.0%               0                0
General                      4,085,849       198,000         36,000         234,000             5.7%              3.0%        -112,000          -99,000           $3.75
TOTAL                        4,902,449       198,000         36,000         234,000             4.8%              2.5%        -112,000          -99,000           $3.75

EASTERN OUTLYING
Distribution                   107,520       107,520                0       107,520            100.0%           100.0%               0          -27,520           $4.25
Flex Space                     280,809       110,300                0       110,300             39.3%            39.3%               0                0           $5.96
General                      3,593,638       666,585                0       666,585             18.5%            18.0%         -20,279         -116,404           $4.69
TOTAL                        3,981,967       884,405                0       884,405             22.2%             0.0%         -20,279         -143,924           $4.81

FLORENCE/WALTON
Distribution                 9,262,785        550,803        63,520          614,323             6.6%             9.2%        237,960             3,024           $2.76
Flex Space                     696,431        146,955             0          146,955            21.1%            22.8%         11,496            64,389           $4.61
General                     10,754,228        323,336       165,000          488,336             4.5%             4.5%         -1,096           -58,656           $3.45
TOTAL                       20,713,444      1,021,094       228,520        1,249,614             6.0%             7.2%        248,360             8,757           $3.23

HAMILTON
Distribution                   335,000         7,200                0         7,200             2.1%              2.1%                0               0
General                      6,986,859       256,500                0       256,500             3.7%              3.7%                0         116,000           $4.03
TOTAL                        7,321,859       263,700                0       263,700             3.6%              3.6%                0         116,000           $4.03

I-71 NORTH CORRIDOR
Distribution                 1,939,653        483,614               0        483,614            24.9%            24.9%               0         -145,491           $3.50
Flex Space                     530,805        104,874               0        104,874            19.8%            15.4%         -26,038           53,755           $5.93
General                      7,611,592        960,057               0        960,057            12.6%            12.3%         -27,500          -54,840           $3.70
TOTAL                       10,082,050      1,548,545               0      1,548,545            15.4%            14.9%         -53,538         -146,576           $3.78

LOCKLAND/EVENDALE
Distribution                   521,960        68,000                0        68,000             13.0%            13.0%               0          -68,000           $1.88
Flex Space                     780,821       108,055                0       108,055             13.8%            14.1%           2,270           45,050           $6.23
General                     17,897,280       580,608                0       580,608              3.2%             1.7%        -283,046         -162,839           $3.70
TOTAL                       19,200,061       756,663                0       756,663              3.9%             2.5%        -280,776         -185,789           $3.86

MONROE/MIDDLETOWN
Distribution                 7,498,392        893,140               0        893,140            11.9%            11.9%              0           135,000           $3.12
Flex Space                     129,500         40,120               0         40,120            31.0%            31.0%              0                 0           $5.00
General                      3,498,501         91,500               0         91,500             2.6%             3.3%         23,000            94,500           $3.57
TOTAL                       11,126,393      1,024,760               0      1,024,760             9.2%             9.4%         23,000           229,500           $3.24

OUTSIDE METRO AREA
Distribution                  275,000              0                0             0              0.0%             0.0%                0                0
General                        40,000         40,000                0        40,000            100.0%           100.0%                0                0          $4.50
TOTAL                         315,000         40,000                0        40,000             12.7%           100.0%                0                0          $4.50

TRI-COUNTY/UNION CENTRE
Distribution                23,216,789      4,606,467       435,150        5,041,617            21.7%            22.7%        234,815           156,769           $2.74
Flex Space                   5,130,977      1,016,085        13,030        1,029,115            20.1%            21.9%         91,093           -91,474           $6.21
General                     36,459,352      1,746,709        26,000        1,772,709             4.9%             5.6%        290,639           364,789           $3.71
TOTAL                       64,807,118      7,369,261       474,180        7,843,441            12.1%            13.0%        616,547           430,084           $3.35

WESTERN OUTLYING
Flex Space                     218,000             0                0             0              0.0%             0.0%                0               0
General                      6,215,297       619,209                0       619,209             10.0%            10.0%                0        -160,000           $2.94
TOTAL                        6,433,297       619,209                0       619,209              9.6%             9.6%                0        -160,000           $2.94

MARKET TOTALS
Distribution                68,508,234      9,888,095       680,670       10,568,765            15.4%            15.3%        -140,454           -83,992          $2.87
Flex Space                  14,781,593      2,492,085        78,930        2,571,015            17.4%            17.9%         116,809           101,650          $6.06
General                    174,691,235      9,811,352       227,000       10,038,352             5.7%             5.7%        -374,397        -1,062,377          $3.70

TOTAL                      257,981,062     22,191,532       986,600       23,178,132             9.0%             8.8%        -398,042        -1,044,719          $3.53


                                                                                                                                      COLLIERS INTERNATIONAL |            P. 3
THE KNOWLEDGE REPORT | Q3 2011 | INDUSTRIAL | CINCINNATI

lease for 122,120      square    feet     with    Duke   foot facility in Roselawn and Z.F. Steering Systems
Realty Group.                                            has two buildings under construction in Florence.
                                                                                                                 512 offices in
In the Eastern Outlying submarket, a market that         Speculative construction of industrial space is not     61 countries on
has not seen much activity recently, Global Scrap        anticipated anytime soon, but build-to-suit projects
Management signed a 300,000 square foot lease            like mentioned above will continue to flourish as       6 continents
at the former Batavia Ford transmission plant. This      the economy improves.
                                                                                                                 United States: 125
transaction was welcome news to the eastside of                                                                  Canada: 38
Cincinnati, as it has not seen a deal of this            FORECAST                                                Latin America: 18
magnitude in quite some time.                                                                                    Asia Pacific: 214
                                                         As 2011 comes to an end, the last quarter should        EMEA: 117
On the negative side, one of the largest hits to the     not provide much variation compared to what we          •   $1.5 billion in annual revenue
market was 8701 LeSaint Drive. The building now          have witnessed in the first part of the year. We        • 979 million square feet under
sits vacant and has added 345,600 square feet of         hope to see some positive net absorption, but this          management
space to the market from BAE. Graphic Packaging          will not offset the 1 million square feet of negative   • Over 12,000 professionals
International also vacated 10600 Evendale Drive,         absorption in the first three quarters of the year.
and added 240,000 square feet to the market.             Looking ahead to 2012, there is a slight concern
                                                         with the Tri-County/Union Centre submarket, as          INDUSTRIAL TEAM:
                                                         more than 1 million square feet have already            Chuck A. Ackerman, CCIM, SIOR
CONSTRUCTION                                                                                                     +1 513 562 2266
                                                         surfaced and will become vacant next year. This
Several projects continue to move forward towards        includes Avon Products on Progress Place, CEVA          Erin M. Casey, GA-C, MCRE
completion. USUI International is still on track to      Logistics on Windisch Road and the Liz Claiborne        +1 513 562 2225
finish their 127,000 square foot facility in             Facility on Jacquemin Drive. We hope other
Sharonville. Links Unlimited is working on a                                                                     Michael E. Daly, SIOR
                                                         submarkets, including the Airport, can help pull        +1 513 562 2206
60,000 square foot facility in Norwood. Eurostampa       their weight and balance out our overall market to
is in the process of completing a 75,000 square          end the year on a good note.
                                                                                                                 John B. Gartner, III, SIOR
                                                                                                                 +1 513 562 2207

 INDUSTRIAL SUBMARKETS                                                                                           William K. Keefer, SIOR
                                                                                                                 +1 513 562 2235

                                                          MONROE/                                                Steven R. Miller
                                          HAMILTON       MIDDLETOWN                                              +1 513 562 2252


                                                   TRI-COUNTY/                                                   CEO/PRINCIPAL | CINCINNATI:
                                                  UNION CENTRE I-71 CORRIDOR                                     Shenan P. Murphy, CCIM
                                                                                                                 +1 513 721 4200

                                                           BLUE                                                  DIRECTOR OF RESEARCH:
                                                 LOCKLAND/ ASH                                                   Brian T. Graham, CCIM
                                                 EVENDALE                                                        +1 513 562 2214

                                                                                                                 GRAPHIC DESIGNER:
                                                                             I-275 EAST
                                                                             CORRIDOR                            Ricky R. Dennis
                                          CENTRAL/                                                               +1 513 562 2213
                                          MIDTOWN

                                                                                                                 Colliers International | Greater Cincinnati
                                INT’L
                                                                                                                 425 Walnut Street, Suite 1200
                                AIRPORT                                                                          Cincinnati, OH 45202
                                          COVINGTON
                                                                                                                                          Colliers International
                   AIRPORT                                                                                                                statistics are audited
                                                                                                                                          annually and may result in
                                                                                                                                          revisions to previously
                           FLORENCE/WALTON                   CAMPBELL                                                                     reported quarterly and

                               CORRIDOR                       COUNTY                                                                      final year-end figures


                                                                                                                          Accelerating success.


www.colliers.com/cincinnati

More Related Content

What's hot

Airport Road Land Use Concept Plan | Amman Institute
Airport Road Land Use Concept Plan | Amman InstituteAirport Road Land Use Concept Plan | Amman Institute
Airport Road Land Use Concept Plan | Amman InstituteAmman Institute
 
Interim Rural Residential policy | Amman Institute
Interim Rural Residential policy | Amman Institute Interim Rural Residential policy | Amman Institute
Interim Rural Residential policy | Amman Institute Amman Institute
 
Q12011 Columbus Retail Market Report
Q12011 Columbus Retail Market ReportQ12011 Columbus Retail Market Report
Q12011 Columbus Retail Market Reportcolliersohio
 
Colliers International: Retail Highlights Fall 2010
Colliers International: Retail Highlights Fall 2010Colliers International: Retail Highlights Fall 2010
Colliers International: Retail Highlights Fall 2010Coy Davidson
 
Q4 2011 - Columbus Retail
Q4 2011 - Columbus RetailQ4 2011 - Columbus Retail
Q4 2011 - Columbus Retailcolliersohio
 

What's hot (7)

Airport Road Land Use Concept Plan | Amman Institute
Airport Road Land Use Concept Plan | Amman InstituteAirport Road Land Use Concept Plan | Amman Institute
Airport Road Land Use Concept Plan | Amman Institute
 
Interim Rural Residential policy | Amman Institute
Interim Rural Residential policy | Amman Institute Interim Rural Residential policy | Amman Institute
Interim Rural Residential policy | Amman Institute
 
Office q4 2011
Office q4 2011Office q4 2011
Office q4 2011
 
Q12011 Columbus Retail Market Report
Q12011 Columbus Retail Market ReportQ12011 Columbus Retail Market Report
Q12011 Columbus Retail Market Report
 
Colliers International: Retail Highlights Fall 2010
Colliers International: Retail Highlights Fall 2010Colliers International: Retail Highlights Fall 2010
Colliers International: Retail Highlights Fall 2010
 
Q4 2011 - Columbus Retail
Q4 2011 - Columbus RetailQ4 2011 - Columbus Retail
Q4 2011 - Columbus Retail
 
March Member Meeting -- Voices Matter: Economic Development & Land Use
March Member Meeting -- Voices Matter: Economic Development & Land UseMarch Member Meeting -- Voices Matter: Economic Development & Land Use
March Member Meeting -- Voices Matter: Economic Development & Land Use
 

Viewers also liked

Q1 2013 Columbus Market Trends Retail
Q1 2013 Columbus Market Trends RetailQ1 2013 Columbus Market Trends Retail
Q1 2013 Columbus Market Trends Retailcolliersohio
 
Q4 2012 Cincinnati Market Trends Industrial
Q4 2012 Cincinnati Market Trends IndustrialQ4 2012 Cincinnati Market Trends Industrial
Q4 2012 Cincinnati Market Trends Industrialcolliersohio
 
Q42012 Cincinnati Market Tr
Q42012 Cincinnati Market TrQ42012 Cincinnati Market Tr
Q42012 Cincinnati Market Trcolliersohio
 
Q4 2012 Columbus Market Trends Office
Q4 2012 Columbus Market Trends OfficeQ4 2012 Columbus Market Trends Office
Q4 2012 Columbus Market Trends Officecolliersohio
 
Q22012 Columbus Industrial Market Trends
Q22012 Columbus Industrial Market TrendsQ22012 Columbus Industrial Market Trends
Q22012 Columbus Industrial Market Trendscolliersohio
 
Q1 2013 Columbus Market Trends Office
Q1 2013 Columbus Market Trends OfficeQ1 2013 Columbus Market Trends Office
Q1 2013 Columbus Market Trends Officecolliersohio
 
Q4 2012 Columbus Retail Market Trends
Q4 2012 Columbus Retail Market TrendsQ4 2012 Columbus Retail Market Trends
Q4 2012 Columbus Retail Market Trendscolliersohio
 
Q2 2012 Columbus Office Market Trends
Q2 2012 Columbus Office Market TrendsQ2 2012 Columbus Office Market Trends
Q2 2012 Columbus Office Market Trendscolliersohio
 

Viewers also liked (11)

Q1 2013 Columbus Market Trends Retail
Q1 2013 Columbus Market Trends RetailQ1 2013 Columbus Market Trends Retail
Q1 2013 Columbus Market Trends Retail
 
Punchparty分享會
Punchparty分享會Punchparty分享會
Punchparty分享會
 
Q4 2012 Cincinnati Market Trends Industrial
Q4 2012 Cincinnati Market Trends IndustrialQ4 2012 Cincinnati Market Trends Industrial
Q4 2012 Cincinnati Market Trends Industrial
 
Q42012 Cincinnati Market Tr
Q42012 Cincinnati Market TrQ42012 Cincinnati Market Tr
Q42012 Cincinnati Market Tr
 
Q4 2012 Columbus Market Trends Office
Q4 2012 Columbus Market Trends OfficeQ4 2012 Columbus Market Trends Office
Q4 2012 Columbus Market Trends Office
 
Q42012 cColumb
Q42012 cColumbQ42012 cColumb
Q42012 cColumb
 
Q22012 Columbus Industrial Market Trends
Q22012 Columbus Industrial Market TrendsQ22012 Columbus Industrial Market Trends
Q22012 Columbus Industrial Market Trends
 
Q1 2013 Columbus Market Trends Office
Q1 2013 Columbus Market Trends OfficeQ1 2013 Columbus Market Trends Office
Q1 2013 Columbus Market Trends Office
 
Q4 2012 Cincinna
Q4 2012 CincinnaQ4 2012 Cincinna
Q4 2012 Cincinna
 
Q4 2012 Columbus Retail Market Trends
Q4 2012 Columbus Retail Market TrendsQ4 2012 Columbus Retail Market Trends
Q4 2012 Columbus Retail Market Trends
 
Q2 2012 Columbus Office Market Trends
Q2 2012 Columbus Office Market TrendsQ2 2012 Columbus Office Market Trends
Q2 2012 Columbus Office Market Trends
 

Similar to Cincinnati Industrial Market Vacancy Rises to 9.0

North American Industrial Highlights 4Q 2010
North American Industrial Highlights 4Q 2010North American Industrial Highlights 4Q 2010
North American Industrial Highlights 4Q 2010Coy Davidson
 
Houston Industrial Market Report 1Q 2011
Houston Industrial Market Report 1Q 2011Houston Industrial Market Report 1Q 2011
Houston Industrial Market Report 1Q 2011Coy Davidson
 
Industrial re a4 2010
Industrial re a4 2010Industrial re a4 2010
Industrial re a4 2010Translinked
 
Q4 2011 - Cincinnati Industrial
Q4 2011 - Cincinnati IndustrialQ4 2011 - Cincinnati Industrial
Q4 2011 - Cincinnati Industrialcolliersohio
 
Q2 2011 Houston Office Market Report
Q2 2011 Houston Office Market ReportQ2 2011 Houston Office Market Report
Q2 2011 Houston Office Market ReportCoy Davidson
 
Q4 2011 Houston Industrial Market Report
Q4 2011 Houston Industrial Market ReportQ4 2011 Houston Industrial Market Report
Q4 2011 Houston Industrial Market ReportCoy Davidson
 
US Industrial Highlights Q3 2011
US Industrial Highlights Q3 2011US Industrial Highlights Q3 2011
US Industrial Highlights Q3 2011colliersohio
 
Q4 2010 Houston Office Market Research
Q4 2010 Houston Office Market ResearchQ4 2010 Houston Office Market Research
Q4 2010 Houston Office Market ResearchCoy Davidson
 
Industrial q4 2011
Industrial q4 2011Industrial q4 2011
Industrial q4 2011Translinked
 
Cincinnati OH Office Trends Q3 2011
Cincinnati OH Office Trends Q3 2011Cincinnati OH Office Trends Q3 2011
Cincinnati OH Office Trends Q3 2011colliersohio
 
Q2 2011 Houston Industrial Market Report
Q2 2011 Houston Industrial Market ReportQ2 2011 Houston Industrial Market Report
Q2 2011 Houston Industrial Market ReportCoy Davidson
 
Houston Office Market Report 1Q-2011
Houston Office Market Report 1Q-2011Houston Office Market Report 1Q-2011
Houston Office Market Report 1Q-2011Coy Davidson
 
Office real estate a4 2010
Office real estate a4 2010Office real estate a4 2010
Office real estate a4 2010Translinked
 
Industrial & distribution floorspace today
Industrial & distribution floorspace todayIndustrial & distribution floorspace today
Industrial & distribution floorspace todayColin Harrop
 
Columbus OH Retail Trends Q3 2011
Columbus OH Retail Trends Q3 2011Columbus OH Retail Trends Q3 2011
Columbus OH Retail Trends Q3 2011colliersohio
 
Cincinnati OH Retail Trends Q3 2011
Cincinnati OH Retail Trends Q3 2011Cincinnati OH Retail Trends Q3 2011
Cincinnati OH Retail Trends Q3 2011colliersohio
 
Suburban Maryland 3Q12 Office Snapshot
Suburban Maryland 3Q12 Office SnapshotSuburban Maryland 3Q12 Office Snapshot
Suburban Maryland 3Q12 Office Snapshotkottmeier
 
FHO Partners 4Q 2010 Market Report
FHO Partners 4Q 2010 Market ReportFHO Partners 4Q 2010 Market Report
FHO Partners 4Q 2010 Market Reportfhopartners
 
Q4 2011 - Cincinnati Office
Q4 2011 - Cincinnati OfficeQ4 2011 - Cincinnati Office
Q4 2011 - Cincinnati Officecolliersohio
 
Tampa Bay Office Market Report - Q3 2011
Tampa Bay Office Market Report - Q3 2011Tampa Bay Office Market Report - Q3 2011
Tampa Bay Office Market Report - Q3 2011Jeff Tolrud
 

Similar to Cincinnati Industrial Market Vacancy Rises to 9.0 (20)

North American Industrial Highlights 4Q 2010
North American Industrial Highlights 4Q 2010North American Industrial Highlights 4Q 2010
North American Industrial Highlights 4Q 2010
 
Houston Industrial Market Report 1Q 2011
Houston Industrial Market Report 1Q 2011Houston Industrial Market Report 1Q 2011
Houston Industrial Market Report 1Q 2011
 
Industrial re a4 2010
Industrial re a4 2010Industrial re a4 2010
Industrial re a4 2010
 
Q4 2011 - Cincinnati Industrial
Q4 2011 - Cincinnati IndustrialQ4 2011 - Cincinnati Industrial
Q4 2011 - Cincinnati Industrial
 
Q2 2011 Houston Office Market Report
Q2 2011 Houston Office Market ReportQ2 2011 Houston Office Market Report
Q2 2011 Houston Office Market Report
 
Q4 2011 Houston Industrial Market Report
Q4 2011 Houston Industrial Market ReportQ4 2011 Houston Industrial Market Report
Q4 2011 Houston Industrial Market Report
 
US Industrial Highlights Q3 2011
US Industrial Highlights Q3 2011US Industrial Highlights Q3 2011
US Industrial Highlights Q3 2011
 
Q4 2010 Houston Office Market Research
Q4 2010 Houston Office Market ResearchQ4 2010 Houston Office Market Research
Q4 2010 Houston Office Market Research
 
Industrial q4 2011
Industrial q4 2011Industrial q4 2011
Industrial q4 2011
 
Cincinnati OH Office Trends Q3 2011
Cincinnati OH Office Trends Q3 2011Cincinnati OH Office Trends Q3 2011
Cincinnati OH Office Trends Q3 2011
 
Q2 2011 Houston Industrial Market Report
Q2 2011 Houston Industrial Market ReportQ2 2011 Houston Industrial Market Report
Q2 2011 Houston Industrial Market Report
 
Houston Office Market Report 1Q-2011
Houston Office Market Report 1Q-2011Houston Office Market Report 1Q-2011
Houston Office Market Report 1Q-2011
 
Office real estate a4 2010
Office real estate a4 2010Office real estate a4 2010
Office real estate a4 2010
 
Industrial & distribution floorspace today
Industrial & distribution floorspace todayIndustrial & distribution floorspace today
Industrial & distribution floorspace today
 
Columbus OH Retail Trends Q3 2011
Columbus OH Retail Trends Q3 2011Columbus OH Retail Trends Q3 2011
Columbus OH Retail Trends Q3 2011
 
Cincinnati OH Retail Trends Q3 2011
Cincinnati OH Retail Trends Q3 2011Cincinnati OH Retail Trends Q3 2011
Cincinnati OH Retail Trends Q3 2011
 
Suburban Maryland 3Q12 Office Snapshot
Suburban Maryland 3Q12 Office SnapshotSuburban Maryland 3Q12 Office Snapshot
Suburban Maryland 3Q12 Office Snapshot
 
FHO Partners 4Q 2010 Market Report
FHO Partners 4Q 2010 Market ReportFHO Partners 4Q 2010 Market Report
FHO Partners 4Q 2010 Market Report
 
Q4 2011 - Cincinnati Office
Q4 2011 - Cincinnati OfficeQ4 2011 - Cincinnati Office
Q4 2011 - Cincinnati Office
 
Tampa Bay Office Market Report - Q3 2011
Tampa Bay Office Market Report - Q3 2011Tampa Bay Office Market Report - Q3 2011
Tampa Bay Office Market Report - Q3 2011
 

More from colliersohio

Q4 2011 - Columbus Office
Q4 2011 - Columbus OfficeQ4 2011 - Columbus Office
Q4 2011 - Columbus Officecolliersohio
 
Q4 2011 - Columbus Industrial
Q4 2011 - Columbus IndustrialQ4 2011 - Columbus Industrial
Q4 2011 - Columbus Industrialcolliersohio
 
Q1 2012 - Columbus Retail
Q1 2012 - Columbus RetailQ1 2012 - Columbus Retail
Q1 2012 - Columbus Retailcolliersohio
 
Q1 2012 - Columbus Industrial
Q1 2012 - Columbus IndustrialQ1 2012 - Columbus Industrial
Q1 2012 - Columbus Industrialcolliersohio
 
Columbus Knowledge thats Sells March 2012
Columbus Knowledge thats Sells March 2012 Columbus Knowledge thats Sells March 2012
Columbus Knowledge thats Sells March 2012 colliersohio
 
Columbus Knowledge thats Sells January 2012
Columbus Knowledge thats Sells January 2012Columbus Knowledge thats Sells January 2012
Columbus Knowledge thats Sells January 2012colliersohio
 
Q1 2012 - Columbus Office
Q1 2012 - Columbus OfficeQ1 2012 - Columbus Office
Q1 2012 - Columbus Officecolliersohio
 
Q4 2011 - Cincinnati Retail
Q4 2011 - Cincinnati RetailQ4 2011 - Cincinnati Retail
Q4 2011 - Cincinnati Retailcolliersohio
 
Q1 2012 - Cincinnati Office
Q1 2012 - Cincinnati OfficeQ1 2012 - Cincinnati Office
Q1 2012 - Cincinnati Officecolliersohio
 
Q1 2012 - Cincinnati Industrial
Q1 2012 - Cincinnati IndustrialQ1 2012 - Cincinnati Industrial
Q1 2012 - Cincinnati Industrialcolliersohio
 
Knowledge that Sells March 2012
Knowledge that Sells March 2012Knowledge that Sells March 2012
Knowledge that Sells March 2012colliersohio
 
Knowledge that Sells January 2012
Knowledge that Sells January 2012Knowledge that Sells January 2012
Knowledge that Sells January 2012colliersohio
 
Knowledge thats Sells February 2012
Knowledge thats Sells February 2012Knowledge thats Sells February 2012
Knowledge thats Sells February 2012colliersohio
 
Knowledge That Sells April 2012
Knowledge That Sells April 2012Knowledge That Sells April 2012
Knowledge That Sells April 2012colliersohio
 
December 2011 Retail Sales
December 2011 Retail SalesDecember 2011 Retail Sales
December 2011 Retail Salescolliersohio
 
US Office HIghlights Q3 2011
US Office HIghlights Q3 2011US Office HIghlights Q3 2011
US Office HIghlights Q3 2011colliersohio
 

More from colliersohio (16)

Q4 2011 - Columbus Office
Q4 2011 - Columbus OfficeQ4 2011 - Columbus Office
Q4 2011 - Columbus Office
 
Q4 2011 - Columbus Industrial
Q4 2011 - Columbus IndustrialQ4 2011 - Columbus Industrial
Q4 2011 - Columbus Industrial
 
Q1 2012 - Columbus Retail
Q1 2012 - Columbus RetailQ1 2012 - Columbus Retail
Q1 2012 - Columbus Retail
 
Q1 2012 - Columbus Industrial
Q1 2012 - Columbus IndustrialQ1 2012 - Columbus Industrial
Q1 2012 - Columbus Industrial
 
Columbus Knowledge thats Sells March 2012
Columbus Knowledge thats Sells March 2012 Columbus Knowledge thats Sells March 2012
Columbus Knowledge thats Sells March 2012
 
Columbus Knowledge thats Sells January 2012
Columbus Knowledge thats Sells January 2012Columbus Knowledge thats Sells January 2012
Columbus Knowledge thats Sells January 2012
 
Q1 2012 - Columbus Office
Q1 2012 - Columbus OfficeQ1 2012 - Columbus Office
Q1 2012 - Columbus Office
 
Q4 2011 - Cincinnati Retail
Q4 2011 - Cincinnati RetailQ4 2011 - Cincinnati Retail
Q4 2011 - Cincinnati Retail
 
Q1 2012 - Cincinnati Office
Q1 2012 - Cincinnati OfficeQ1 2012 - Cincinnati Office
Q1 2012 - Cincinnati Office
 
Q1 2012 - Cincinnati Industrial
Q1 2012 - Cincinnati IndustrialQ1 2012 - Cincinnati Industrial
Q1 2012 - Cincinnati Industrial
 
Knowledge that Sells March 2012
Knowledge that Sells March 2012Knowledge that Sells March 2012
Knowledge that Sells March 2012
 
Knowledge that Sells January 2012
Knowledge that Sells January 2012Knowledge that Sells January 2012
Knowledge that Sells January 2012
 
Knowledge thats Sells February 2012
Knowledge thats Sells February 2012Knowledge thats Sells February 2012
Knowledge thats Sells February 2012
 
Knowledge That Sells April 2012
Knowledge That Sells April 2012Knowledge That Sells April 2012
Knowledge That Sells April 2012
 
December 2011 Retail Sales
December 2011 Retail SalesDecember 2011 Retail Sales
December 2011 Retail Sales
 
US Office HIghlights Q3 2011
US Office HIghlights Q3 2011US Office HIghlights Q3 2011
US Office HIghlights Q3 2011
 

Recently uploaded

9990771857 Call Girls in Noida Sector 03 Noida (Call Girls) Delhi
9990771857 Call Girls in Noida Sector 03 Noida (Call Girls) Delhi9990771857 Call Girls in Noida Sector 03 Noida (Call Girls) Delhi
9990771857 Call Girls in Noida Sector 03 Noida (Call Girls) Delhidelhimodel235
 
Low Rate Call Girls in Akshardham Delhi Call 9990771857
Low Rate Call Girls in Akshardham   Delhi Call 9990771857Low Rate Call Girls in Akshardham   Delhi Call 9990771857
Low Rate Call Girls in Akshardham Delhi Call 9990771857delhimodel235
 
How to Build Multifamily and Laneway Suites in Toronto!! (feat. Expert Archi...
How to Build Multifamily and Laneway Suites  in Toronto!! (feat. Expert Archi...How to Build Multifamily and Laneway Suites  in Toronto!! (feat. Expert Archi...
How to Build Multifamily and Laneway Suites in Toronto!! (feat. Expert Archi...Volition Properties
 
The Omaxe State Dwarka Delhi-broucher.pdf.pdf
The Omaxe State Dwarka Delhi-broucher.pdf.pdfThe Omaxe State Dwarka Delhi-broucher.pdf.pdf
The Omaxe State Dwarka Delhi-broucher.pdf.pdfkratirudram
 
9990771857 Call Girls in Noida Sector 10 Noida (Call Girls) Delhi
9990771857 Call Girls in Noida Sector 10 Noida (Call Girls) Delhi9990771857 Call Girls in Noida Sector 10 Noida (Call Girls) Delhi
9990771857 Call Girls in Noida Sector 10 Noida (Call Girls) Delhidelhimodel235
 
Omaxe Dwarka In Delhi E Brochure Pdf
Omaxe Dwarka In Delhi E Brochure     PdfOmaxe Dwarka In Delhi E Brochure     Pdf
Omaxe Dwarka In Delhi E Brochure Pdfashiyadav24
 
Building Dreams: Newman Leech's Visionary Approach to Real Estate Investment
Building Dreams: Newman Leech's Visionary Approach to Real Estate InvestmentBuilding Dreams: Newman Leech's Visionary Approach to Real Estate Investment
Building Dreams: Newman Leech's Visionary Approach to Real Estate InvestmentNewman George Leech
 
Rustomjee The Panorama At Pali Hill, Bandra West, Mumbai - Brochure.pdf
Rustomjee The Panorama At Pali Hill, Bandra West, Mumbai - Brochure.pdfRustomjee The Panorama At Pali Hill, Bandra West, Mumbai - Brochure.pdf
Rustomjee The Panorama At Pali Hill, Bandra West, Mumbai - Brochure.pdfmonikasharma630
 
Call Girls In The Lalit New Delhi ❤️8860477959 Good Looking Escorts In 24/7 D...
Call Girls In The Lalit New Delhi ❤️8860477959 Good Looking Escorts In 24/7 D...Call Girls In The Lalit New Delhi ❤️8860477959 Good Looking Escorts In 24/7 D...
Call Girls In The Lalit New Delhi ❤️8860477959 Good Looking Escorts In 24/7 D...lizamodels9
 
Purva Palm Hills Devanahalli, Bangalore E- Brochure.pdf
Purva Palm Hills Devanahalli, Bangalore E- Brochure.pdfPurva Palm Hills Devanahalli, Bangalore E- Brochure.pdf
Purva Palm Hills Devanahalli, Bangalore E- Brochure.pdffaheemali990101
 
Call Girls in Nehru Place Delhi 💯Call Us 🔝8264348440🔝
Call Girls in Nehru Place Delhi 💯Call Us 🔝8264348440🔝Call Girls in Nehru Place Delhi 💯Call Us 🔝8264348440🔝
Call Girls in Nehru Place Delhi 💯Call Us 🔝8264348440🔝soniya singh
 
Call Girls in Kashmiri Gate Delhi 💯Call Us 🔝8264348440🔝
Call Girls in Kashmiri Gate Delhi 💯Call Us 🔝8264348440🔝Call Girls in Kashmiri Gate Delhi 💯Call Us 🔝8264348440🔝
Call Girls in Kashmiri Gate Delhi 💯Call Us 🔝8264348440🔝soniya singh
 
Eco-Efficient Living: Redefining Sustainability through Leech's Green Design ...
Eco-Efficient Living: Redefining Sustainability through Leech's Green Design ...Eco-Efficient Living: Redefining Sustainability through Leech's Green Design ...
Eco-Efficient Living: Redefining Sustainability through Leech's Green Design ...Newman George Leech
 
8 Key Elements for Comfortable Farmland Living
8 Key Elements for Comfortable Farmland Living 8 Key Elements for Comfortable Farmland Living
8 Key Elements for Comfortable Farmland Living Farmland Bazaar
 
Cashpay_Call Girls In Gaur City Mall Noida ❤️8860477959 Escorts Service In 24...
Cashpay_Call Girls In Gaur City Mall Noida ❤️8860477959 Escorts Service In 24...Cashpay_Call Girls In Gaur City Mall Noida ❤️8860477959 Escorts Service In 24...
Cashpay_Call Girls In Gaur City Mall Noida ❤️8860477959 Escorts Service In 24...lizamodels9
 
)_Call Girls In Radisson Blu Plaza Hotel, Delhi Airport ❤️8860477959 _Indepen...
)_Call Girls In Radisson Blu Plaza Hotel, Delhi Airport ❤️8860477959 _Indepen...)_Call Girls In Radisson Blu Plaza Hotel, Delhi Airport ❤️8860477959 _Indepen...
)_Call Girls In Radisson Blu Plaza Hotel, Delhi Airport ❤️8860477959 _Indepen...lizamodels9
 
Call Girls in Khan Market 9654467111 ESCORTS SERVICE
Call Girls in Khan Market 9654467111 ESCORTS SERVICECall Girls in Khan Market 9654467111 ESCORTS SERVICE
Call Girls in Khan Market 9654467111 ESCORTS SERVICESapana Sha
 
Puravankara Mundhwa Pune E-Brochure.pdf
Puravankara Mundhwa Pune  E-Brochure.pdfPuravankara Mundhwa Pune  E-Brochure.pdf
Puravankara Mundhwa Pune E-Brochure.pdfManishSaxena95
 

Recently uploaded (20)

9990771857 Call Girls in Noida Sector 03 Noida (Call Girls) Delhi
9990771857 Call Girls in Noida Sector 03 Noida (Call Girls) Delhi9990771857 Call Girls in Noida Sector 03 Noida (Call Girls) Delhi
9990771857 Call Girls in Noida Sector 03 Noida (Call Girls) Delhi
 
Low Rate Call Girls in Akshardham Delhi Call 9990771857
Low Rate Call Girls in Akshardham   Delhi Call 9990771857Low Rate Call Girls in Akshardham   Delhi Call 9990771857
Low Rate Call Girls in Akshardham Delhi Call 9990771857
 
How to Build Multifamily and Laneway Suites in Toronto!! (feat. Expert Archi...
How to Build Multifamily and Laneway Suites  in Toronto!! (feat. Expert Archi...How to Build Multifamily and Laneway Suites  in Toronto!! (feat. Expert Archi...
How to Build Multifamily and Laneway Suites in Toronto!! (feat. Expert Archi...
 
The Omaxe State Dwarka Delhi-broucher.pdf.pdf
The Omaxe State Dwarka Delhi-broucher.pdf.pdfThe Omaxe State Dwarka Delhi-broucher.pdf.pdf
The Omaxe State Dwarka Delhi-broucher.pdf.pdf
 
9990771857 Call Girls in Noida Sector 10 Noida (Call Girls) Delhi
9990771857 Call Girls in Noida Sector 10 Noida (Call Girls) Delhi9990771857 Call Girls in Noida Sector 10 Noida (Call Girls) Delhi
9990771857 Call Girls in Noida Sector 10 Noida (Call Girls) Delhi
 
Omaxe Dwarka In Delhi E Brochure Pdf
Omaxe Dwarka In Delhi E Brochure     PdfOmaxe Dwarka In Delhi E Brochure     Pdf
Omaxe Dwarka In Delhi E Brochure Pdf
 
Building Dreams: Newman Leech's Visionary Approach to Real Estate Investment
Building Dreams: Newman Leech's Visionary Approach to Real Estate InvestmentBuilding Dreams: Newman Leech's Visionary Approach to Real Estate Investment
Building Dreams: Newman Leech's Visionary Approach to Real Estate Investment
 
Rustomjee The Panorama At Pali Hill, Bandra West, Mumbai - Brochure.pdf
Rustomjee The Panorama At Pali Hill, Bandra West, Mumbai - Brochure.pdfRustomjee The Panorama At Pali Hill, Bandra West, Mumbai - Brochure.pdf
Rustomjee The Panorama At Pali Hill, Bandra West, Mumbai - Brochure.pdf
 
Call Girls In The Lalit New Delhi ❤️8860477959 Good Looking Escorts In 24/7 D...
Call Girls In The Lalit New Delhi ❤️8860477959 Good Looking Escorts In 24/7 D...Call Girls In The Lalit New Delhi ❤️8860477959 Good Looking Escorts In 24/7 D...
Call Girls In The Lalit New Delhi ❤️8860477959 Good Looking Escorts In 24/7 D...
 
young call girls in Lajpat Nagar,🔝 9953056974 🔝 escort Service
young call girls in Lajpat Nagar,🔝 9953056974 🔝 escort Serviceyoung call girls in Lajpat Nagar,🔝 9953056974 🔝 escort Service
young call girls in Lajpat Nagar,🔝 9953056974 🔝 escort Service
 
Purva Palm Hills Devanahalli, Bangalore E- Brochure.pdf
Purva Palm Hills Devanahalli, Bangalore E- Brochure.pdfPurva Palm Hills Devanahalli, Bangalore E- Brochure.pdf
Purva Palm Hills Devanahalli, Bangalore E- Brochure.pdf
 
Call Girls in Nehru Place Delhi 💯Call Us 🔝8264348440🔝
Call Girls in Nehru Place Delhi 💯Call Us 🔝8264348440🔝Call Girls in Nehru Place Delhi 💯Call Us 🔝8264348440🔝
Call Girls in Nehru Place Delhi 💯Call Us 🔝8264348440🔝
 
Call Girls in Kashmiri Gate Delhi 💯Call Us 🔝8264348440🔝
Call Girls in Kashmiri Gate Delhi 💯Call Us 🔝8264348440🔝Call Girls in Kashmiri Gate Delhi 💯Call Us 🔝8264348440🔝
Call Girls in Kashmiri Gate Delhi 💯Call Us 🔝8264348440🔝
 
Eco-Efficient Living: Redefining Sustainability through Leech's Green Design ...
Eco-Efficient Living: Redefining Sustainability through Leech's Green Design ...Eco-Efficient Living: Redefining Sustainability through Leech's Green Design ...
Eco-Efficient Living: Redefining Sustainability through Leech's Green Design ...
 
8 Key Elements for Comfortable Farmland Living
8 Key Elements for Comfortable Farmland Living 8 Key Elements for Comfortable Farmland Living
8 Key Elements for Comfortable Farmland Living
 
Cashpay_Call Girls In Gaur City Mall Noida ❤️8860477959 Escorts Service In 24...
Cashpay_Call Girls In Gaur City Mall Noida ❤️8860477959 Escorts Service In 24...Cashpay_Call Girls In Gaur City Mall Noida ❤️8860477959 Escorts Service In 24...
Cashpay_Call Girls In Gaur City Mall Noida ❤️8860477959 Escorts Service In 24...
 
)_Call Girls In Radisson Blu Plaza Hotel, Delhi Airport ❤️8860477959 _Indepen...
)_Call Girls In Radisson Blu Plaza Hotel, Delhi Airport ❤️8860477959 _Indepen...)_Call Girls In Radisson Blu Plaza Hotel, Delhi Airport ❤️8860477959 _Indepen...
)_Call Girls In Radisson Blu Plaza Hotel, Delhi Airport ❤️8860477959 _Indepen...
 
Call Girls in Khan Market 9654467111 ESCORTS SERVICE
Call Girls in Khan Market 9654467111 ESCORTS SERVICECall Girls in Khan Market 9654467111 ESCORTS SERVICE
Call Girls in Khan Market 9654467111 ESCORTS SERVICE
 
Low Rate Call Girls in Triveni Complex Delhi Call 9873940964
Low Rate Call Girls in Triveni Complex Delhi Call 9873940964Low Rate Call Girls in Triveni Complex Delhi Call 9873940964
Low Rate Call Girls in Triveni Complex Delhi Call 9873940964
 
Puravankara Mundhwa Pune E-Brochure.pdf
Puravankara Mundhwa Pune  E-Brochure.pdfPuravankara Mundhwa Pune  E-Brochure.pdf
Puravankara Mundhwa Pune E-Brochure.pdf
 

Cincinnati Industrial Market Vacancy Rises to 9.0

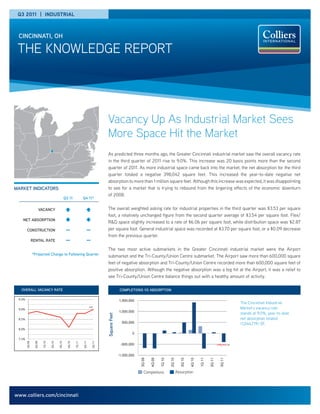
  • 1. Q3 2011 | INDUSTRIAL CINCINNATI, OH THE KNOWLEDGE REPORT Vacancy Up As Industrial Market Sees More Space Hit the Market As predicted three months ago, the Greater Cincinnati industrial market saw the overall vacancy rate in the third quarter of 2011 rise to 9.0%. This increase was 20 basis points more than the second quarter of 2011. As more industrial space came back into the market, the net absorption for the third quarter totaled a negative 398,042 square feet. This increased the year-to-date negative net absorption to more than 1 million square feet. Although this increase was expected, it was disappointing MARKET INDICATORS to see for a market that is trying to rebound from the lingering effects of the economic downturn of 2008. Q3 11 Q4 11* VACANCY The overall weighted asking rate for industrial properties in the third quarter was $3.53 per square foot, a relatively unchanged figure from the second quarter average of $3.54 per square foot. Flex/ NET ABSORPTION R&D space slightly increased to a rate of $6.06 per square foot, while distribution space was $2.87 CONSTRUCTION — — per square foot. General industrial space was recorded at $3.70 per square foot, or a $0.09 decrease from the previous quarter. RENTAL RATE — — The two most active submarkets in the Greater Cincinnati industrial market were the Airport *Projected Change to Following Quarter submarket and the Tri-County/Union Centre submarket. The Airport saw more than 600,000 square feet of negative absorption and Tri-County/Union Centre recorded more than 600,000 square feet of positive absorption. Although the negative absorption was a big hit at the Airport, it was a relief to see Tri-County/Union Centre balance things out with a healthy amount of activity. OVERALL VACANCY RATE COMPLETIONS VS ABSORPTION 9.5% Completions Absorption 1,500,000 The Cincinnati Industrial 9.0% 9.0% Market’s vacancy rate 1,000,000 stands at 9.0%, year-to-date Square Feet 8.5% net absorption totaled 500,000 (1,044,719) SF. 8.0% 0 7.5% 3Q 09 4Q 09 1Q 10 2Q 10 3Q 10 4Q 10 1Q 11 2Q 11 3Q 11 -500,000 (398,042) SF -1,000,000 3Q 09 4Q 09 1Q 10 2Q 10 3Q 10 4Q 10 1Q 11 2Q 11 3Q 11 Completions Absorption www.colliers.com/cincinnati
  • 2. THE KNOWLEDGE REPORT | Q3 2011 | INDUSTRIAL | CINCINNATI NORTHERN KENTUCKY 248,360 square feet of positive absorption. This helped to lower the overall vacancy rate for this In Northern Kentucky, the Airport submarket saw submarket by 120 basis points to 6.0%. 7575 the biggest increase in vacancy as total net Empire Drive was the largest contributor to the absorption was negative 646,767 square feet for overall vacancy rate. The building is now 100% the third quarter. The overall vacancy rate at the occupied and 128,000 square feet of positive Airport increased by 230 basis points to 9.9%. absorption was recorded in the third quarter as Most of the negative absorption was concentrated a result. to distribution space and a small number of deals AVG. ASKING RATES (PER SF - NET) were accountable for the increase in space given SUBURBAN OHIO MARKETS back to the market. On the north side of the river, the Tri-County/ $8 1100 Burlington Pike was one of the largest loss Union Centre submarket led the way in the third $7 leaders in Northern Kentucky. The former Square quarter of 2011. This submarket posted 616,547 $6 D building now sits empty and 477,862 square square feet of positive absorption and lowered $5 feet of vacant space was added to our statistics. the vacancy rate from 13.0% to 12.1%. $4 2285 Litton Lane (182,000 square feet) became $3 vacant and available and added to the negative SwimOutlet.com was one of the largest $2 absorption total. contributors to the positive news in Tri-County, as 3Q 09 4Q 09 1Q 10 2Q 10 3Q 10 4Q 10 1Q 11 2Q 11 3Q 11 the company signed a lease for 390,000 square The Florence/Walton submarket helped to offset feet at 4300 Port Union Road. Also in Tri-County General Flex Distribution some of the negative absorption by providing at World Park Building 31, A-T Controls signed a UPDATE Recent Transactions LEASING ACTIVITY PROPERTY SUBMARKET TENANT LANDLORD SIZE TYPE 4300 Port Union Road Tri-County/Union Centre SwimOutlet.com DCT Port Union LLC 390,000 Direct Lease Former Batavia Ford Transmission Plant Eastern Outlying Global Scrap Management IRG Batavia I LLC 300,000 Direct Lease 5443 Duff Drive Tri-County/Union Centre HD Supply Duke Realty 166,000 Direct Lease 1605 Worldwide Blvd Airport Owens & Minor Distribution TRT-DCT LLC 150,100 Direct Lease World Park Bldg 31 Tri-County/Union Centre A-T Controls Duke Realty 122,120 Direct Lease ProLogis Park Sharonville #2 Tri-County/Union Centre hhGregg ProLogis 100,800 Direct Lease 910 Lila Avenue Eastern Outlying 3M Naples Milfield Venture LLC 80,000 Direct Lease 10345 S Medallion Blvd Lockland/Evendale Protective Packaging Solutions Arka Hollywood I LLC 69,720 Direct Lease Enterprise Station B Florence/Walton Magna-Tech Manufacturing Dividend Capital Investments LLC 64,177 Direct Lease Mosteller Distribution Center Tri-County/Union Centre Keebler, Inc. Duke Realty 63,410 Direct Lease 6245 Creek Road Blue Ash CECO Environmental Mandceng LLC 53,210 Direct Lease 11725 Commons Drive Tri-County/Union Centre Full Throttle Indoor Karting, LLC N/A 51,200 Direct Lease 4170 Columbia Road I-71 North Siemens Lebanon Discovery LLC 51,200 Direct Lease Port Union Commerce Park Bldg 2 Hamilton Consentino DCT Port Union LLC 33,600 Direct Lease Airpark Business Center III A Airport Pella Windows Ashley/Hemmer LLC 33,515 Direct Lease SALES ACTIVITY PROPERTY SUBMARKET BUYER SELLER SIZE SALES PRICE 537 Grandin Road I-71 North Hosea Project Movers Sumco Phoenix Corp 200,000 $825,000 1111 Western Row Road I-71 North Rhinestahl Corporation Malhotra Family LLC 120,584 $3,195,000 3650-3680 Kemper Road Tri-County/Union Centre Slate Ridge Holdings Triple D Ohio, LLC 60,900 $2,150,000 6480 Hamilton-Lebanon Road Middletown Housatonic LLC Midwest William R Johns & Carol M Johns 60,000 $1,750,000 7944 Innovation Way I-71 North Steve Ortner J & K Invest Ohio 40,193 $1,800,000 Transactions are believed to be accurate but not guaranteed. P. 2 | COLLIERS INTERNATIONAL
  • 3. THE KNOWLEDGE REPORT | Q3 2011 | INDUSTRIAL | CINCINNATI TOTAL DIRECT SUBLEASE TOTAL TOTAL VACANCY PRIOR QUARTER NET YTD NET AVERAGE INVENTORY VACANT SF VACANT SF VACANT SF RATE VACANCY RATE ABOSRPTION ABSORPTION ASKING RATE 275 EAST CORRIDOR Distribution 1,382,500 670,000 0 670,000 48.5% 48.5% 0 -19,500 $2.99 Flex Space 849,373 160,555 0 160,555 18.9% 18.9% 0 -35,883 $6.74 General 5,691,129 135,500 0 135,500 2.4% 2.4% 0 25,989 $3.00 TOTAL 7,923,002 966,055 0 966,055 12.2% 12.2% 0 -29,394 $3.52 AIRPORT Distribution 19,478,687 2,005,305 182,000 2,187,305 11.2% 7.9% -676,965 -61,795 $3.12 Flex Space 2,513,805 379,868 49,400 429,268 17.1% 16.4% 30,198 17,799 $4.78 General 5,886,254 151,200 0 151,200 2.6% 3.8% 0 250,070 $2.92 TOTAL 27,878,746 2,536,373 231,400 2,767,773 9.9% 7.6% -646,767 206,074 $3.35 BLUE ASH Distribution 2,069,634 198,320 0 198,320 9.6% 9.6% 0 -195,215 $2.31 Flex Space 2,047,353 339,737 16,500 356,237 17.4% 17.8% 7,790 4,459 $7.38 General 9,795,083 925,665 0 925,665 9.5% 6.5% -285,115 -370,323 $3.79 TOTAL 13,912,070 1,463,722 16,500 1,480,222 10.6% 8.6% -277,325 -561,079 $4.75 CAMPBELL COUNTY Distribution 318,940 0 0 0 0.0% 0.0% 0 0 Flex Space 20,000 0 0 0 0.0% 0.0% 0 0 General 3,854,790 16,000 0 16,000 0.4% 0.4% 0 0 TOTAL 4,193,730 16,000 0 16,000 0.4% 0.4% 0 0 CENTRAL/MIDTOWN Distribution 1,324,774 297,726 0 297,726 22.5% 27.3% 63,736 138,736 $2.02 Flex Space 1,543,719 85,536 0 85,536 5.5% 5.5% 0 43,555 $8.77 General 52,361,383 3,140,483 0 3,140,483 6.0% 6.1% 41,000 -891,663 $3.68 TOTAL 55,229,876 3,523,745 0 3,523,745 6.4% 6.6% 104,736 -709,372 $3.58 COVINGTON Distribution 776,600 0 0 0 0.0% 0.0% 0 0 Flex Space 40,000 0 0 0 0.0% 0.0% 0 0 General 4,085,849 198,000 36,000 234,000 5.7% 3.0% -112,000 -99,000 $3.75 TOTAL 4,902,449 198,000 36,000 234,000 4.8% 2.5% -112,000 -99,000 $3.75 EASTERN OUTLYING Distribution 107,520 107,520 0 107,520 100.0% 100.0% 0 -27,520 $4.25 Flex Space 280,809 110,300 0 110,300 39.3% 39.3% 0 0 $5.96 General 3,593,638 666,585 0 666,585 18.5% 18.0% -20,279 -116,404 $4.69 TOTAL 3,981,967 884,405 0 884,405 22.2% 0.0% -20,279 -143,924 $4.81 FLORENCE/WALTON Distribution 9,262,785 550,803 63,520 614,323 6.6% 9.2% 237,960 3,024 $2.76 Flex Space 696,431 146,955 0 146,955 21.1% 22.8% 11,496 64,389 $4.61 General 10,754,228 323,336 165,000 488,336 4.5% 4.5% -1,096 -58,656 $3.45 TOTAL 20,713,444 1,021,094 228,520 1,249,614 6.0% 7.2% 248,360 8,757 $3.23 HAMILTON Distribution 335,000 7,200 0 7,200 2.1% 2.1% 0 0 General 6,986,859 256,500 0 256,500 3.7% 3.7% 0 116,000 $4.03 TOTAL 7,321,859 263,700 0 263,700 3.6% 3.6% 0 116,000 $4.03 I-71 NORTH CORRIDOR Distribution 1,939,653 483,614 0 483,614 24.9% 24.9% 0 -145,491 $3.50 Flex Space 530,805 104,874 0 104,874 19.8% 15.4% -26,038 53,755 $5.93 General 7,611,592 960,057 0 960,057 12.6% 12.3% -27,500 -54,840 $3.70 TOTAL 10,082,050 1,548,545 0 1,548,545 15.4% 14.9% -53,538 -146,576 $3.78 LOCKLAND/EVENDALE Distribution 521,960 68,000 0 68,000 13.0% 13.0% 0 -68,000 $1.88 Flex Space 780,821 108,055 0 108,055 13.8% 14.1% 2,270 45,050 $6.23 General 17,897,280 580,608 0 580,608 3.2% 1.7% -283,046 -162,839 $3.70 TOTAL 19,200,061 756,663 0 756,663 3.9% 2.5% -280,776 -185,789 $3.86 MONROE/MIDDLETOWN Distribution 7,498,392 893,140 0 893,140 11.9% 11.9% 0 135,000 $3.12 Flex Space 129,500 40,120 0 40,120 31.0% 31.0% 0 0 $5.00 General 3,498,501 91,500 0 91,500 2.6% 3.3% 23,000 94,500 $3.57 TOTAL 11,126,393 1,024,760 0 1,024,760 9.2% 9.4% 23,000 229,500 $3.24 OUTSIDE METRO AREA Distribution 275,000 0 0 0 0.0% 0.0% 0 0 General 40,000 40,000 0 40,000 100.0% 100.0% 0 0 $4.50 TOTAL 315,000 40,000 0 40,000 12.7% 100.0% 0 0 $4.50 TRI-COUNTY/UNION CENTRE Distribution 23,216,789 4,606,467 435,150 5,041,617 21.7% 22.7% 234,815 156,769 $2.74 Flex Space 5,130,977 1,016,085 13,030 1,029,115 20.1% 21.9% 91,093 -91,474 $6.21 General 36,459,352 1,746,709 26,000 1,772,709 4.9% 5.6% 290,639 364,789 $3.71 TOTAL 64,807,118 7,369,261 474,180 7,843,441 12.1% 13.0% 616,547 430,084 $3.35 WESTERN OUTLYING Flex Space 218,000 0 0 0 0.0% 0.0% 0 0 General 6,215,297 619,209 0 619,209 10.0% 10.0% 0 -160,000 $2.94 TOTAL 6,433,297 619,209 0 619,209 9.6% 9.6% 0 -160,000 $2.94 MARKET TOTALS Distribution 68,508,234 9,888,095 680,670 10,568,765 15.4% 15.3% -140,454 -83,992 $2.87 Flex Space 14,781,593 2,492,085 78,930 2,571,015 17.4% 17.9% 116,809 101,650 $6.06 General 174,691,235 9,811,352 227,000 10,038,352 5.7% 5.7% -374,397 -1,062,377 $3.70 TOTAL 257,981,062 22,191,532 986,600 23,178,132 9.0% 8.8% -398,042 -1,044,719 $3.53 COLLIERS INTERNATIONAL | P. 3
  • 4. THE KNOWLEDGE REPORT | Q3 2011 | INDUSTRIAL | CINCINNATI lease for 122,120 square feet with Duke foot facility in Roselawn and Z.F. Steering Systems Realty Group. has two buildings under construction in Florence. 512 offices in In the Eastern Outlying submarket, a market that Speculative construction of industrial space is not 61 countries on has not seen much activity recently, Global Scrap anticipated anytime soon, but build-to-suit projects Management signed a 300,000 square foot lease like mentioned above will continue to flourish as 6 continents at the former Batavia Ford transmission plant. This the economy improves. United States: 125 transaction was welcome news to the eastside of Canada: 38 Cincinnati, as it has not seen a deal of this FORECAST Latin America: 18 magnitude in quite some time. Asia Pacific: 214 As 2011 comes to an end, the last quarter should EMEA: 117 On the negative side, one of the largest hits to the not provide much variation compared to what we • $1.5 billion in annual revenue market was 8701 LeSaint Drive. The building now have witnessed in the first part of the year. We • 979 million square feet under sits vacant and has added 345,600 square feet of hope to see some positive net absorption, but this management space to the market from BAE. Graphic Packaging will not offset the 1 million square feet of negative • Over 12,000 professionals International also vacated 10600 Evendale Drive, absorption in the first three quarters of the year. and added 240,000 square feet to the market. Looking ahead to 2012, there is a slight concern with the Tri-County/Union Centre submarket, as INDUSTRIAL TEAM: more than 1 million square feet have already Chuck A. Ackerman, CCIM, SIOR CONSTRUCTION +1 513 562 2266 surfaced and will become vacant next year. This Several projects continue to move forward towards includes Avon Products on Progress Place, CEVA Erin M. Casey, GA-C, MCRE completion. USUI International is still on track to Logistics on Windisch Road and the Liz Claiborne +1 513 562 2225 finish their 127,000 square foot facility in Facility on Jacquemin Drive. We hope other Sharonville. Links Unlimited is working on a Michael E. Daly, SIOR submarkets, including the Airport, can help pull +1 513 562 2206 60,000 square foot facility in Norwood. Eurostampa their weight and balance out our overall market to is in the process of completing a 75,000 square end the year on a good note. John B. Gartner, III, SIOR +1 513 562 2207 INDUSTRIAL SUBMARKETS William K. Keefer, SIOR +1 513 562 2235 MONROE/ Steven R. Miller HAMILTON MIDDLETOWN +1 513 562 2252 TRI-COUNTY/ CEO/PRINCIPAL | CINCINNATI: UNION CENTRE I-71 CORRIDOR Shenan P. Murphy, CCIM +1 513 721 4200 BLUE DIRECTOR OF RESEARCH: LOCKLAND/ ASH Brian T. Graham, CCIM EVENDALE +1 513 562 2214 GRAPHIC DESIGNER: I-275 EAST CORRIDOR Ricky R. Dennis CENTRAL/ +1 513 562 2213 MIDTOWN Colliers International | Greater Cincinnati INT’L 425 Walnut Street, Suite 1200 AIRPORT Cincinnati, OH 45202 COVINGTON Colliers International AIRPORT statistics are audited annually and may result in revisions to previously FLORENCE/WALTON CAMPBELL reported quarterly and CORRIDOR COUNTY final year-end figures Accelerating success. www.colliers.com/cincinnati