Downloaded 39 times

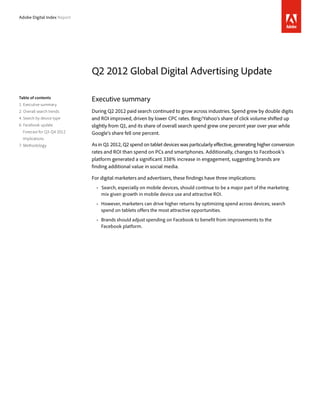
![Figure 5 shows that CPCs on Google continued to decrease, falling slightly over the prior quarter to
end 13 percentage points down year over year, while Bing/Yahoo CPCs decreased from the prior
quarter to end flat year over year. We attribute the decrease in overall Google CPCs to an increase in
share of mobile clicks – where CPCs are less expensive. The decrease in Bing/Yahoo CPCs is
attributed to changes in the finance sector, where CPCs dropped considerably over the prior quarter. 2
Figure 6 shows that in the U.K., click volume was flat compared to Q1 and increased 21% year over
year, while CPCs edged down 1% for the quarter, declining 11% year over year over year. Germany
click volume increased 10 percentage points over the first quarter for growth of 32% year over year,
while CPCs fell 3% from the first quarter for a 14% year over year decline.
Clicks up 32% YoY
100% 100% 100%
CPC down 11% YoY CPC down 14% YoY
Google down 13% YoY
Q2/11 Q3/11 Q4/1 Q1/12 Q2/12 Q2/11 Q3/11 Q4/1 Q1/12 Q2/12 Q2/11 Q3/11 Q4/1 Q1/12 Q2/12
Search engine [U.S.] U.K. Germany
Figure 5—CPC, U.S. Figure 6—Click volume and CPC, U.K. and Germany
Industry breakdown—Figure 7 show performance trends for the automobile, financial services, and
retail industries in the United States. The auto industry saw a robust increase in spend, up 28% year
over year, consistent with broader recovery in this industry. The financial services and retail
industries saw 5% and 14% increases in spend, respectively, year over year. ROI fell 9% year over
year for the automobile industry, but increased 50% and 25% in financial services and retail,
respectively. The decline in spend and increase in ROI over the prior quarter for financial services
results form more effective spend optimization. Growth in both search spend and ROI in financial
services and retail signals that these industries have additional opportunity for spending growth in
the coming quarters.
Spend up 28% YoY ROI up 9% YoY ROI up 50% YoY
100% 100% 100% Spend up 14% YoY
Spend up 5% YoY
ROI fell 9% YoY
Q2/11 Q3/11 Q4/1 Q1/12 Q2/12 Q2/11 Q3/11 Q4/1 Q1/12 Q2/12 Q2/11 Q3/11 Q4/1 Q1/12 Q2/12
Automobile [U.S.] Retail [U.S.] Financial Services [U.S.]
Figure 7—Spend and ROI by industry
Adobe Digital Index Report 3](https://image.slidesharecdn.com/13926-q22012globaladvertisingupdatef-120730053015-phpapp02/85/Q2-2012-Global-Digital-Advertising-Update-4-320.jpg)
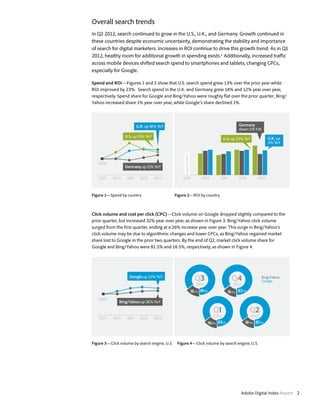
![Search by device type
While overall search spend increased year over year across PC, smartphone, and tablet
device types, conversion rates, CPCs, and ROI for these devices varied widely. Conversion
rates for tablet campaigns, relative to PC campaigns, rose over the past quarter, creating a
surge in tablet ROI despite the fact that tablet CPC remain below those of PCs. This
indicates that there are significant opportunities for marketers to drive higher ROI by
shifting spend to tablets, findings consistent with those in prior Adobe Digital Index reports
on the use of tablet devices and returns on tablet search spend.3
Conversion rates relative to PC desktops by device and industry—Figure 8 shows that across
industries, overall tablet conversion rates were approximately 20 percentage points higher than
those of PCs. Likewise, smartphone conversion rates were significantly lower across the board, with
overall conversion rates approximately 42 percentage points lower than PC conversion rates.
120%
PC = 100%
122% PC = 100%
58% 62%
Overall [U.S.] Financial Services [U.S.]
119%
PC = 100%
120% PC = 100%
57% 63%
Retail [U.S.] Overall [U.K. and Germany]
Figure 8—Conversion rates by device and industry
Adobe Digital Index Report 4](https://image.slidesharecdn.com/13926-q22012globaladvertisingupdatef-120730053015-phpapp02/85/Q2-2012-Global-Digital-Advertising-Update-5-320.jpg)
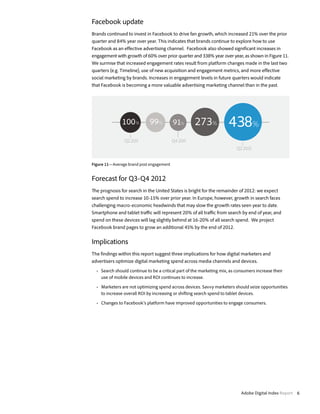
![CPC and ROI by device and vertical—As shown in Figure 9, overall smartphone and tablet CPCs in
the United States were 56% and 71% of CPCs for PCs, respectively. Both smartphone and tablet CPCs
were higher in the financial industry than in the retail. Because both smartphone CPCs and
conversion rates are significantly lower than those for PCs, overall smartphone ROI is similar to ROI
on PCs. In contrast, tablets have lower CPCs but higher conversion rates, increasing tablet ROI to
nearly 70% higher than that of PCs, as shown in Figure 10.
PC = 100% PC = 100% PC = 100%
71% 79% 69%
56% 71% 49%
Overall [U.S] Financial [U.S.] Retail [U.S.]
Figure 9—CPC by device and industry
103% 155% 88% 116%
168% 173%
PC = 100% PC = 100% PC = 100%
Overall [U.S] Financial [U.S.] Retail [U.S.]
Figure 10—ROI by device and industry
Adobe Digital Index Report 5](https://image.slidesharecdn.com/13926-q22012globaladvertisingupdatef-120730053015-phpapp02/85/Q2-2012-Global-Digital-Advertising-Update-6-320.jpg)

During Q2 2012: - Paid search advertising continued to grow across industries, driven by lower costs-per-click and improved return on investment. - Search spending on tablets generated higher conversion rates and ROI than PCs and smartphones. - Changes to Facebook's platform led to a significant 338% increase in user engagement, indicating that brands can benefit from optimizing social media spending.


