Download to read offline

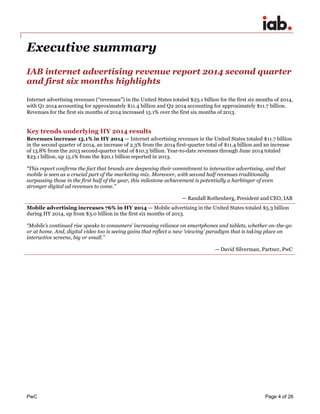
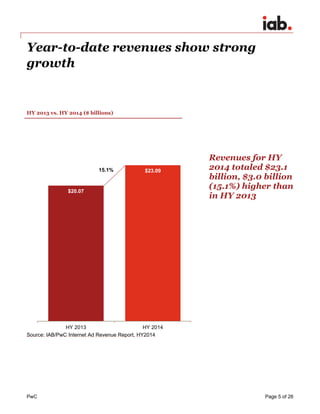
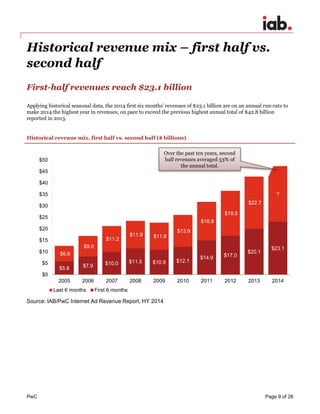
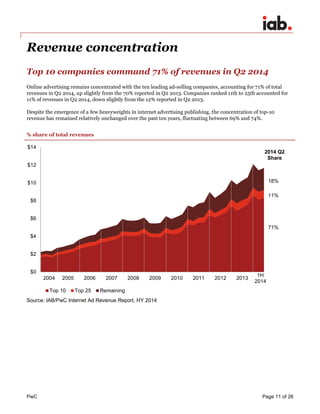
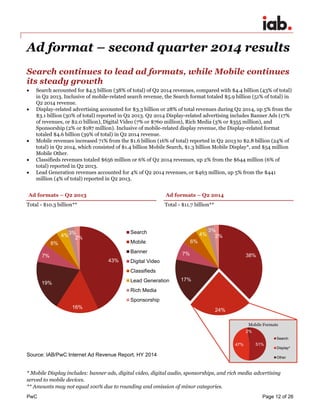
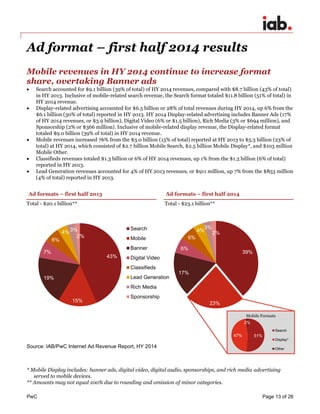

An industry survey conducted by PwC and sponsored by the IAB found that US internet advertising revenues totaled $23.1 billion for the first six months of 2014, a 15.1% increase over the same period in 2013. Mobile advertising revenues increased 76% year-over-year, totaling $5.3 billion. The top 10 internet advertising companies accounted for 71% of total revenues in Q2 2014, consistent with previous years.


