Download as PDF, PPTX


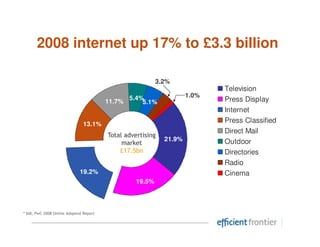
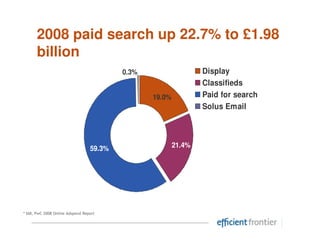
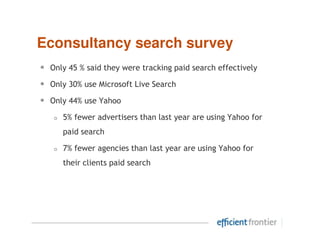
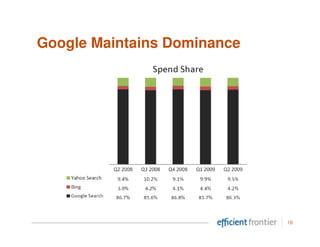

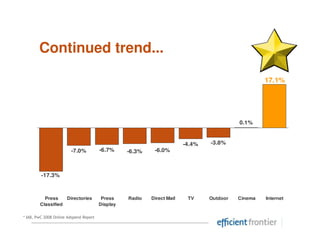
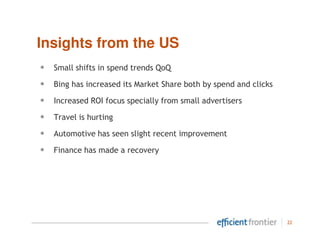
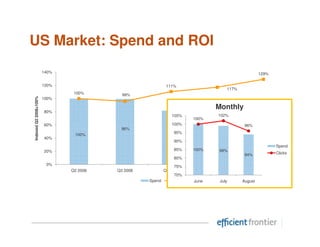
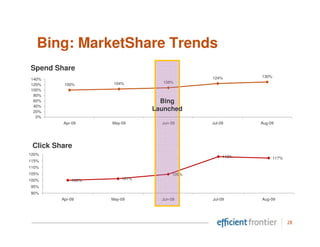
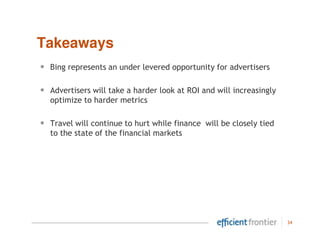

The document discusses current trends in search engine marketing (SEM), highlighting a significant global increase in online ad spending, particularly in paid search which rose to £1.98 billion in 2008. It notes that search remains a measurable and effective marketing tool, with expectations for growth in U.S. search advertising by 16% in 2010. Additionally, it emphasizes that advertisers are increasingly focusing on return on investment (ROI) and are likely to shift their spending towards platforms like Bing and Google over Yahoo.

![Wide Format Printers: A Hidden Profit Pool [Global Channel Partners Summit]](https://cdn.slidesharecdn.com/ss_thumbnails/no-4graphexpo-wideformatdealerpresentation-121012143035-phpapp01-thumbnail.jpg?width=640&height=640&fit=bounds)


