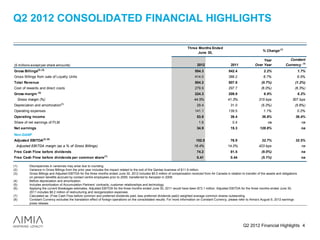
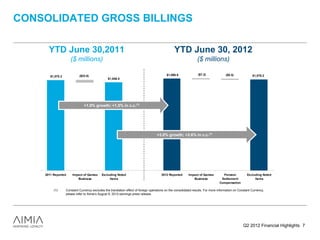
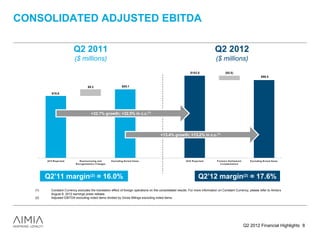
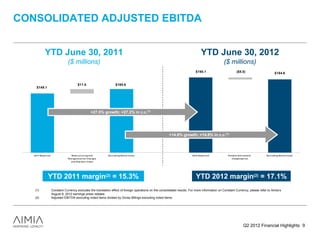
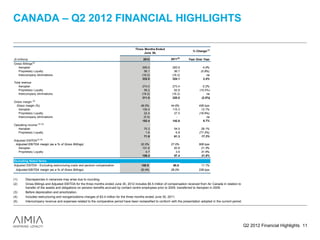
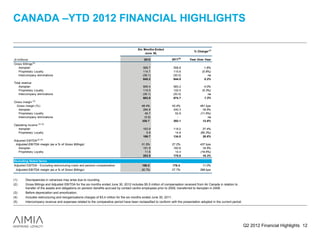
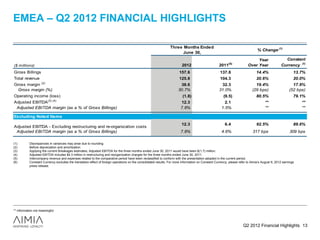
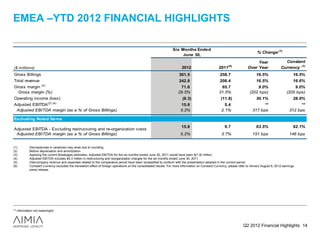
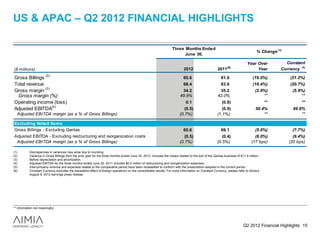
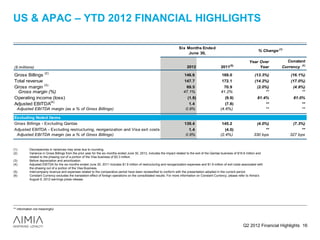
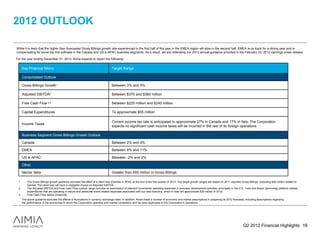
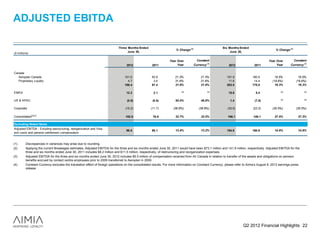
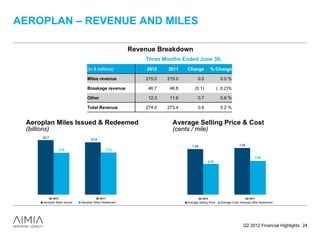
This document provides financial highlights for Q2 2012, including year-over-year comparisons. Some key figures increased significantly from 2011 to 2012, such as operating income (up 36.8%), net earnings (up 128.8%), and adjusted EBITDA (up 32.7%). However, total revenue decreased slightly (down 0.7%) from 2011 to 2012. The document also notes that results are subject to various risks and uncertainties and may differ materially from forward-looking statements.
- Gross billings increased 1.7% year-over-year to $536.6 million driven by a 6.4% increase in loyalty units sold, partially offset by the loss of the Qantas program. On a constant currency basis, gross billings increased 1.2%.
- Adjusted EBITDA increased 22.5% year-over-year to $88.9 million due to improved margins and cost containment. On a constant currency basis, adjusted EBITDA growth was also 22.5%.
- Free cash flow before dividends paid was $18.3 million compared to negative $21.2 million in the prior year due to improved operating results.
- Gross billings increased 1.7% year-over-year to $536.6 million driven by a 6.4% increase in loyalty units sold, partially offset by the loss of the Qantas program. On a constant currency basis, gross billings increased 1.2%.
- Adjusted EBITDA increased 22.5% year-over-year to $88.9 million due to improved margins and cost containment. On a constant currency basis, adjusted EBITDA growth was also 22.5%.
- Free cash flow was $18.3 million compared to negative $21.2 million in the prior year due to higher earnings and working capital improvements.
- Q3 2011 saw record gross billings, adjusted EBITDA, and strong free cash flow for Aimia. Gross billings increased 4.1% year-over-year to $541.8 million.
- Adjusted EBITDA grew significantly by 83.5% to $104.2 million compared to Q3 2010. Free cash flow before dividends paid was $124.8 million.
- For the first nine months of 2011, gross billings increased 1.1% to $1.6 billion. Adjusted EBITDA rose 25.8% to $252.7 million, driven by growth across the business.
This document provides financial data and analysis for Leggett & Platt from 1996-2006. It summarizes that Leggett & Platt saw record sales and earnings in 2006, with sales increasing primarily through acquisitions. Earnings also benefited from several unusual items. The company focuses on using cash flows to fund capital expenditures, acquisitions, and dividend payments, maintaining debt at targeted levels. Key factors that impact the company's business are market demand, raw material costs, energy costs, and competition across its five business segments which produce a wide range of components and finished products.
The document summarizes Nationwide Financial's 2004 annual report. It discusses how in 2004, Nationwide Financial implemented changes to better align its operations with key market segments. This included appointing new leadership and instilling greater financial discipline. As a result, Nationwide Financial's total revenues increased 6% to $4.2 billion and net operating earnings rose 17% to $531 million in 2004. Looking ahead to 2005, Nationwide Financial's top priority will be strengthening its operating model while building platforms to capture growth opportunities by focusing on financial discipline, distribution strategy, and understanding consumer needs.
P&G is celebrating its 165th year of providing trusted brands to consumers around the world. In 2002, P&G marketed nearly 300 brands in over 160 countries. Key financial highlights included a 3% increase in net sales to $40.2 billion and a 49% increase in net earnings to $4.352 billion. Core earnings per share grew 10% as the company delivered broad sales growth across all business units and regions.
- Leggett & Platt is an American manufacturing company that saw net sales grow at an average annual rate of 8.4% between 1996 and 2006, reaching $5.5 billion in 2006.
- Gross profit margins increased over the decade from 18.1% to 21.2%, while operating margins grew from 8.1% to 9.1% and net earnings margins increased from 4.7% to 5.7%.
- Return on equity also improved over the period, rising from 10.1% in 2003 to 13.1% in 2006, while earnings per share grew at a compound annual rate of 7.2%.
omnicom group Q1 2006 Investor Presentationfinance22
Omnicom Group reported its financial results for the first quarter of 2006. Revenue increased 6.7% to $2.56 billion compared to the first quarter of 2005. Operating income rose 10.5% to $284.4 million and net income grew 10.1% to $165.7 million. The presentation also provided details on Omnicom's financial position, acquisition activity in the quarter, and potential future obligations from earn-outs and option plans related to past acquisitions.
- Gross billings increased 1.7% year-over-year to $536.6 million driven by a 6.4% increase in loyalty units sold, partially offset by the loss of the Qantas program. On a constant currency basis, gross billings increased 1.2%.
- Adjusted EBITDA increased 22.5% year-over-year to $88.9 million due to improved margins and cost containment. On a constant currency basis, adjusted EBITDA growth was also 22.5%.
- Free cash flow before dividends paid was $18.3 million compared to negative $21.2 million in the prior year due to improved operating results.
- Gross billings increased 1.7% year-over-year to $536.6 million driven by a 6.4% increase in loyalty units sold, partially offset by the loss of the Qantas program. On a constant currency basis, gross billings increased 1.2%.
- Adjusted EBITDA increased 22.5% year-over-year to $88.9 million due to improved margins and cost containment. On a constant currency basis, adjusted EBITDA growth was also 22.5%.
- Free cash flow was $18.3 million compared to negative $21.2 million in the prior year due to higher earnings and working capital improvements.
- Q3 2011 saw record gross billings, adjusted EBITDA, and strong free cash flow for Aimia. Gross billings increased 4.1% year-over-year to $541.8 million.
- Adjusted EBITDA grew significantly by 83.5% to $104.2 million compared to Q3 2010. Free cash flow before dividends paid was $124.8 million.
- For the first nine months of 2011, gross billings increased 1.1% to $1.6 billion. Adjusted EBITDA rose 25.8% to $252.7 million, driven by growth across the business.
This document provides financial data and analysis for Leggett & Platt from 1996-2006. It summarizes that Leggett & Platt saw record sales and earnings in 2006, with sales increasing primarily through acquisitions. Earnings also benefited from several unusual items. The company focuses on using cash flows to fund capital expenditures, acquisitions, and dividend payments, maintaining debt at targeted levels. Key factors that impact the company's business are market demand, raw material costs, energy costs, and competition across its five business segments which produce a wide range of components and finished products.
The document summarizes Nationwide Financial's 2004 annual report. It discusses how in 2004, Nationwide Financial implemented changes to better align its operations with key market segments. This included appointing new leadership and instilling greater financial discipline. As a result, Nationwide Financial's total revenues increased 6% to $4.2 billion and net operating earnings rose 17% to $531 million in 2004. Looking ahead to 2005, Nationwide Financial's top priority will be strengthening its operating model while building platforms to capture growth opportunities by focusing on financial discipline, distribution strategy, and understanding consumer needs.
P&G is celebrating its 165th year of providing trusted brands to consumers around the world. In 2002, P&G marketed nearly 300 brands in over 160 countries. Key financial highlights included a 3% increase in net sales to $40.2 billion and a 49% increase in net earnings to $4.352 billion. Core earnings per share grew 10% as the company delivered broad sales growth across all business units and regions.
- Leggett & Platt is an American manufacturing company that saw net sales grow at an average annual rate of 8.4% between 1996 and 2006, reaching $5.5 billion in 2006.
- Gross profit margins increased over the decade from 18.1% to 21.2%, while operating margins grew from 8.1% to 9.1% and net earnings margins increased from 4.7% to 5.7%.
- Return on equity also improved over the period, rising from 10.1% in 2003 to 13.1% in 2006, while earnings per share grew at a compound annual rate of 7.2%.
omnicom group Q1 2006 Investor Presentationfinance22
Omnicom Group reported its financial results for the first quarter of 2006. Revenue increased 6.7% to $2.56 billion compared to the first quarter of 2005. Operating income rose 10.5% to $284.4 million and net income grew 10.1% to $165.7 million. The presentation also provided details on Omnicom's financial position, acquisition activity in the quarter, and potential future obligations from earn-outs and option plans related to past acquisitions.
- Albemarle Corporation's earnings presentation covered Q4 2008 results as well as full year 2008 results.
- Q4 2008 net sales were down 13.6% compared to Q4 2007, operating profit declined 122.7%, and net income declined 77.6%. Full year 2008 results saw net sales increase 5.6% while operating profit declined 28.7% and net income declined 15.5% compared to 2007.
- Results were negatively impacted by lower volumes across key end markets as well as increased raw material and energy costs. The company has taken steps to reduce costs and restructure operations.
omnicom group Q4 2004 Investor Presentationfinance22
Omnicom Group presented its full year 2004 results, reporting a 13.1% increase in revenue to $9.7 billion. Net income grew 14.7% to $723.5 million. Organic revenue growth was 6.7% while acquisitions contributed 1.9% growth. By discipline, advertising grew 11.4% to $4.2 billion, CRM grew 14% to $3.4 billion, and specialty grew 17.6% to $1.1 billion. Geographically, the United States grew 10.6% to $5.2 billion while international grew 9.3% to $4.5 billion. Cash flow from operations was $1.3 billion.
1 Q09 Earnings Eng Final[20090421134102809]Sang Park
The document provides LG Electronics' earnings release for the first quarter of 2009. It summarizes key financial results including:
- Consolidated sales of KRW 15.89 trillion, up 10.7% year-over-year but down 7.5% quarter-over-quarter. The operating profit margin was 0.12%.
- Sales and profit results for each business sector, including home entertainment, mobile communications, home appliances, and air conditioning. Most sectors saw sales growth year-over-year despite the economic recession.
- Parent company sales of KRW 7.07 trillion, up 2.1% year-over-year, with an operating profit of KRW 437 billion,
This document provides an overview of Aimia's 2012 Annual and Special Meeting of Shareholders. It lists the Chairman and Board of Directors. It then summarizes Aimia's investment highlights for 2011 including solid performance, a strong balance sheet, demonstrated cash flow, an attractive dividend, and a share buyback. The agenda is then outlined, including formal parts of the meeting, financial highlights, strategic overview, and Q&A. Financial highlights for 2011 are presented, including gross billings, revenue, costs, margins, earnings, EBITDA, and free cash flow. Contract renewals with Sainsbury's and HSBC are noted along with a proprietary loyalty update and US impairment charge.
- The company reported first quarter 2005 earnings per share of $0.64, up from $0.53 in the first quarter of 2004. This included a one-time recovery and excluded gains from real estate sales.
- Fleet Management Solutions revenue increased 10% and operating revenue grew 5% compared to the prior year, driven by acquisitions and commercial rental growth. This led to a 28% increase in net earnings before tax.
- Supply Chain Solutions revenue rose 8% due to new business, but earnings declined due to lower margins in some automotive accounts. Dedicated Contract Carriage earnings also declined due to contract losses and higher costs.
omnicom group Q1 2005 Investor Presentationfinance22
OmnicomGroup presented its first quarter 2005 results, reporting a 7.7% increase in revenue to $2.403 billion compared to the prior year. Operating income grew 12.2% to $257.3 million, with net income up 11% to $150.5 million. The presentation discussed financial results, cash flow, debt levels, liquidity, and return on equity. Omnicom remains in a strong financial position.
This document summarizes Baxter International's financial performance for the second quarter and first half of 2007 compared to the same periods in 2006. It shows that net sales increased 7% to $2.8 billion in Q2 2007 and 9% to $5.5 billion for the first half. Gross profit increased 21% in Q2 and 20% for the first half. Net income increased 39% to $431 million in Q2 and 41% to $834 million for the first half. Adjusted earnings figures exclude certain one-time charges.
omnicom group Q3 2007 Investor Presentationfinance22
Omnicom Group presented results for the third quarter of 2007. Revenue increased 11.8% to $3.1 billion compared to the third quarter of 2006. Net income rose 14.2% to $202.2 million. Acquisition spending totaled $329 million for the first nine months of 2007, and potential future earn-out obligations total $374 million if acquired agencies maintain current performance levels through 2010 and beyond.
This document summarizes a conference call about a company's 4th quarter 2006 results. It includes the following key points:
1) The Brazilian credit card market grew 12.1% in 2006, while the company's card base (CSU) grew 23.1%. CSU also increased its market share leadership.
2) CSU is set to start generating monthly revenues in May 2007 from its largest ever contract to process over 4 million credit cards for Caixa, Brazil's largest bank.
3) CSU's gross revenues grew 5.6% in 2006. Its CardSystem unit grew revenues 7.2% but had lower profit margins due to non-recurring revenues in 4Q2005.
The document is the 2002 annual report for FedEx. It highlights that in fiscal year 2002:
- Revenues increased 5% to a record $20.6 billion.
- Net income increased 22% to a record $710 million.
- Diluted earnings per share increased 18% to a record $2.34.
The report discusses how FedEx executed well despite a sluggish economy by containing costs, matching resources to demand, and capitalizing on opportunities through its diversified business units. It expresses confidence that ongoing efforts to improve productivity and focus on customers will help increase performance as the economy recovers.
This document provides annual performance ratios for E.I. DuPont de Nemours and Company for the years 2007-2003. It includes metrics such as total stockholder return, price-to-earnings ratios, dividend payout ratios, return on equity, return on invested capital, debt ratios, and interest coverage. Reconciliations are also provided to calculate ratios before significant items in order to provide adjusted figures.
Lincoln Financial Group has focused its business on wealth accumulation and wealth protection for the high-net-worth and retirement markets in the US. It has narrowed its focus through divesting businesses like its reinsurance operations and managed healthcare to concentrate on annuities, life insurance, and investment management. This focus has led to strong financial performance and earnings growth, though performance was impacted in 2001 by market declines. Lincoln's target markets in high-net-worth individuals and retirees have seen double-digit growth. Its life insurance and retirement products have strong positions in their target markets due to innovative product design and administrative services.
This document provides financial highlights and statistics for Aetna for the fourth quarter of 2008. It includes information on operating earnings, revenue, membership, medical benefit ratios, and statements of net income by business segment. Specifically:
- Operating earnings for Aetna decreased 1.4% year-over-year for the quarter but increased 4.6% for the full year.
- Total revenue increased 11.5% year-over-year for the quarter, driven by growth in health care premiums.
- Medical membership increased to 17.7 million at the end of 2008, up from 16.9 million the prior year.
- The health care segment reported net income of $350.
The document is Southern Company's 2003 annual report. It summarizes the company's strong financial and operational performance in 2003, with earnings of $1.47 billion, or $2.03 per share. It discusses the company's focus on its core businesses of power generation and delivery in the Southeast US. The report also announces that Chairman and CEO Allen Franklin will retire in July 2004, and that David Ratcliffe will succeed him as president in April and CEO in July. Ratcliffe expresses confidence in Southern Company's strategy and people to continue its record of success.
The Progressive Corporation reported financial results for March 2005. Net premiums written increased 5% to $1.127 billion compared to March 2004. Net income decreased 11% to $135.2 million compared to the prior year. Earnings per share fell 3% to $0.67. The combined ratio was 84.8, an increase of 2 percentage points from the prior year. Policies in force grew 12% year-over-year for personal lines and 14% for commercial auto.
We identified customers most likely to increase spend based on their current shopping patterns. Homebase used this insight to target retention offers, driving an incremental £2m in sales within 6 months. Connecting customer data and analytics helped solve their business challenge.
Jan-Pieter Lips discusses transforming Aimia's coalitions in EMEA. He highlights Nectar UK's strong momentum with growth in members and points issuance. Nectar has strengthened member and partner value through successful initiatives like Summer Double Value. Air Miles Middle East saw increased activity after refreshing its value proposition. Breaking into new areas, Nectar launched with eBay and innovated with Oxfam. Codifying successful models could unlock growth, such as trialling Nectar Local in Italy. The presentation outlines pillars to drive continued EMEA coalition leadership through strengthening existing programs, breaking into new areas, and codifying transferable success.
The document provides financial highlights from Aimia's Q1 2013 report. Some key points:
- Gross billings increased 4.6% to $561.1 million driven by growth in EMEA.
- Adjusted EBITDA decreased 6.9% to $82.8 million due to declines in Canada and US&APAC partially offset by growth in EMEA.
- Free cash flow before dividends was negative $39.1 million compared to positive $18.3 million in Q1 2012 due to higher cash taxes and capital expenditures.
Aimia's Q1 2015 highlights saw adjusted EBITDA increase approximately 60% year-over-year due to strong performance across regions. Gross billings declined slightly by 3.6% excluding the prior year contribution from TD, with growth in Canada and EMEA offset by declines in US and APAC. Free cash flow was positive at $5.2 million compared to negative $39.5 million in the prior year. Aimia reiterated its full year 2015 guidance targets.
- Gross billings for Q1 2014 were $717.2 million, an increase of 27.8% over Q1 2013, boosted by a $100 million contribution from TD related to Aeroplan program changes.
- Adjusted EBITDA was $132.6 million for Q1 2014, an increase of 60.1% over Q1 2013.
- Free cash flow before dividends paid was $60.5 million for Q1 2014, compared to negative $9.5 million for Q1 2013, driven by strong growth in gross billings and lower than expected redemptions.
Aimia's Q2 2015 highlights document includes forward-looking statements about financial metrics for 2015 that are based on assumptions and subject to various risks and uncertainties. It also contains non-GAAP financial measures to provide additional metrics to evaluate performance. The document provides definitions and reconciliations for adjusted EBITDA, adjusted net earnings, adjusted net earnings per share, free cash flow, and other non-GAAP measures.
In 3 sentences:
Aimia reported strong financial results for Q4 2014 and FY 2014, meeting or exceeding guidance across key metrics like gross billings and adjusted EBITDA. The Aeroplan program transformation delivered exceptional growth results but also impacted margins as expected due to factors like welcome bonus miles and marketing programs. While some challenges were expected from economic factors in certain regions, Aimia provided guidance for continued growth in 2015 supported by its global coalition programs and proprietary loyalty solutions.
The document outlines key terms of new 10-year agreements between Aeroplan and credit card issuers TD and CIBC, including increased rates for miles purchases and $140M in marketing spend over 4 years. It also details a purchase agreement where TD will acquire around half of CIBC's Aeroplan credit card portfolio, representing $20B in spending. Members will be able to accumulate miles seamlessly during the transition and receive enhanced benefits starting in 2014.
- Aeroplan Canada achieved its 6th straight quarter of year-over-year growth.
- Nectar now has 3 million members earning points through new partner British Gas.
- LMG I&C analytics unit entered into a strategic partnership with Sobeys.
- MOU signed with Tata Group to form a coalition loyalty program in India.
The document provides forward-looking statements for presentations. It states that forward-looking statements involve assumptions and are subject to risks and uncertainties that could cause actual results to differ materially from expectations. Some factors that could affect results include economic conditions, competition, changes to loyalty programs, seasonal aspects of the business, and other risks outlined in Aimia's public filings. The statements represent Aimia's expectations as of September 20, 2012 but Aimia disclaims any obligation to update forward-looking statements except as required by law.
This document highlights Aimia's Q2 2016 results and provides forward-looking statements about Aimia's financial metrics and performance in 2016. It cautions that these forward-looking statements are based on assumptions that may prove to be incorrect and are subject to various risks and uncertainties. It also notes that Aimia's actual results could differ materially from the forward-looking statements presented. The document defines various non-GAAP financial measures used by Aimia and refers readers to Aimia's MD&A for reconciliations of these measures to comparable GAAP measures.
1) Aimia aims to codify and replicate its successful loyalty program models globally to strengthen existing coalitions and build new ones. It seeks to leverage its coalition, analytics, and proprietary intellectual property across geographies.
2) Key aspects of Aimia's models that it seeks to codify globally include coalition value creation, member and partner management, liability management, redemption fulfillment, and reward design.
3) Aimia believes that by applying its advantaged intellectual property, such as member management technology and supply chain expertise, it can gain a competitive advantage in new coalitions.
This document contains slides from an AIMIA credit rating agency presentation from September 2014. It discusses AIMIA's financial performance in Q2 and the first half of 2014, with Gross Billings up 13.6% and 20.6% respectively. Free Cash Flow was also up significantly for the quarter and year-to-date. The presentation provides details on the drivers of growth and updates AIMIA's guidance targets for 2014.
The document lists several internship and temporary positions available at a global loyalty management company and event management company. The positions include marketing, business development, account management, IT, and event coordination intern roles located in Minneapolis, MN and Dayton, OH. The summaries provide high-level overviews of responsibilities, qualifications, and how to apply for each opportunity.
- Aimia changed its organizational structure from a regional to line of business structure effective January 1, 2016 to focus on its core loyalty businesses. The new structure has 3 operating segments: Americas Coalitions, International Coalitions, and Global Loyalty Solutions.
- In 2015, Aimia's gross billings were $2.5 billion, with 61% from Americas Coalitions, 29% from International Coalitions, and 10% from Global Loyalty Solutions. Adjusted EBITDA was $263 million.
- The new structure aims to simplify Aimia's operations, focus the company on data-driven marketing and loyalty analytics for growth, and provide supplemental financial information on the segments.
- The document discusses Aimia's Q1 2016 highlights and financial results. It provides forward-looking statements and cautions that actual results may differ materially from expectations.
- Gross billings decreased 3.7% to $573.0 million due to lost contracts, lower reward fulfillment activity, and wind downs, partially offset by new client wins. Adjusted EBITDA was $50.6 million.
- Key highlights included stability in Aeroplan's financial cards business, a new ISS win with Aeon Retail, and progress on Aimia's operating cost reduction initiatives.
Aeroplan is transforming its Canadian coalition loyalty program model to focus on delivering greater member value. Key changes include introducing a new Distinction program that provides differentiated recognition and rewards to high-value members based on their spending levels and travel, reworking agreements with financial partners TD and CIBC to introduce enhanced credit cards and drive growth, and improving travel rewards to offer more availability and value for members. The transformations aim to strengthen Aeroplan's market leadership position by better engaging premium members and generating higher revenues over the long term.
- Gross billings increased 1.7% year-over-year to $536.6 million driven by a 6.4% increase in loyalty units sold, partially offset by the loss of the Qantas program. On a constant currency basis, gross billings increased 1.2%.
- Adjusted EBITDA increased 22.5% year-over-year to $88.9 million due to improved margins and cost containment. On a constant currency basis, adjusted EBITDA increased 22.5%.
- Free cash flow before dividends paid was $18.3 million compared to negative $21.2 million in the prior year due to higher adjusted EBITDA.
- Aimia reported solid financial results for 2011 with gross billings increasing 2.9% on an adjusted basis to $2.23 billion. Revenue increased 9.5% to $2.25 billion driven by a $136 million adjustment to breakage estimates.
- Adjusted EBITDA increased 23.5% to $352.6 million and the adjusted EBITDA margin expanded to 15.8% from 13.2% the previous year.
- Free cash flow before dividends paid was $197.6 million, a decrease of 10.7% compared to the previous year.
This document provides a five-year summary of key financial metrics for the company from 2008-2004. It includes information on net sales, gross profit, expenses, income, per share information, balance sheet data, and other financial ratios. The summary shows that net sales grew at a compound annual growth rate of 7.2% from 2004-2008. However, income from continuing operations grew at a slower rate of 1.7% during this period.
This document provides financial data and analysis for Leggett & Platt from 1996-2006. It summarizes that Leggett & Platt saw record sales and earnings in 2006, with sales increasing primarily due to acquisitions. Earnings benefited from restructuring efforts completed in 2006. Cash from operations was used to fund capital expenditures, acquisitions, dividends, and share repurchases in line with stated priorities. Key factors that impact Leggett & Platt's business are market demand, raw material costs, energy costs, and competition.
- Leggett & Platt is an American manufacturing company that saw net sales grow at an average annual rate of 8.4% between 1996 and 2006, reaching $5.5 billion in 2006.
- Gross profit margins increased over the decade from 18.1% to 21.2%, while operating margins grew from 8.1% to 9.8% and net earnings margins increased from 4.7% to 5.5%.
- Return on equity also improved over the period, rising from 10.1% in 2003 to 13.1% in 2006.
Hyundai Commercial presented its 2012 financial results showing:
1) Operating income slightly decreased from the previous year due to increases in other operating expenses from government regulations.
2) While ordinary income decreased due to one-time factors, the company's fundamentals remained solid with a high return on assets of 3.01%.
3) The company maintained disciplined asset diversification across its financial businesses and stable capital levels above regulatory requirements.
Trina Solar held an earnings call to discuss its Q4 2012 and fiscal year 2012 performance. Key highlights included module and system shipments of 415MW and 1.6GW respectively. Revenue was $302.7 million for Q4 2012 and $1.3 billion for fiscal year 2012. Gross margins were low due to write-downs and provisions. The company provided guidance for Q1 2013 shipments of 420-430MW and fiscal year 2013 shipments of 2-2.1GW. Trina Solar has a strong balance sheet with $918 million in cash and manufacturing capacity of 2.4GW for modules and 2.4GW for cells. Regional sales breakdowns and commercial strategies were also discussed.
This document provides financial projections for Sample Co. for the years 2007-2014 following a leveraged buyout. It summarizes the sources and uses of funds for the transaction, including $1.25B in equity and $625M in total debt at closing. Projections show revenue growing at a 8.2% CAGR and EBITDA growing at 10.4% with debt declining from 5.54x leverage initially to 1.82x by 2014. Sponsors see potential IRRs of 16.8-25.3% depending on exit multiple with over 1.5-2x cash on cash return. Management sees higher IRRs of 27.9-40.6% and
omnicom group Q4 2007 Investor Presentationfinance22
Omnicom Group reported its fourth quarter and full year 2007 results. Revenue for the fourth quarter increased 12.7% to $3.6 billion compared to $3.2 billion in the prior year period. Full year revenue grew 11.6% to $12.7 billion. Growth was driven by a 5% benefit from foreign exchange rates, 1.1% from acquisitions, and 6.6% organic growth in the fourth quarter. Earnings per share for the fourth quarter increased 18.5% to $0.97 compared to $0.82 in the prior year.
omnicom group Q3 2008 Investor Presentationfinance22
Omnicom Group presented financial results for the third quarter and year-to-date period ending September 30, 2008. Key highlights include:
- Revenue grew 6.9% in Q3 2008 and 10.1% year-to-date. Organic growth contributed 4.1% and 5.0% respectively.
- Net income increased 5.6% in Q3 2008 and 10.2% year-to-date. Earnings per share grew 11.3% and 15.0% respectively.
- Advertising and CRM were the largest disciplines by revenue, together accounting for over 80% of total revenue. The United States was the largest market by revenue at over
omnicom group Q2 2006 Investor Presentationfinance22
Omnicom Group presented its financial results for the second quarter of 2006. Revenue grew 7.9% to $2.8 billion compared to the second quarter of 2005. Net income increased 8.1% to $244.1 million. Organic revenue growth accounted for 7.2% of total revenue growth. The company has a $2.4 billion credit facility expiring in 2011 and $1.1 billion in cash, providing $3.5 billion in total liquidity. Acquisition expenditures for the first half of 2006 totaled $151 million. Future earn-out obligations over the next 5 years are estimated at $405 million assuming current performance levels are maintained.
This document provides highlights and results from CCR's 4Q07 earnings.
Key highlights include a 6.9% increase in traffic in 4Q07 and 6.2% for 2007. Net revenue increased 11.7% in 4Q07 and 9.7% for 2007. EBITDA grew 16.7% in 4Q07.
Results reflect higher traffic and lower operating costs. Net income decreased 41.6% in 4Q07 due to higher financial expenses. CCR is proposing additional dividends of R$0.50 per share for 2007. Upcoming events include an acquisition of a stake in Renovias.
- Tempo Assist saw growth in its health, dental, and assistance segments in 2009 through acquisitions and new partnerships.
- Key events included implementing SAP, rebranding as Tempo Assist, and receiving approval for its Unibanco Saúde acquisition.
- The segments achieved increased revenues and beneficiaries. Dental and health saw particularly strong growth while maintaining stable costs.
The document provides financial results and highlights for Profarma's 3Q12 earnings release. Key points include:
- Consolidated revenues grew 15.3% year-over-year to R$957.7 million.
- Net income increased 27.4% to R$10.8 million, with a net margin of 1.3%.
- EBITDA grew 14.7% to R$22.1 million and the EBITDA margin was 2.7%.
- Sales of generic medications increased 54.7% compared to 3Q11.
1) CCR reported strong financial results for 2Q08 and 1H08, with net revenue growth of 14.3% and 14.0% respectively, and net income growth of 13.3% and 13.6% respectively.
2) Traffic grew 9.4% in 2Q08 and 8.4% in 1H08, demonstrating continued growth in the business.
3) CCR continues to focus on expanding its concessions portfolio through investments in existing assets and pursuing new concession opportunities.
- The company opened a new distribution center in Pernambuco, Brazil which will serve markets in Pernambuco and Paraíba.
- Gross revenues increased 17.3% compared to the same period last year, reaching R$528.6 million.
- Adjusted EBITDA increased 3.2% compared to the same period last year, reaching R$19.4 million.
- Net income increased 52.5% compared to the same period last year, reaching R$12.7 million.
omnicom group Q4 2008 Investor Presentationfinance22
The document provides an investor presentation for Omnicom's fourth quarter 2008 results. It includes a summary of revenue, operating income, earnings per share, and revenue growth by discipline for both the fourth quarter and full year of 2008 compared to 2007. Overall, revenue declined 7.0% in the fourth quarter but grew 5.2% for the full year. Operating income declined more sharply than revenue in the fourth quarter. Earnings per share on both a basic and diluted basis declined in the fourth quarter but grew for the full year. Advertising revenue grew the most while public relations revenue declined.
The company's net income increased 164.2% in 3Q09 compared to 3Q08, EBITDA increased 79.3%, and the cash cycle was reduced by 7.1 days. Gross revenues grew 3.2% and market share increased to 12.1%. Operating expenses declined 4.2% as a percentage of net revenues. The
This document provides a summary of Profarma's 4Q10 and 2010 earnings release. Some key highlights include:
- A 3.7 day reduction in cash cycle compared to 2009, resulting in lower working capital of R$22.9 million
- Positive operating cash flow for the third consecutive year of R$44.4 million
- A 3.0% increase in consolidated gross revenues to R$3.1 billion in 2010
- Net debt decreased to R$108.7 million in December 2010
This document provides highlights from Aimia's Q3 2017 results, including forward-looking statements about certain financial metrics for 2017. Such statements involve assumptions and are subject to risks and uncertainties that could cause actual results to differ materially. Slides 13-14, 19, 27, 38-39, 41, 43 and 54 contain specific forward-looking statements about 2017 financial metrics, based on general economic assumptions that may prove incorrect. The document also contains non-GAAP financial measures and reconciliations to GAAP measures.
The document provides highlights from Aimia's Q2 2017 results, including forward-looking statements about certain financial metrics for 2017. These statements involve assumptions that may prove to be incorrect. In addition, the statements do not reflect the potential impact of non-recurring items, transactions, or changes that could occur after the date of the document. Actual results could differ materially from the forward-looking statements. The document also contains non-GAAP financial measures and provides definitions and reconciliations to the most comparable GAAP measures.
This document provides highlights from Aimia's Q1 2017 results, including forward-looking statements about certain financial metrics for 2017. Such statements involve assumptions and are subject to risks and uncertainties that could cause actual results to differ materially. It also contains non-GAAP financial measures and reconciliations to GAAP measures. The document cautions that the assumptions used to make forward-looking statements about 2017 may prove incorrect or inaccurate.
This document provides highlights from Aimia's Q4 2016 results, including forward-looking statements about Aimia's financial metrics and performance in 2017. It also defines and reconciles several non-GAAP financial measures used by Aimia to measure performance, such as adjusted EBITDA and free cash flow, noting that these measures are not comparable to similar measures used by other companies. Finally, it cautions that Aimia's forward-looking statements are based on assumptions that may prove to be incorrect and are subject to various risks and uncertainties.
Aimia reported its Q3 2016 highlights. Gross billings decreased 3.8% year-over-year but were down only 0.4% excluding foreign exchange impacts. Adjusted EBITDA increased to $60.5 million compared to $46.1 million in Q3 2015, with the margin expanding to 10.8% from 7.9%. Free cash flow before dividends paid was $86.7 million compared to $59 million driven by higher EBITDA, lower capital expenditures and tax refunds. On a trailing twelve-month basis, free cash flow per share increased over 20% to $0.55 compared to $0.67 in Q3 2015.
This document provides highlights from Aimia's Q4 2015 results and includes forward-looking statements about Aimia's financial metrics and performance in 2016. It cautions that Aimia's statements involve assumptions that may prove to be incorrect and do not account for special items or new transactions. It also defines several non-GAAP financial measures used by Aimia to evaluate performance and measure compliance with debt covenants.
- Q3 2015 highlights document from Aimia provides forward-looking statements and cautions that actual results may differ materially from projections.
- It outlines Aimia's non-GAAP financial measures including Adjusted EBITDA and Adjusted Net Earnings which are used to evaluate performance but are not comparable to GAAP measures.
- The document reports Q3 2015 consolidated Adjusted EBITDA of $49.1 million, down from $63.9 million in Q3 2014, and updates 2015 guidance for lower Gross Billings and Adjusted EBITDA compared to previous targets.
The document describes several internship and temporary positions available at a customer loyalty company. The positions include an Account Management Intern, Business Development Intern, IT Intern, Marketing Operations Intern, Marketing Intern, and Temporary Event Manager. The summaries provide high-level overviews of what each role entails, qualifications sought, and how to apply.
- Q3 2014 highlights include strong performance in Canada driven by continued momentum with financial card partners and the refreshed Aeroplan program. EMEA growth slowed due to coalition programs.
- Gross billings increased 9.8% in Q3 driven by growth in Canada and proprietary loyalty businesses, offset by declines in US and APAC.
- Adjusted EBITDA was $63.9 million in Q3. Free cash flow before dividends was $56.3 million.
- 2014 guidance is confirmed with expected gross billings growth between 7-9% and adjusted EBITDA margin of approximately 12%.
- Aimia reported strong financial results for Q2 2014, with gross billings up 13.6% and free cash flow up 72.4%
- Aeroplan membership grew 4% to 5 million members since announcing its transformation, with co-branded credit cardholders reaching 1.5 million
- A new long-term partnership with Fractal Analytics was announced to build on Aimia's existing analytics capabilities
- Aimia achieved or surpassed its guidance for all metrics in 2013, with strong underlying performance across regions.
- Gross billings grew 4.5% on a constant currency basis for the year. Adjusted EBITDA was $350.5 million for the year, excluding conveyance items.
- Free cash flow was above guidance at $268.1 million for the year, excluding conveyance items. The company also continued growing its annual common share dividends.
- The document discusses Aimia's Q3 2013 financial highlights and year-to-date 2013 consolidated financial results. Key highlights include 7.4% growth in gross billings and 4.5% growth in adjusted EBITDA compared to last year.
- Gross billings growth was driven by strong performance in US & APAC (+29.5% cc) and Canada (+3.2%), partially offset by declines in EMEA (+1.7% cc).
- On a year-to-date basis, gross billings increased 4.9% to $1.7 billion. However, operating income declined due to a $683.6 million breakage adjustment related to changes in the
Charles Humphreys is the Managing Director of Cardlytics UK. Cardlytics is a global leader in card-linked marketing with a real-time marketing and analytics platform. It has partnerships with over 400 financial institutions in the US, including Bank of America. In the UK, Cardlytics launched a proposition in September 2013 with Lloyds Banking Group and their Halifax brand. Cardlytics models balance the needs of financial institutions, customers, and retailers/brands by providing revenue through rewards funded by advertisers, increasing card usage and engagement for customers through relevant offers, and profitable new media for advertisers. For financial institutions specifically, Cardlytics delivers value through rich rewards at no cost to the institution, increased card spend
Aeroplan is transforming its Canadian coalition loyalty program to focus on delivering greater member value. The transformation includes new 10-year agreements with TD and CIBC to be the exclusive issuers of Aeroplan credit cards. This provides a stable platform for growth. The changes are aimed at addressing points of vulnerability and providing a differentiated experience through a multi-year effort to rework the member experience. The goal is modest membership growth and higher revenues by upgrading members to drive more strategic use of miles and deliver outstanding value to members and partners.
Aimia's global strategy is focused on becoming the recognized global leader in loyalty by:
1) Breaking away from competitors by delivering distinctive programs and leading loyalty analytics capabilities.
2) Codifying and replicating successful loyalty models globally.
3) Strengthening their position in existing markets, verticals, countries, and customer segments.
4) Evolving their operating model through product and commercial model improvements.
The strategy aims to drive an attractive long-term investment proposition for shareholders through growth opportunities while maintaining a diversified and cash flow generating business model.
Jan-Pieter Lips discusses transforming Aimia's coalitions in EMEA. He outlines strategies to strengthen existing coalitions like Nectar UK and Air Miles Middle East by increasing member value and engagement. He also discusses breaking away from competitors by embracing digital with partnerships like eBay and using data insights innovatively with Oxfam. Finally, he talks about codifying successful models like Nectar UK to launch new programs in other regions, such as a pilot with small businesses in Italy. The overall aim is to continue driving leadership in EMEA coalitions.
Aeroplan is transforming its Canadian coalition loyalty program model to focus on delivering greater member value. Key changes include introducing a new Distinction program that provides differentiated recognition and rewards to high-value members based on their spending levels and travel, reworking agreements with financial partners TD and CIBC to introduce enhanced credit cards and drive growth, and improving travel rewards to offer more availability and value for members. The transformations aim to strengthen Aeroplan's market leadership position by better engaging premium members and generating higher revenues over the long term.
Aimia's global strategy focuses on data analytics at its core. It leverages four key assets: data, value-added IP, track record of impact, and customer centricity. Aimia has experience providing loyalty analytics in fast-moving retail, demonstrating strengths in areas like improving retailer performance and connecting different data sources. Looking forward, Aimia aims to compete in customer-centric analytics, loyalty program management analytics, business intelligence powered by customer data, and data/channel monetization.
Aimia's global strategy focuses on leading the loyalty market through four strategic pillars: 1) Breaking away from competitors by delivering distinctive value in owned programs and analytics capabilities, 2) Codifying and replicating successful coalition models globally, 3) Strengthening their current position, and 4) Evolving their operating model. The company aims to differentiate by investing in unique customer insights and data-generating assets. Aimia's member-centric approach centers on enabling customers to interact, share, and control their loyalty experience through personalized communications and a social graph.
2. FORWARD-LOOKING STATEMENTS
Forward-looking statements are included in the following presentations. These forward-looking statements are identified by the use of terms and
phrases such as “anticipate”, “believe”, “could”, “estimate”, “expect”, “intend”, “may”, “plan”, “predict”, “project”, “will”, “would”, and similar terms and
phrases, including references to assumptions. Such statements may involve but are not limited to comments with respect to strategies, expectations,
objectives, goals, aspirations, intentions, planned operations or future actions.
Forward-looking statements, by their nature, are based on assumptions and are subject to important risks and uncertainties. Any forecasts,
predictions or forward-looking statements cannot be relied upon due to, among other things, changing external events and general uncertainties of the
business and its corporate structure. Results indicated in forward-looking statements may differ materially from actual results for a number of reasons,
including without limitation, dependency on top Accumulation Partners and clients, conflicts of interest, greater than expected redemptions for
rewards, regulatory matters, retail market/economic conditions, industry competition, Air Canada liquidity issues, Air Canada or travel industry
disruptions, airline industry changes and increased airline costs, supply and capacity costs, unfunded future redemption costs, failure to safeguard
databases and consumer privacy, changes to coalition loyalty programs, seasonal nature of the business, other factors and prior performance, foreign
operations, legal proceedings, reliance on key personnel, labour relations, pension liability, technological disruptions and inability to use third party
software, failure to protect intellectual property rights, interest rate and currency fluctuations, leverage and restrictive covenants in current and future
indebtedness, uncertainty of dividend payments, managing growth, credit ratings, as well as the other factors identified throughout this presentation
and throughout our public disclosure record on file with the Canadian securities regulatory authorities.
The forward-looking statements contained herein represent the expectations of Aimia Inc., as of August 9, 2012 and are subject to change. However,
Aimia disclaims any intention or obligation to update or revise any forward-looking statements whether as a result of new information, future events or
otherwise, except as required under applicable securities regulations.
For further information, please contact Investor Relations at 416 352 3728 or trish.moran@aimia.com.
Q2 2012 Financial Highlights 2
4. Q2 2012 CONSOLIDATED FINANCIAL HIGHLIGHTS
Three Months Ended
% Change (1)
June 30,
Year Constant
($ millions except per share amounts) 2012 2011 Over Year Currency (8)
Gross Billings(2) (3) 554.3 542.4 2.2% 1.7%
Gross Billings from sale of Loyalty Units 414.0 388.2 6.7% 6.5%
Total Revenue 504.2 507.6 (0.7%) (1.2%)
Cost of rewards and direct costs 279.9 297.7 (6.0%) (6.3%)
(4)
Gross margin 224.3 209.9 6.9% 6.2%
Gross margin (%) 44.5% 41.3% 315 bps 307 bps
Depreciation and amortization(5) 29.4 31.0 (5.2%) (5.6%)
Operating expenses 141.1 139.5 1.1% 0.2%
Operating income 53.9 39.4 36.8% 36.4%
Share of net earnings of PLM 1.6 0.4 na na
Net earnings 34.9 15.3 128.8% na
Non-GAAP
Adjusted EBITDA(3) (6) 102.0 76.9 32.7% 32.5%
Adjusted EBITDA margin (as a % of Gross Billings) 18.4% 14.2% 423 bps na
Free Cash Flow before dividends 74.2 81.5 (9.0%) na
Free Cash Flow before dividends per common share (7) 0.41 0.44 (5.1%) na
(1) Discrepancies in variances may arise due to rounding.
(2) Variance in Gross Billings from the prior year includes the impact related to the exit of the Qantas business of $11.9 million.
(3) Gross Billings and Adjusted EBITDA for the three months ended June 30, 2012 includes $5.5 million of compensation received from Air Canada in relation to transfer of the assets and obligations
on pension benefits accrued by contact centre employees prior to 2009, transferred to Aeroplan in 2009.
(4) Before depreciation and amortization.
(5) Includes amortization of Accumulation Partners’ contracts, customer relationships and technology.
(6) Applying the current Breakages estimates, Adjusted EBITDA for the three months ended June 30, 2011 would have been $73.1 million. Adjusted EBITDA for the three months ended June 30,
2011 includes $8.2 million of restructuring and reorganization expenses.
(7) Calculated as: (Free Cash Flow before common and preferred dividends paid, less preferred dividends paid)/ weighted average common shares outstanding.
(8) Constant Currency excludes the translation effect of foreign operations on the consolidated results. For more information on Constant Currency, please refer to Aimia’s August 9, 2012 earnings
press release.
Q2 2012 Financial Highlights 4
5. YTD 2012 CONSOLIDATED FINANCIAL HIGHLIGHTS
Six Months Ended
% Change (1)
June 30,
Year Constant
($ millions except per share amounts) 2012 2011 Over Year Currency (8)
Gross Billings(2) (3) 1,090.9 1,070.3 1.9% 1.5%
Gross Billings from sale of Loyalty Units 800.0 750.9 6.5% 6.6%
Total Revenue 1,072.0 1,053.8 1.7% 1.3%
Cost of rewards and direct costs 602.3 625.4 (3.7%) (4.1%)
(4)
Gross margin 469.7 428.5 9.6% 9.1%
Gross margin (%) 43.8% 40.7% 316 bps 316 bps
Depreciation and amortization(5) 58.6 62.1 (5.7%) (5.9%)
Operating expenses 282.0 277.5 1.6% 1.0%
Operating income 129.0 88.9 45.2% 45.0%
Share of net earnings of PLM 2.7 6.5 na na
Net earnings 79.5 40.5 96.3% na
Non-GAAP
Adjusted EBITDA(3) (6) 190.1 149.1 27.5% 27.3%
Adjusted EBITDA margin (as a % of Gross Billings) 17.4% 13.9% 349 bps na
Free Cash Flow before dividends 92.5 60.4 53.3% na
Free Cash Flow before dividends per common share (7) 0.50 0.30 67.7% na
(1) Discrepancies in variances may arise due to rounding.
(2) Variance in Gross Billings from the prior year includes the impact related to the exit of the Qantas business and the remaining phasing-out of the Visa business of $16.6 million and $3.3 million, respectively.
(3) Gross Billings and Adjusted EBITDA for the six months ended June 30, 2012 includes $5.5 million of compensation received from Air Canada in relation to transfer of the assets and obligations on pension
benefits accrued by contact centre employees prior to 2009, transferred to Aeroplan in 2009.
(4) Before depreciation and amortization.
(5) Includes amortization of Accumulation Partners’ contracts, customer relationships and technology.
(6) Applying the current Breakages estimates, Adjusted EBITDA for the six months ended June 30, 2011 would have been $141.9 million. Adjusted EBITDA for the six months ended June 30, 2011 includes
$9.6 million of restructuring and reorganization expenses and $1.9 million of exit costs associated with the phasing out of a portion of the Visa Business.
(7) Calculated as: (Free Cash Flow before common and preferred dividends paid, less preferred dividends paid)/ weighted average common shares outstanding.
(8) Constant Currency excludes the translation effect of foreign operations on the consolidated results. For more information on Constant Currency, please refer to Aimia’s August 9, 2012 earnings press
release.
Q2 2012 Financial Highlights 5
6. CONSOLIDATED GROSS BILLINGS
Q2 2011 Q2 2012
($ millions) ($ millions)
$554.3 ($5.5) $548.8
$542.4 ($11.9)
$530.5
+2.2% growth; +1.7% in c.c.(1)
+3.4% growth; +2.9% in c.c.(1)
2011 Reported Impact of Qantas Excluding Noted 2012 Reported Pension Settlement Excluding Noted
Business Items Compensation Items
(1) Constant Currency excludes the translation effect of foreign operations on the consolidated results. For more information on Constant Currency,
please refer to Aimia’s August 9, 2012 earnings press release.
Q2 2012 Financial Highlights 6
7. CONSOLIDATED GROSS BILLINGS
YTD June 30,2011 YTD June 30, 2012
($ millions) ($ millions)
($23.8) $1,090.9 ($7.2) ($5.5) $1,078.2
$1,070.3
$1,046.5
+1.9% growth; +1.5% in c.c.(1)
+3.0% growth; +2.6% in c.c.(1)
2011 Reported Impact of Qantas Excluding Noted 2012 Reported Impact of Qantas Pension Excluding Noted
Business Items Business Settlement Items
Compensation
(1) Constant Currency excludes the translation effect of foreign operations on the consolidated results. For more information on Constant Currency,
please refer to Aimia’s August 9, 2012 earnings press release.
Q2 2012 Financial Highlights 7
8. CONSOLIDATED ADJUSTED EBITDA
Q2 2011 Q2 2012
($ millions) ($ millions)
$102.0 ($5.5)
$96.5
$8.2 $85.1
$76.9
+32.7% growth; +32.5% in c.c.(1)
+13.4% growth; +13.2% in c.c.(1)
2 0 11 R e po rt e d R e s t ruc t uring a nd E xc luding N o t e d It e m s 2 0 12 R e po rt e d P e ns io n S e t t le m e nt E xc luding N o t e d It e m s
R e o rga niza t io n C ha rge s C o m pe ns a t io n
Q2’11 margin(2) = 16.0% Q2’12 margin(2) = 17.6%
(1) Constant Currency excludes the translation effect of foreign operations on the consolidated results. For more information on Constant Currency, please refer to Aimia’s
August 9, 2012 earnings press release.
(2) Adjusted EBITDA excluding noted items divided by Gross Billings excluding noted items.
Q2 2012 Financial Highlights 8
9. CONSOLIDATED ADJUSTED EBITDA
YTD June 30, 2011 YTD June 30, 2012
($ millions) ($ millions)
$190.1 ($5.5) $184.6
$11.5 $160.6
$149.1
+27.5% growth; +27.3% in c.c.(1)
+14.9% growth; +14.8% in c.c.(1)
2 0 11 R e p o r t e d R e st r u c t u r i n g a n d Ex c l u d i n g N o t e d I t e m s 2 0 12 R e p o r t e d P e n si o n S e t t l e m e n t Ex c l u d i n g N o t e d I t e ms
R e or ga ni z a t i on Cha r ge s C o m p e n sa t i o n
a n d Vi sa Ex i t C o st s
YTD 2011 margin(2) = 15.3% YTD 2012 margin(2) = 17.1%
(1) Constant Currency excludes the translation effect of foreign operations on the consolidated results. For more information on Constant Currency, please refer to Aimia’s
August 9, 2012 earnings press release.
(2) Adjusted EBITDA excluding noted items divided by Gross Billings excluding noted items.
Q2 2012 Financial Highlights 9
10. FREE CASH FLOW
Free Cash Flow (1) FCF/ Common Share (2)
($ millions)
$92.5 $0.50
$81.5 $0.44
$74.2 $0.41
$60.4
$0.30
$197.6
Q2 2012 Q2 2011 YTD 2012 YTD 2011 Q2 2012 Q2 2011 YTD 2012 YTD 2011
(1) Free Cash Flow before common and preferred dividends paid.
(2) Calculated as: (Free Cash Flow before common and preferred dividends paid, less preferred dividends paid)/ weighted average common shares outstanding.
Q2 2012 Financial Highlights 10
11. CANADA – Q2 2012 FINANCIAL HIGHLIGHTS
Three Months Ended
% Change (1)
June 30,
($ millions) 2012 2011(5) Year Over Year
Gross Billings (2)
Aeroplan 295.0 283.6 4.0%
Proprietary Loyalty 56.1 56.7 (0.9%)
Intercompany eliminations (19.2) (16.2) na
332.0 324.1 2.4%
Total revenue Positive results despite
Aeroplan 274.0 273.4 0.2% challenging market
Proprietary Loyalty 56.2 62.8 (10.5%) conditions
Intercompany eliminations (19.2) (16.2) na
311.0 320.0 (2.8%)
Gross margin (3)
Gross margin (%) 49.0% 44.6% 436 bps
Aeroplan 130.4 115.3 13.1%
Proprietary Loyalty 22.4 27.5 (18.6%)
Intercompany eliminations (0.5) - na
152.4 142.8 6.7%
Operating income (2) (4)
Aeroplan 70.3 54.5 29.1%
Proprietary Loyalty 1.6 6.8 (77.2%)
71.9 61.3 17.3%
Adjusted EBITDA (2) (4)
Adjusted EBITDA margin (as a % of Gross Billings) 32.0% 27.0% 508 bps
Aeroplan 101.6 83.8 21.3%
Proprietary Loyalty 4.7 3.6 31.6%
106.4 87.4 21.8%
Excluding Noted Items
Adjusted EBITDA - Excluding restructuring costs and pension compensation 100.9 90.8 11.1%
Adjusted EBITDA margin (as a % of Gross Billings) 30.4% 28.0% 238 bps
(1) Discrepancies in variances may arise due to rounding.
(2) Gross Billings and Adjusted EBITDA for the three months ended June 30, 2012 includes $5.5 million of compensation received from Air Canada in relation to
transfer of the assets and obligations on pension benefits accrued by contact centre employees prior to 2009, transferred to Aeroplan in 2009.
(3) Before depreciation and amortization.
(4) Includes restructuring and reorganizations charges of $3.4 million for the three months ended June 30, 2011.
(5) Intercompany revenue and expenses related to the comparative period have been reclassified to conform with the presentation adopted in the current period.
Q2 2012 Financial Highlights 11
12. CANADA –YTD 2012 FINANCIAL HIGHLIGHTS
Six Months Ended
% Change (1)
June 30,
($ millions) 2012 2011(5) Year Over Year
Gross Billings (2)
Aeroplan 568.7 558.8 1.8%
Proprietary Loyalty 114.7 115.6 (0.8%)
Intercompany eliminations (38.1) (30.5) na
645.2 644.0 0.2%
Total revenue
Aeroplan 606.4 583.2 4.0%
Proprietary Loyalty 115.5 122.0 (5.3%)
Intercompany eliminations (38.1) (30.5) na
683.8 674.7 1.3%
Gross margin (3)
Gross margin (%) 48.4% 43.4% 491 bps
Aeroplan 284.8 240.3 18.5%
Proprietary Loyalty 46.7 52.9 (11.6%)
Intercompany eliminations (0.9) - na
330.7 293.1 12.8%
Operating income (2) (4)
Aeroplan 163.9 119.2 37.4%
Proprietary Loyalty 5.9 14.8 (60.3%)
169.7 134.0 26.6%
Adjusted EBITDA (2) (4)
Adjusted EBITDA margin (as a % of Gross Billings) 31.5% 27.2% 437 bps
Aeroplan 191.9 160.6 19.5%
Proprietary Loyalty 11.6 14.4 (19.6%)
203.5 175.0 16.3%
Excluding Noted Items
Adjusted EBITDA - Excluding restructuring costs and pension compensation 198.0 178.4 11.0%
Adjusted EBITDA margin (as a % of Gross Billings) 30.7% 27.7% 299 bps
(1) Discrepancies in variances may arise due to rounding.
(2) Gross Billings and Adjusted EBITDA for the six months ended June 30, 2012 includes $5.5 million of compensation received from Air Canada in relation to
transfer of the assets and obligations on pension benefits accrued by contact centre employees prior to 2009, transferred to Aeroplan in 2009.
(3) Before depreciation and amortization.
(4) Includes restructuring and reorganizations charges of $3.4 million for the six months ended June 30, 2011.
(5) Intercompany revenue and expenses related to the comparative period have been reclassified to conform with the presentation adopted in the current period.
Q2 2012 Financial Highlights 12
13. EMEA – Q2 2012 FINANCIAL HIGHLIGHTS
Three Months Ended
% Change (1)
June 30,
Year Constant
($ millions) 2012 2011(5) Over Year Currency (6)
Gross Billings 157.6 137.8 14.4% 13.7%
Total revenue 125.8 104.3 20.6% 20.0%
(2)
Gross margin 38.6 32.3 19.4% 17.9%
Gross margin (%) 30.7% 31.0% (29 bps) (52 bps)
Operating income (loss) (1.8) (9.5) 80.5% 79.1%
(3) (4)
Adjusted EBITDA 12.3 2.1 ** **
Adjusted EBITDA margin (as a % of Gross Billings) 7.8% 1.5% ** **
Excluding Noted Items
12.3 6.4 92.5% 89.6%
Adjusted EBITDA - Excluding restructuring and re-organization costs
Adjusted EBITDA margin (as a % of Gross Billings) 7.8% 4.6% 317 bps 309 bps
(1) Discrepancies in variances may arise due to rounding
(2) Before depreciation and amortization.
(3) Applying the current Breakages estimates, Adjusted EBITDA for the three months ended June 30, 2011 would have been $(1.7) million.
(4) Adjusted EBITDA includes $4.3 million in restructuring and reorganization charges for the three months ended June 30, 2011.
(5) Intercompany revenue and expenses related to the comparative period have been reclassified to conform with the presentation adopted in the current period.
(6) Constant Currency excludes the translation effect of foreign operations on the consolidated results. For more information on Constant Currency, please refer to Aimia’s August 9, 2012 earnings
press release.
** information not meaningful
Q2 2012 Financial Highlights 13
14. EMEA –YTD 2012 FINANCIAL HIGHLIGHTS
Six Months Ended
% Change (1)
June 30,
Year Constant
($ millions) 2012 2011(5) Over Year Currency (6)
Gross Billings 301.5 258.7 16.5% 16.5%
Total revenue 242.8 208.4 16.5% 16.6%
Gross margin (2) 71.6 65.7 9.0% 9.0%
Gross margin (%) 29.5% 31.5% (202 bps) (205 bps)
Operating income (loss) (8.3) (11.8) 30.1% 28.9%
Adjusted EBITDA(3) (4) 15.8 5.4 ** **
Adjusted EBITDA margin (as a % of Gross Billings) 5.2% 2.1% 317 bps 312 bps
Excluding Noted Items
15.8 9.7 63.5% 62.1%
Adjusted EBITDA - Excluding restructuring and re-organization costs
Adjusted EBITDA margin (as a % of Gross Billings) 5.2% 3.7% 151 bps 146 bps
(1) Discrepancies in variances may arise due to rounding.
(2) Before depreciation and amortization.
(3) Applying the current Breakages estimates, Adjusted EBITDA for the six months ended June 30, 2011 would have been $(1.8) million.
(4) Adjusted EBITDA includes $4.3 million in restructuring and reorganization charges for the six months ended June 30, 2011.
(5) Intercompany revenue and expenses related to the comparative period have been reclassified to conform with the presentation adopted in the current period.
(6) Constant Currency excludes the translation effect of foreign operations on the consolidated results. For more information on Constant Currency, please refer to Aimia’s August 9, 2012 earnings
press release.
** information not meaningful
Q2 2012 Financial Highlights 14
15. US & APAC – Q2 2012 FINANCIAL HIGHLIGHTS
Three Months Ended
% Change (1)
June 30,
Year Over Constant
($ millions) 2012 2011(5) Year Currency (6)
(2)
Gross Billings 65.6 81.0 (19.0%) (21.2%)
Total revenue 68.4 83.8 (18.4%) (20.7%)
Gross margin (3) 34.2 35.2 (2.9%) (5.9%)
Gross margin (%) 49.9% 42.0% ** **
Operating income (loss) 0.1 (0.8) Proprietary loyalty services
** **
(4)
Adjusted EBITDA (0.5) (0.9) (formerly50.4% Marketing)
Carlson 49.8%
Adjusted EBITDA margin (as a % of Gross Billings) (0.7%) (1.1%) on track to deliver AEBITDA
** **
% margin of between 6% -
Excluding Noted Items 8%, excluding restructuring
Gross Billings - Excluding Qantas 65.6 69.1 and VISA exit costs.
(5.0%) (7.7%)
Adjusted EBITDA - Excluding restructuring and reorganization costs (0.5) (0.4) (8.0%) (9.4%)
Adjusted EBITDA margin (as a % of Gross Billings) (0.7%) (0.5%) (17 bps) (20 bps)
(1) Discrepancies in variances may arise due to rounding.
(2) Variance in Gross Billings from the prior year for the three months ended June 30, 2012, includes the impact related to the exit of the Qantas business of $11.9 million.
(3) Before depreciation and amortization.
(4) Adjusted EBITDA for the three months ended June 30, 2011 includes $0.5 million of restructuring and reorganization expenses.
(5) Intercompany revenue and expenses related to the comparative period have been reclassified to conform with the presentation adopted in the current period.
(6) Constant Currency excludes the translation effect of foreign operations on the consolidated results. For more information on Constant Currency, please refer to Aimia’s
August 9, 2012 earnings press release.
** information not meaningful
Q2 2012 Financial Highlights 15
16. US & APAC – YTD 2012 FINANCIAL HIGHLIGHTS
Six Months Ended
% Change (1)
June 30,
Year Over Constant
($ millions) 2012 2011(5) Year Currency (6)
Gross Billings (2) 146.6 169.0 (13.3%) (16.1%)
Total revenue 147.7 172.1 (14.2%) (17.0%)
Gross margin (3) 69.5 70.9 (2.0%) (4.9%)
Gross margin (%) 47.1% 41.2% ** **
Operating income (loss) (1.8) (9.9) 81.4% 81.0%
Adjusted EBITDA(4) 1.4 (7.8) Proprietary loyalty services
** **
Adjusted EBITDA margin (as a % of Gross Billings) 0.9% (4.6%) (formerly Carlson Marketing)
** **
on track to deliver AEBITDA
Excluding Noted Items % margin of between 6% -
Gross Billings - Excluding Qantas 139.4 145.2 8%, excluding restructuring (7.3%)
(4.0%)
Adjusted EBITDA - Excluding restructuring, reorganization and Visa exit costs 1.4 (4.0) and VISA ** costs.
exit **
Adjusted EBITDA margin (as a % of Gross Billings) 0.9% (2.4%) 330 bps 327 bps
(1) Discrepancies in variances may arise due to rounding.
(2) Variance in Gross Billings from the prior year for the six months ended June 30, 2012, includes the impact related to the exit of the Qantas business of $16.6 million and
related to the phasing out of a portion of the Visa business of $3.3 million.
(3) Before depreciation and amortization.
(4) Adjusted EBITDA for the six months ended June 30, 2011 includes $1.9 million of restructuring and reorganization expenses and $1.9 million of exit costs associated with
the phasing out of a portion of the Visa Business.
(5) Intercompany revenue and expenses related to the comparative period have been reclassified to conform with the presentation adopted in the current period.
(6) Constant Currency excludes the translation effect of foreign operations on the consolidated results. For more information on Constant Currency, please refer to Aimia’s
August 9, 2012 earnings press release.
** information not meaningful
Q2 2012 Financial Highlights 16
17. CLUB PREMIER (PLM)
2011 2012
Quarter Quarter Quarter Quarter Quarter Quarter
Total
ended ended ended ended ended ended Total
in US$ Wins with existing clients in
March 31, June 30, Sept. 30, Dec. 31, March 31, June 30, YTD 2012
2011
2011 2011 2011 2011 2012 2012 Wins Customer Loyalty and
both with existing clients in
Gross both CustomerLoyalty and
Business Loyalty
$24.5M $28.8M $29.8M $31.9M $115.0M $32.1M $36.4M $68.5M
Business Loyalty
Billings Decrease in Gross Billings
Decrease in Gross by the
mostly explained Billings
Members
Enrolled
2,825,044 2,889,784 2,976,999 3,044,099 3,044,099 3,102,383 phasing explained by the
mostly out of a portion of
3,177,366 3,177,366
the Visa businessportion US
phasing out of a in the of
Partners 57 59 60 64 64 67 72 therepresenting $5.8MMUS
Visa business in the
72
Number representing $5.8MM
of
68,627 72,217 76,912 78,900 296,656 90,890 90,424 181,314
Rewards
Issued
New
Members 38,423 64,740 87,215 67,100 257,478 58,284 74,983 133,267
Enrolled
• Key Q2 2012 metrics include:
− US$36.4 million in Gross Billings (over 26% growth versus prior year)
− More than 30% Adjusted EBITDA margin
• Based on performance to date, we anticipate that Club Premier will be in a position to begin paying dividends before the
end of 2012 without affecting the program’s ability to execute its expansion and capital investment plans
Q2 2012 Financial Highlights 17
18. LIQUIDITY
June 30, December 31, • On April 13, 2012, Aimia
($ millions) 2012 2011 extended the term of its
existing $300 million revolving
facility by 2 years to April 23,
Cash and cash equivalents $200.3 $202.1 2016
Restricted cash 21.5 15.1 • On April 23, 2012, Senior
Secured Notes Series 1 of
Short-term investments 73.1 58.4 $200 million were repaid with
funds drawn from the
Long-term investments in bonds 283.9 279.7 accordion feature of the
revolving facility
$578.8 $555.3
•On May 17, 2012 Aimia issued
Senior Secured Notes 4,
bearing interest at 5.6% in the
Current portion of long-term debt - 200.0 principal amount of $250
million. The notes mature May
Long-term debt 594.8 386.7 17, 2019. The proceeds of the
notes were used to repay
Total Debt $594.8 $586.7 funds drawn on the revolving
facility and for general
corporate purposes
Q2 2012 Financial Highlights 18
19. 2012 OUTLOOK
While it is likely that the higher than forecasted Gross Billings growth rate experienced in the first half of the year in the EMEA region will slow in the second half, EMEA is on track for a strong year and is
compensating for some top line softness in the Canada and US & APAC business segments. As a result, we are reiterating our 2012 annual guidance provided in the February 22, 2012 earnings press release.
For the year ending December 31, 2012, Aimia expects to report the following:
Key Financial Metric Target Range
Consolidated Outlook
Gross Billings Growth 1 Between 3% and 5%
Adjusted EBITDA2 Between $370 and $380 million
Free Cash Flow 2,3 Between $220 million and $240 million
Capital Expenditures To approximate $55 million
Current income tax rate is anticipated to approximate 27% in Canada and 17% in Italy. The Corporation
Income Taxes
expects no significant cash income taxes will be incurred in the rest of its foreign operations.
Business Segment Gross Billings Growth Outlook
Canada Between 2% and 4%
EMEA Between 8% and 11%
US & APAC 1 Between -2% and 2%
Other
Nectar Italia Greater than €60 million in Gross Billings
1. The Gross Billings growth guidance excludes the effect of a client loss (Qantas) in APAC at the end of the first quarter of 2012. The target growth ranges are based on 2011 reported Gross Billings, excluding $40 million related to
Qantas. The client loss will have a negligible impact on Adjusted EBITDA
2. The Adjusted EBITDA and Free Cash Flow outlook range includes an assumption of planned incremental operating expenses in business development activities, principally in the U.S., India and Brazil, technology platform related
expenditures that are operating in nature and additional brand related expenses associated with our new branding, which in total will approximate $20 million in 2012.
3. Free Cash Flow before Dividends
The above guidance excludes the effects of fluctuations in currency exchange rates. In addition, Aimia made a number of economic and market assumptions in preparing its 2012 forecasts, including assumptions regarding
the performance of the economies in which the Corporation operates and market competition and tax laws applicable to the Corporation's operations.
Q2 2012 Financial Highlights 19
21. GROSS BILLINGS
Three Months Ended Six Months Ended
% Change (1) % Change (1)
June 30, June 30,
Year Over Constant Year Over Constant
($ millions) 2012 2011(5) Year Currency (6) 2012 2011(5) Year Currency (6)
Canada
Aeroplan(2) 295.0 283.6 4.0% 4.0% 568.7 558.8 1.8% 1.8%
Proprietary Loyalty 56.1 56.7 (0.9%) (0.9%) 114.7 115.6 (0.8%) (0.8%)
Intracompany eliminations (19.2) (16.2) na na (38.1) (30.5) na na
332.0 324.1 2.4% 2.4% 645.2 644.0 0.2% 0.2%
(3)
EMEA 157.6 137.8 14.4% 13.7% 301.5 258.7 16.5% 16.5%
US & APAC(4) 65.6 81.0 (19.0%) (21.2%) 146.6 169.0 (13.3%) (16.1%)
Intercompany eliminations (0.9) (0.5) na na (2.3) (1.3) na na
Consolidated 554.3 542.4 2.2% 1.7% 1,090.9 1,070.3 1.9% 1.5%
Region
Excluding Noted Items
Excluding Qantas Impact and Pension Compensation 548.8 530.5 3.4% 2.9% 1,078.2 1,046.5 3.0% 2.6%
Canada EMEA Canada EMEA
60% 28% 59% 28%
Three Months Ended Six Months Ended
June 30, 2012 $554.3MM June 30, 2012 $1,090.9MM
US & APAC
US & APAC
13%
12%
(1) Discrepancies in variances may arise due to rounding.
(2) Gross Billings for the three and six months ended June 30, 2012 includes $5.5 million of compensation received from Air Canada in relation to transfer of the assets and obligations on pension benefits
accrued by contact centre employees prior to 2009 transferred to Aeroplan in 2009.
(3) Includes Nectar Italia Gross Billings of €14.0 million and €28.5 million for the three and six month periods ended June 30, 2012.
(4) Variance in Gross Billings from the prior year for the three months ended June 30, 2012 includes the impact related to the Qantas business of $11.9 million and for the six months ended June 30, 2012,
includes the impact related to the Qantas business and the remaining phase-out of the Visa Business of $16.6 million and $3.3 million, respectively.
(5) Intercompany revenue and expenses related to the comparative period have been reclassified to conform with the presentation adopted in the current period.
(6) Constant Currency excludes the translation effect of foreign operations on the consolidated results. For more information on Constant Currency, please refer to Aimia’s August 9, 2012 earnings press release.
Q2 2012 Financial Highlights 21
22. ADJUSTED EBITDA
Three Months Ended Six Months Ended
% Change (1) % Change (1)
($ millions) June 30, June 30,
Year Over Constant Year Over Constant
2012 2011 Year Currency (4) 2012 2011 Year Currency (4)
Canada
Aeroplan Canada 101.6 83.8 21.3% 21.3% 191.9 160.6 19.5% 19.5%
Proprietary Loyalty 4.7 3.6 31.6% 31.6% 11.6 14.4 (19.6%) (19.6%)
106.4 87.4 21.8% 21.8% 203.5 175.0 16.3% 16.3%
EMEA 12.3 2.1 ** ** 15.8 5.4 ** **
US & APAC (0.5) (0.9) 50.4% 49.8% 1.4 (7.8) ** **
Corporate (16.2) (11.7) (38.8%) (38.8%) (30.6) (23.5) (30.5%) (30.5%)
Consolidated(2)(3) 102.0 76.9 32.7% 32.5% 190.1 149.1 27.5% 27.3%
Excluding Noted Items
Adjusted EBITDA - Exluding restructuring, reorganization and Visa
96.5 85.1 13.4% 13.2% 184.6 160.6 14.9% 14.8%
exit costs and pension settlement compensation
(1) Discrepancies in variances may arise due to rounding.
(2) Applying the current Breakages estimates, Adjusted EBITDA for the three and six months ended June 30, 2011 would have been $73.1 million and 141.9 million, respectively. Adjusted EBITDA for the
three and six months ended June 30, 2011 includes $8.2 million and $11.5 million, respectively, of restructuring and reorganization expenses.
(3) Adjusted EBITDA for the three and six months ended June 30, 2012 includes $5.5 million of compensation received from Air Canada in relation to transfer of the assets and obligations on pension
benefits accrued by contact centre employees prior to 2009 transferred to Aeroplan in 2009.
(4) Constant Currency excludes the translation effect of foreign operations on the consolidated results. For more information on Constant Currency, please refer to Aimia’s August 9, 2012 earnings press
release.
Q2 2012 Financial Highlights 22
23. COMMON SHARE REPURCHASE SUMMARY
Average
Common Total
Price Per
Initial NCIB Shares Consideration
Common
Common Shares Repurchased (MM)
Repurchased (MM) Average Price per Common Share
Share
Total Shares Repurchased to May 13, 2011 19,983,631 $233.0 $11.66
$12.58
$12.34
Renewed NCIB
May 16, 2011 – December 31, 2011 6,262,800 $75.8 $12.10
$10.94
January 1, 2012 – May 15, 2012 1,961,900 $24.2 $12.34 13.0 13.2
May 15, 2012 – August 9, 2012 - - -
Initial and Renewed NCIB
Total Shares Repurchased 28,208,331 $333.0 $11.80
2.0
Total Common Shares Outstanding as at:
FY 2010 FY 2011 YTD 2012
March 31, 2012 173.4 million
June 30, 2012 172.0 million
Q2 2012 Financial Highlights 23
24. AEROPLAN – REVENUE AND MILES
Revenue Breakdown
Three Months Ended June 30,
(in $ millions) 2012 2011 Change % Change
Miles revenue 215.0 215.0 0.0 0.0 %
Breakage revenue 46.7 46.8 (0.1) ( 0.2)%
Other 12.3 11.6 0.7 0.6 %
Total Revenue 274.0 273.4 0.6 0.2 %
Aeroplan Miles Issued & Redeemed Average Selling Price & Cost
(billions) (cents / mile)
22.7
21.8
1.22 1.25
17.5 17.6
0.90
0.82
Q2 2012 Q2 2011 Q2 2012 Q2 2011
Aeroplan Miles Issued Aeroplan Miles Redeemed Average Selling Price Average Cost/ Aeroplan Mile Redeemed
Q2 2012 Financial Highlights 24
25. GROSS BILLINGS FROM SALE OF LOYALTY UNITS BY
MAJOR PARTNER
Q2 2012 Gross Billings Q2 2011 Gross Billings
from sale of Loyalty Units from sale of Loyalty Units
22.8% 21.8%
34.4%
35.9%
$414.0M $388.2M
15.2% 17.7%
10.7% 16.9% 15.7%
8.9%
Partner A Partner B Partner C Air Canada Other
Q2 2012 Financial Highlights 25
26. GROSS BILLINGS FROM SALE OF LOYALTY UNITS BY
MAJOR PARTNER
YTD Q2 2012 Gross Billings YTD Q2 2011 Gross Billings
from sale of Loyalty Units from sale of Loyalty Units
22.9% 21.1%
34.0% 35.3%
$800.0M $750.9M
16.3% 18.9%
16.5% 15.5%
10.3% 9.2%
Partner A Partner B Partner C Air Canada Other
Q2 2012 Financial Highlights 26
27. FOREIGN EXCHANGE RATES
Period Rates Q2 2012 Q2 2011 Change % Change
Period end rate £ to $ 1.6002 1.5492 0.0510 3.3%
Average quarter £ to $ 1.5983 1.5784 0.0199 1.3%
Average YTD £ to $ 1.5858 1.5784 0.0074 0.5%
Period end rate AED to $ 0.2789 0.2625 0.0164 6.2%
Average quarter AED to $ 0.2749 0.2634 0.0115 4.4%
Average YTD AED to $ 0.2738 0.2695 0.0043 1.6%
Period end rate AED to £ 0.1743 0.1700 0.0043 2.5%
Average quarter AED to £ 0.1719 0.1669 0.0050 3.0%
Average YTD AED to £ 0.1726 0.1684 0.0042 2.5%
Period end rate USD to $ 1.0248 0.9643 0.0605 6.3%
Average quarter USD to $ 1.0098 0.9678 0.0420 4.3%
Average YTD USD to $ 1.0059 0.9769 0.0290 3.0%
Period end rate € to $ 1.2889 1.4006 (0.1117) (8.0%)
Average quarter € to $ 1.2969 1.3920 (0.0951) (6.8%)
Average YTD € to $ 1.3049 1.3699 (0.0650) (4.7%)
Q2 2012 Financial Highlights 27