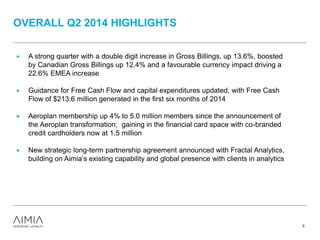
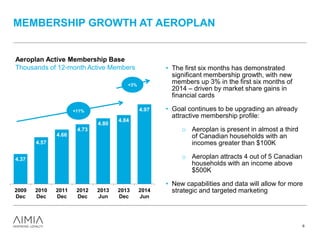
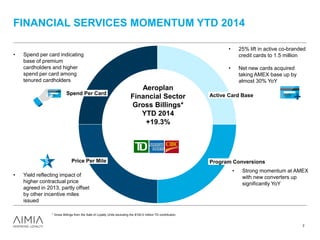
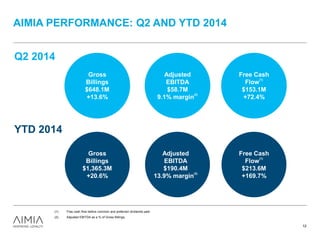
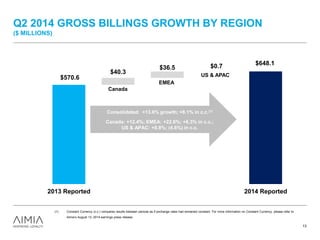
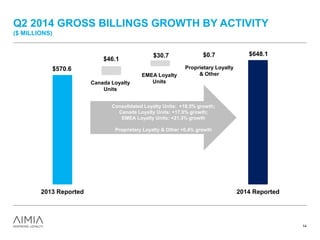
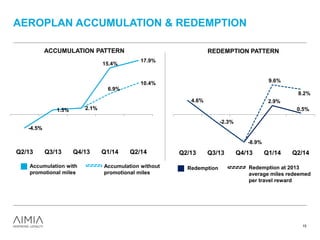
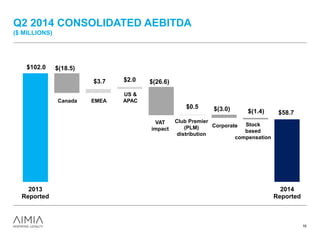
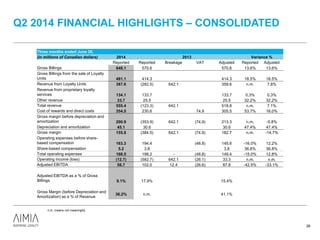
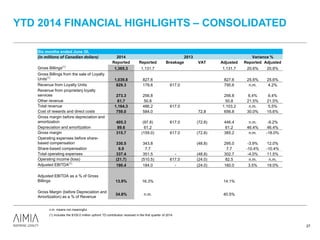
- Aimia reported strong financial results for Q2 2014, with gross billings up 13.6% and free cash flow up 72.4%
- Aeroplan membership grew 4% to 5 million members since announcing its transformation, with co-branded credit cardholders reaching 1.5 million
- A new long-term partnership with Fractal Analytics was announced to build on Aimia's existing analytics capabilities
- Gross billings for Q1 2014 were $717.2 million, an increase of 27.8% over Q1 2013, boosted by a $100 million contribution from TD related to Aeroplan program changes.
- Adjusted EBITDA was $132.6 million for Q1 2014, an increase of 60.1% over Q1 2013.
- Free cash flow before dividends paid was $60.5 million for Q1 2014, compared to negative $9.5 million for Q1 2013, driven by strong growth in gross billings and lower than expected redemptions.
This document provides highlights from BI&P's 1Q 2015 results presentation. Key points include:
- The expanded credit portfolio totaled R$3.9 billion, down 6.8% from the previous quarter due to a more conservative lending policy.
- Funding totaled R$4.1 billion, down 7.2% from the previous quarter.
- Net income was a loss of R$6.7 million, up from a R$5.1 million loss in 1Q 2014. Expenses continue to be controlled while the bank works to achieve economies of scale.
In 3 sentences:
Aimia reported strong financial results for Q4 2014 and FY 2014, meeting or exceeding guidance across key metrics like gross billings and adjusted EBITDA. The Aeroplan program transformation delivered exceptional growth results but also impacted margins as expected due to factors like welcome bonus miles and marketing programs. While some challenges were expected from economic factors in certain regions, Aimia provided guidance for continued growth in 2015 supported by its global coalition programs and proprietary loyalty solutions.
- The document discusses Aimia's Q3 2013 financial highlights and year-to-date 2013 consolidated financial results. Key highlights include 7.4% growth in gross billings and 4.5% growth in adjusted EBITDA compared to last year.
- Gross billings growth was driven by strong performance in US & APAC (+29.5% cc) and Canada (+3.2%), partially offset by declines in EMEA (+1.7% cc).
- On a year-to-date basis, gross billings increased 4.9% to $1.7 billion. However, operating income declined due to a $683.6 million breakage adjustment related to changes in the
- Q3 2014 highlights include strong performance in Canada driven by continued momentum with financial card partners and the refreshed Aeroplan program. EMEA growth slowed due to coalition programs.
- Gross billings increased 9.8% in Q3 driven by growth in Canada and proprietary loyalty businesses, offset by declines in US and APAC.
- Adjusted EBITDA was $63.9 million in Q3. Free cash flow before dividends was $56.3 million.
- 2014 guidance is confirmed with expected gross billings growth between 7-9% and adjusted EBITDA margin of approximately 12%.
Aeroplan is transforming its Canadian coalition loyalty program to focus on delivering greater member value. The transformation includes new 10-year agreements with TD and CIBC to be the exclusive issuers of Aeroplan credit cards. This provides a stable platform for growth. The changes are aimed at addressing points of vulnerability and providing a differentiated experience through a multi-year effort to rework the member experience. The goal is modest membership growth and higher revenues by upgrading members to drive more strategic use of miles and deliver outstanding value to members and partners.
The document discusses Aimia's financial outlook and investments to grow. It notes that Aimia has a track record of growing gross billings and free cash flow. It also focuses on returning value to shareholders through dividend increases and share repurchases. The document outlines details of new long-term financial credit card agreements with TD and CIBC that are expected to drive Aeroplan program growth. It provides financial implications and targets for 2013-2015, including higher gross billings, adjusted EBITDA, and free cash flow. Aimia has a strong balance sheet to support further investments in emerging markets and capabilities.
Forward-Looking Statements
Statements contained in this presentation that are not historical facts are forward looking statements which involve certain risks and uncertainties including, but not limited to, risks associated with the uncertainty of managing rapidly changing technologies, limited access to capital, competition, the ability to attract and retain qualified employees, our ability to execute our strategy, the uncertainty of the future performance of our partner companies, acquisitions and dispositions of additional partner companies, the inability to manage growth, government regulation and legal liabilities and the effect of economic conditions in the business sectors in which our partner companies operate, negative media coverage and other uncertainties as described in our filings with the Securities and Exchange Commission, including our Annual Report on Form 10-K.
Safeguard does not assume any obligation to update any forward looking statements or other information contained in this presentation.
The document provides highlights for Q2 2013, including:
- Gross billings increased 2.9% with growth in US&APAC and EMEA offsetting a decline in Canada.
- Adjusted EBITDA was relatively flat as a VAT adjustment and breakage income offset declines in Canada, US&APAC, and increased corporate costs.
- Financial results in EMEA benefited from the VAT decision and higher volumes, while US&APAC results reflected investments offsetting the impact of acquisitions.
This presentation summarizes BI&P's results for the fourth quarter of 2014. Some key highlights include:
- The expanded credit portfolio totaled R$4.1 billion, growing 3.6% in the quarter and 6.9% year-over-year.
- Loans originated in 4Q14 totaled R$1.4 billion. Nearly all new loans were rated between AA and B.
- Funding totaled R$4.4 billion, up 4.8% in the quarter and 12.6% year-over-year through diversification.
- Income from fees was R$14 million in 4Q14 and R$56 million in 2014, up 94.4%
This document contains slides from an AIMIA credit rating agency presentation from September 2014. It discusses AIMIA's financial performance in Q2 and the first half of 2014, with Gross Billings up 13.6% and 20.6% respectively. Free Cash Flow was also up significantly for the quarter and year-to-date. The presentation provides details on the drivers of growth and updates AIMIA's guidance targets for 2014.
BI&P Banco reported its 4th quarter 2014 earnings. Key highlights include:
- Expanded credit portfolio totaled R$4.1 billion, up 3.6% in the quarter and 6.9% year-over-year.
- Funding totaled R$4.4 billion, increasing 4.8% in the quarter and 12.6% year-over-year.
- Income from services rendered and tariffs was R$14.0 million in 4Q14 and R$56.0 million in 2014, up 94.4% from 2013 mainly from investment banking revenues.
- Guide Investimentos, the bank's investment arm, had assets under management of R$
Amg investor presentation november 2014 finaljdiluzio
The document is an investor presentation for AMG Advanced Metallurgical Group N.V. It provides an overview of AMG, including its business segments of AMG Processing, AMG Mining, and AMG Engineering. Key financial highlights are presented, showing AMG's revenue, EBITDA, gross profit, and progress on reducing debt and improving cash flow. The presentation contains forward-looking statements and disclaimers around the information provided.
Aveda Energy investor presentation June 2014AvedaEnergy
This corporate presentation provides an overview of Aveda Transportation and Energy Services Inc., a growing provider of specialized oilfield hauling and rentals in the US and Western Canada. It discusses Aveda's business segments in oilfield hauling and rentals, including services like rig moving, heavy hauling, and equipment rentals. The presentation notes that Aveda was founded in 1994 and went public in 2006, and is now well-positioned to pursue organic and acquisition growth opportunities across North America through its hauling and rentals businesses. It also lists some of Aveda's management team and provides a basic company overview.
Genworth MI Canada Inc. - Investor Presentation May/June 2013genworth_financial
1) Genworth MI Canada Inc. reported solid results for the first quarter of 2013, with net operating income of $85 million, an operating return on equity of 12%, and operating earnings per share of $0.86.
2) The company wrote $84 million in new mortgage insurance premiums in Q1 2013 and maintained a strong capital position with a minimum capital test ratio of 216%.
3) The company has a high quality investment portfolio of $5.3 billion, with 49% invested in federal and provincial bonds and a pre-tax yield of 3.7%.
This 3-sentence summary provides an overview of the key points from the investor presentation:
1) Multiplus is a growing loyalty network in Brazil with around 9 million members, 20 billion points sold in 3Q11, and almost 170 partnerships.
2) Multiplus has an innovative business model with low CAPEX requirements and strong cash generation from points selling, redemption processing fees, and point expiration.
3) The presentation outlines Multiplus' strategy to diversify its gross billings and redemptions across more partners and redemption categories to expand margins over the long term.
Citigroup will introduce format changes to its financial supplement accompanying its first quarter earnings release on April 14th. The changes relate to the presentation of existing business segments and do not reflect changes to the underlying businesses. Major changes include presenting Global Consumer products from a North America and International perspective, consolidating Cards and Consumer Finance disclosure, combining Consumer Assets with Retail Banking, excluding Private Client Services from the Corporate and Investment Bank, and adding detail to Private Client Services disclosure. The changes also include identifying realized gains and losses for different business lines and consolidating geographic regions for Europe, Middle East, Africa, India, and Asia into single reporting units.
September 2016 general investor presentationv v final 9 14-16irbgcpartners
BGC Partners reported strong year-over-year growth in distributable earnings for the second quarter of 2016 and full year 2015. For the second quarter, pre-tax distributable earnings increased 6.7% year-over-year driven by growth in the Financial Services segment, particularly in its fully electronic FENICS business. BGC's business is diversified by geography, asset class, and between its Financial Services and Real Estate Services segments. The company has a track record of successful acquisitions that have been accretive to earnings.
Level 3 Communications provides an investor presentation overviewing its global network, comprehensive product portfolio, and strategy. The strategy focuses on enterprise customers, expanding the network, delivering a superior customer experience, and evolving the product portfolio. Financial highlights include steady revenue growth, improved profitability, and reduced leverage over time through prudent capital allocation. The global network, product breadth, and focus on complex customer solutions position Level 3 for continued growth.
Principal Financial Group reported strong financial results for the first quarter of 2014, with record total company operating earnings and assets under management. Several business segments saw improved performance, including Retirement and Investor Services which saw growth in net revenue and margins. Principal Global Investors also had solid results with record assets under management. Principal International reported record operating earnings despite some macroeconomic headwinds. The company deployed capital through dividends, share repurchases, and debt redemption and expects full-year capital deployment to be at the high end of its $500-700 million target range.
This document summarizes Principal Financial Group's first quarter 2016 earnings call. Some key points:
- Outstanding investment performance with over 90% of investment options in the top two Morningstar quartiles.
- Record assets under management of $548 billion with $3.3 billion in net cash flows for the quarter.
- Deployed $196 million in capital through share repurchases and dividends. Announced an increase in the second quarter dividend.
- Underlying fundamentals remain strong despite macroeconomic headwinds.
BGC Partners reported strong financial results for the second quarter of 2017. Total revenues increased 12.8% to $737.8 million compared to the second quarter of 2016. Pre-tax distributable earnings were $131.5 million, up 27% year-over-year, resulting in a pre-tax distributable earnings margin of 17.8%. Financial services revenues grew 10% to $432.3 million, while pre-tax earnings increased 38% to $111 million and the pre-tax margin expanded over 500 basis points. Real estate services revenues rose 16.6% to $295.3 million, with pre-tax earnings up 38% and margins improving 190 basis points. BGC also announced
The document provides financial results for Level 3 Communications for the second quarter of 2016. Some key highlights include:
- Core Network Services revenue grew 5.3% year-over-year. North America CNS revenue grew 5.9% and Latin America grew 9.6%.
- Adjusted EBITDA increased 10% to $715 million. Free cash flow was $264 million.
- The company lowered its net debt to adjusted EBITDA leverage ratio to 3.5x.
- For full year 2016, the company expects adjusted EBITDA growth of 10-12% and free cash flow of $1-1.1 billion.
This document summarizes Sprint's fiscal first quarter 2016 results conference call. Some key highlights include:
- Highest postpaid phone net additions in 9 years and best postpaid phone churn in company history.
- Wireless revenue grew 1% year-over-year while aggressively reducing cash operating expenses.
- Nearly $11 billion in liquidity following financing transactions that doubled committed liquidity.
- Adjusted EBITDA of $2.5 billion, up from $2.1 billion year-over-year due to expense reductions and stable revenues.
- Adjusted free cash flow of $466 million, improved by $2.7 billion year-over-year due to lower expenses and capital spending.
This document is an investor presentation for Intact Financial Corporation, the largest property and casualty insurer in Canada. Some key points:
- Intact has over $7 billion in direct premiums written and is the largest P&C insurer in Canada.
- It has outperformed the P&C industry over the past 10 years in terms of premium growth, return on equity, and combined ratio.
- Intact aims to continue beating the industry ROE by 5 points annually through initiatives like pricing and claims management improvements.
Citigroup reported strong financial results for the second quarter of 2003, with net income of $4.30 billion, up 12% from the previous year. Income per share was $0.83, rising 14% over 2002. Several business lines saw significant income growth, including Retail Banking income up 63% and the Private Bank's sixth consecutive record quarter. However, some international operations struggled, with income down 24% in Japan. Overall, Citigroup achieved record revenues of $19.4 billion for the quarter, up 8% from the prior year, demonstrating continued strong performance.
Why Own Safeguard?
- Full Value Yet to be Realized
- Ownership Stakes in Exciting Partner Companies
- Top Performance of Proven Team
- Financial Strength, Flexibility and Liquidity
- Strong Alignment of Interests
Forward-Looking Statements
Statements contained in this presentation that are not historical facts are forward looking statements which involve certain risks and uncertainties including, but not limited to, risks associated with the uncertainty of managing rapidly changing technologies, limited access to capital, competition, the ability to attract and retain qualified employees, our ability to execute our strategy, the uncertainty of the future performance of our partner companies, acquisitions and dispositions of additional partner companies, the inability to manage growth, government regulation and legal liabilities and the effect of economic conditions in the business sectors in which our partner companies operate, negative media coverage and other uncertainties as described in our filings with the Securities and Exchange Commission, including our Annual Report on Form 10-K.
Safeguard does not assume any obligation to update any forward looking statements or other information contained in this presentation.
This document provides an overview of Thor Industries, Inc., a leading manufacturer of recreational vehicles. It discusses Thor's history, leadership position in the RV industry, financial performance, competitive advantages, and outlook. Key points include Thor being the largest RV manufacturer in North America, with a diverse product portfolio and decentralized operating structure. The presentation also notes trends in the recovering RV market and consumer demand. Forward-looking statements are made regarding future growth opportunities and maintaining a balanced approach.
Aimia's global strategy focuses on leading the loyalty market through four strategic pillars: 1) Breaking away from competitors by delivering distinctive value in owned programs and analytics capabilities, 2) Codifying and replicating successful coalition models globally, 3) Strengthening their current position, and 4) Evolving their operating model. The company aims to differentiate by investing in unique customer insights and data-generating assets. Aimia's member-centric approach centers on enabling customers to interact, share, and control their loyalty experience through personalized communications and a social graph.
Aeroplan is transforming its Canadian coalition loyalty program model to focus on delivering greater member value. Key changes include introducing a new Distinction program that provides differentiated recognition and rewards to high-value members based on their spending levels and travel, reworking agreements with financial partners TD and CIBC to introduce enhanced credit cards and drive growth, and improving travel rewards to offer more availability and value for members. The transformations aim to strengthen Aeroplan's market leadership position by better engaging premium members and generating higher revenues over the long term.
The document discusses forward-looking statements and risks associated with forecasts and predictions. It notes that Aimia is a multinational loyalty company that offers coalition loyalty programs, loyalty data analytics, and proprietary loyalty services worldwide. It delivers value to commercial partners in various industries in many countries and regions.
This document provides highlights from Aimia's Q4 2015 results and includes forward-looking statements about Aimia's financial metrics and performance in 2016. It cautions that Aimia's statements involve assumptions that may prove to be incorrect and do not account for special items or new transactions. It also defines several non-GAAP financial measures used by Aimia to evaluate performance and measure compliance with debt covenants.
The annual general meeting of Aimia Inc. was held on May 14, 2013. Robert Brown, the Chairman of the Board of Directors, presented highlights from the previous year including a 2.3% increase in gross billings and strong financial performance in 2012 with $402.6 million in adjusted EBITDA. David Adams, the EVP and CFO, then provided an overview of Aimia's financial results and 2013 guidance. Rupert Duchesne, the Group CEO, discussed Aimia's leadership in the loyalty industry with its global scale and proprietary analytics capabilities.
- Q3 2011 saw record gross billings, adjusted EBITDA, and strong free cash flow for Aimia. Gross billings increased 4.1% year-over-year to $541.8 million.
- Adjusted EBITDA grew significantly by 83.5% to $104.2 million compared to Q3 2010. Free cash flow before dividends paid was $124.8 million.
- For the first nine months of 2011, gross billings increased 1.1% to $1.6 billion. Adjusted EBITDA rose 25.8% to $252.7 million, driven by growth across the business.
Aimia confirmed its 2012 consolidated guidance, expecting to be at or above the top end of its guided ranges for adjusted EBITDA and free cash flow, and at the low end of the range for gross billings. For the third quarter of 2012, gross billings increased 1.4% to $529.8 million and adjusted EBITDA decreased 6.4% to $95.4 million, excluding noted items. Year-to-date, gross billings increased 2.5% to $1,615.3 million and adjusted EBITDA increased 7.1% to $280.4 million, excluding noted items. Aimia expects its full year performance to meet 2012 guidance.
The document outlines plans to transform Aeroplan over the next decade to drive member engagement and growth. Key announcements include:
1. Launching a new tiered recognition program called Distinction based on total miles earned across partners.
2. Replacing ClassicPlus Flight Rewards with new Market Fare Rewards offering 20-50% fewer miles for redemptions.
3. Extending their agreement with TD as the financial card partner for 10 years beginning January 1, 2014.
The changes are aimed at maintaining Aeroplan's leadership in the Canadian loyalty landscape by innovating the program to better reward members.
- Aimia achieved or surpassed its guidance for all metrics in 2013, with strong underlying performance across regions.
- Gross billings grew 4.5% on a constant currency basis for the year. Adjusted EBITDA was $350.5 million for the year, excluding conveyance items.
- Free cash flow was above guidance at $268.1 million for the year, excluding conveyance items. The company also continued growing its annual common share dividends.
Aeroplan is transforming its Canadian coalition loyalty program model to focus on delivering greater member value. Key changes include introducing a new Distinction program that provides differentiated recognition and rewards to high-value members based on their spending levels and travel, reworking agreements with financial partners TD and CIBC to introduce enhanced credit cards and drive growth, and improving travel rewards to offer more availability and value for members. The transformations aim to strengthen Aeroplan's market leadership position by better engaging premium members and generating higher revenues over the long term.
Aimia's Q1 2015 highlights saw adjusted EBITDA increase approximately 60% year-over-year due to strong performance across regions. Gross billings declined slightly by 3.6% excluding the prior year contribution from TD, with growth in Canada and EMEA offset by declines in US and APAC. Free cash flow was positive at $5.2 million compared to negative $39.5 million in the prior year. Aimia reiterated its full year 2015 guidance targets.
Principal Financial Group reported strong second quarter 2014 earnings. Some key points:
- Record total company operating earnings were up 19% over second quarter 2013.
- Approximately 90% of investment options are in the top half of Morningstar rankings over 3 and 5 years.
- Assets under management surpassed $518 billion, a record high.
- International operations grew operating earnings by 13% on a normalized local currency basis.
- The company continued strong capital deployment including a 31% increased dividend and $61 million in share repurchases in the quarter.
This document summarizes the key points from Principal Financial Group's third quarter 2014 earnings call. It discusses Principal's continued strong financial performance, including record operating earnings of $354 million. It highlights the continued execution across Principal's business segments, including strong investment performance, net cash flows, and returns. The document also provides an overview of Principal's capital deployment activities and upcoming investor events.
This document summarizes Principal Financial Group's third quarter 2014 earnings call. It provides non-GAAP financial measures to help investors understand the company's normal ongoing operations. These measures are also used internally for goal setting and compensation. The document discusses strong investment performance across time periods. It highlights earnings and growth in different business segments, including retirement services, guaranteed income, Principal Global Investors, and international operations. Normalizing items are identified to show the underlying growth in operating earnings.
Aimia's global strategy is focused on becoming the recognized global leader in loyalty by:
1) Breaking away from competitors by delivering distinctive programs and leading loyalty analytics capabilities.
2) Codifying and replicating successful loyalty models globally.
3) Strengthening their position in existing markets, verticals, countries, and customer segments.
4) Evolving their operating model through product and commercial model improvements.
The strategy aims to drive an attractive long-term investment proposition for shareholders through growth opportunities while maintaining a diversified and cash flow generating business model.
Q3 2015 Canadian Tire Corporation Earnings Conference Call PresentationInvestorCanadianTire
The document summarizes Canadian Tire Corporation's third quarter 2015 financial results. It reports that consolidated revenue increased 5.3% excluding petroleum, and diluted EPS grew 20.5%. Same-store sales increased at Canadian Tire, FGL Sports, and decreased slightly at Mark's. Financial Services saw growth in credit card receivables but a decline in income before taxes. The quarter also saw a dividend increase and an intent to repurchase shares by the end of 2016.
This document provides an overview of Winnebago Industries' presentation at the Baird ESG Investor Conference on February 24, 2021. It begins with forward-looking statements and disclaimers, then discusses the company's strategic priorities, transformation, financial results, capital allocation, leverage ratio, and outlook for strong interest in the outdoors. The presentation highlights Winnebago's leadership in premium outdoor lifestyle brands and diversification across RV, marine, and specialty vehicles. It summarizes the company's focus on innovation, quality, service, and building lifetime customer intimacy.
Jan-Pieter Lips discusses transforming Aimia's coalitions in EMEA. He highlights Nectar UK's strong momentum with growth in members and points issuance. Nectar has strengthened member and partner value through successful initiatives like Summer Double Value. Air Miles Middle East saw increased activity after refreshing its value proposition. Breaking into new areas, Nectar launched with eBay and innovated with Oxfam. Codifying successful models could unlock growth, such as trialling Nectar Local in Italy. The presentation outlines pillars to drive continued EMEA coalition leadership through strengthening existing programs, breaking into new areas, and codifying transferable success.
Jan-Pieter Lips discusses transforming Aimia's coalitions in EMEA. He outlines strategies to strengthen existing coalitions like Nectar UK and Air Miles Middle East by increasing member value and engagement. He also discusses breaking away from competitors by embracing digital with partnerships like eBay and using data insights innovatively with Oxfam. Finally, he talks about codifying successful models like Nectar UK to launch new programs in other regions, such as a pilot with small businesses in Italy. The overall aim is to continue driving leadership in EMEA coalitions.
Multiplus is a leading loyalty program company in Brazil that sees opportunities for continued growth given the early stages of loyalty program penetration in Brazil. It has a strong partnership network including LATAM Airlines and local banks. Multiplus has a four year track record of shareholder returns through dividends and is improving its governance. The Brazilian loyalty industry is poised for solid growth driven by increasing credit card usage, consumption, air travel and wealth distribution in Brazil. Multiplus' strategy focuses on network diversification, member engagement and value delivery to partners to drive sustainable growth.
Masonite presented its 2015 Fourth Quarter Earnings. Key highlights included:
- Housing starts in the US grew 10.8% in 2015 while single family starts rose 10.4%, however single family declines in Canada offset some gains.
- Masonite's financial results improved due to strategy execution, with gross profit growth of 32% and adjusted EBITDA growth of 49% in 2015.
- Initiatives focused on expanding product offerings and consideration, including most new products introduced in nine years and transitioning to Masonite branded doors at Lowe's.
This document provides an overview of Tribune Publishing Company's strategy and financial performance. The key points are:
1) Tribune Publishing owns iconic media brands in major markets and aims to build on its leading local print and digital presence while accelerating the digital transition.
2) In Q3 2014, revenues declined 4.7% year-over-year due to lower advertising sales, while expenses were flat.
3) The company maintains a conservative balance sheet and allocates capital strategically to acquisitions, debt repayment, and returns to shareholders.
This document provides an overview and summary of Tribune Publishing Company's third quarter 2014 financial performance. Key points include:
- Total operating revenues decreased 4.7% to $404 million for Q3 2014 compared to the prior year.
- Total operating expenses increased 0.7% to $399.5 million for Q3 2014.
- Advertising revenues decreased 9.5% to $220.8 million for Q3 2014, driven by declines in retail, national, and classified advertising. Circulation revenues increased slightly by 1.2% to $107.5 million.
1) Aimia aims to codify and replicate its successful loyalty program models globally to strengthen existing coalitions and build new ones. It seeks to leverage its coalition, analytics, and proprietary intellectual property across geographies.
2) Key aspects of Aimia's models that it seeks to codify globally include coalition value creation, member and partner management, liability management, redemption fulfillment, and reward design.
3) Aimia believes that by applying its advantaged intellectual property, such as member management technology and supply chain expertise, it can gain a competitive advantage in new coalitions.
- Canadian Tire Corporation reported strong first quarter 2016 financial results, with consolidated revenue excluding petroleum increasing 4.3% and retail EBITDA rising 8.8%.
- Same store sales increased 1.0% at Canadian Tire, 7.6% at FGL Sports, and 0.8% at Mark's.
- Financial Services income before taxes was down 7.1% for the quarter due to lower loan growth and number of active accounts, though investments are aimed at driving growth in the second half of 2016.
- Higher income was reported at the Retail and CT REIT segments, though Financial Services income declined and expenses increased across segments.
- This document contains Quintiles' earnings presentation for the fourth quarter of 2014.
- Key highlights include 22.2% net new business growth, 9.3% constant currency service revenue growth, and 29.1% diluted adjusted earnings per share growth for Q4.
- For the full year 2014, Quintiles saw 10.1% constant currency service revenue growth, 31.1% diluted adjusted EPS growth, and $11.24 billion in diversified backlog.
Similar to Aimia Reports Second Quarter Results (20)
This document provides highlights from Aimia's Q3 2017 results, including forward-looking statements about certain financial metrics for 2017. Such statements involve assumptions and are subject to risks and uncertainties that could cause actual results to differ materially. Slides 13-14, 19, 27, 38-39, 41, 43 and 54 contain specific forward-looking statements about 2017 financial metrics, based on general economic assumptions that may prove incorrect. The document also contains non-GAAP financial measures and reconciliations to GAAP measures.
The document provides highlights from Aimia's Q2 2017 results, including forward-looking statements about certain financial metrics for 2017. These statements involve assumptions that may prove to be incorrect. In addition, the statements do not reflect the potential impact of non-recurring items, transactions, or changes that could occur after the date of the document. Actual results could differ materially from the forward-looking statements. The document also contains non-GAAP financial measures and provides definitions and reconciliations to the most comparable GAAP measures.
This document provides highlights from Aimia's Q1 2017 results, including forward-looking statements about certain financial metrics for 2017. Such statements involve assumptions and are subject to risks and uncertainties that could cause actual results to differ materially. It also contains non-GAAP financial measures and reconciliations to GAAP measures. The document cautions that the assumptions used to make forward-looking statements about 2017 may prove incorrect or inaccurate.
This document provides highlights from Aimia's Q4 2016 results, including forward-looking statements about Aimia's financial metrics and performance in 2017. It also defines and reconciles several non-GAAP financial measures used by Aimia to measure performance, such as adjusted EBITDA and free cash flow, noting that these measures are not comparable to similar measures used by other companies. Finally, it cautions that Aimia's forward-looking statements are based on assumptions that may prove to be incorrect and are subject to various risks and uncertainties.
Aimia reported its Q3 2016 highlights. Gross billings decreased 3.8% year-over-year but were down only 0.4% excluding foreign exchange impacts. Adjusted EBITDA increased to $60.5 million compared to $46.1 million in Q3 2015, with the margin expanding to 10.8% from 7.9%. Free cash flow before dividends paid was $86.7 million compared to $59 million driven by higher EBITDA, lower capital expenditures and tax refunds. On a trailing twelve-month basis, free cash flow per share increased over 20% to $0.55 compared to $0.67 in Q3 2015.
This document highlights Aimia's Q2 2016 results and provides forward-looking statements about Aimia's financial metrics and performance in 2016. It cautions that these forward-looking statements are based on assumptions that may prove to be incorrect and are subject to various risks and uncertainties. It also notes that Aimia's actual results could differ materially from the forward-looking statements presented. The document defines various non-GAAP financial measures used by Aimia and refers readers to Aimia's MD&A for reconciliations of these measures to comparable GAAP measures.
- The document discusses Aimia's Q1 2016 highlights and financial results. It provides forward-looking statements and cautions that actual results may differ materially from expectations.
- Gross billings decreased 3.7% to $573.0 million due to lost contracts, lower reward fulfillment activity, and wind downs, partially offset by new client wins. Adjusted EBITDA was $50.6 million.
- Key highlights included stability in Aeroplan's financial cards business, a new ISS win with Aeon Retail, and progress on Aimia's operating cost reduction initiatives.
- Aimia changed its organizational structure from a regional to line of business structure effective January 1, 2016 to focus on its core loyalty businesses. The new structure has 3 operating segments: Americas Coalitions, International Coalitions, and Global Loyalty Solutions.
- In 2015, Aimia's gross billings were $2.5 billion, with 61% from Americas Coalitions, 29% from International Coalitions, and 10% from Global Loyalty Solutions. Adjusted EBITDA was $263 million.
- The new structure aims to simplify Aimia's operations, focus the company on data-driven marketing and loyalty analytics for growth, and provide supplemental financial information on the segments.
- Q3 2015 highlights document from Aimia provides forward-looking statements and cautions that actual results may differ materially from projections.
- It outlines Aimia's non-GAAP financial measures including Adjusted EBITDA and Adjusted Net Earnings which are used to evaluate performance but are not comparable to GAAP measures.
- The document reports Q3 2015 consolidated Adjusted EBITDA of $49.1 million, down from $63.9 million in Q3 2014, and updates 2015 guidance for lower Gross Billings and Adjusted EBITDA compared to previous targets.
Aimia's Q2 2015 highlights document includes forward-looking statements about financial metrics for 2015 that are based on assumptions and subject to various risks and uncertainties. It also contains non-GAAP financial measures to provide additional metrics to evaluate performance. The document provides definitions and reconciliations for adjusted EBITDA, adjusted net earnings, adjusted net earnings per share, free cash flow, and other non-GAAP measures.
The document lists several internship and temporary positions available at a global loyalty management company and event management company. The positions include marketing, business development, account management, IT, and event coordination intern roles located in Minneapolis, MN and Dayton, OH. The summaries provide high-level overviews of responsibilities, qualifications, and how to apply for each opportunity.
The document describes several internship and temporary positions available at a customer loyalty company. The positions include an Account Management Intern, Business Development Intern, IT Intern, Marketing Operations Intern, Marketing Intern, and Temporary Event Manager. The summaries provide high-level overviews of what each role entails, qualifications sought, and how to apply.
Charles Humphreys is the Managing Director of Cardlytics UK. Cardlytics is a global leader in card-linked marketing with a real-time marketing and analytics platform. It has partnerships with over 400 financial institutions in the US, including Bank of America. In the UK, Cardlytics launched a proposition in September 2013 with Lloyds Banking Group and their Halifax brand. Cardlytics models balance the needs of financial institutions, customers, and retailers/brands by providing revenue through rewards funded by advertisers, increasing card usage and engagement for customers through relevant offers, and profitable new media for advertisers. For financial institutions specifically, Cardlytics delivers value through rich rewards at no cost to the institution, increased card spend
Aimia's global strategy focuses on data analytics at its core. It leverages four key assets: data, value-added IP, track record of impact, and customer centricity. Aimia has experience providing loyalty analytics in fast-moving retail, demonstrating strengths in areas like improving retailer performance and connecting different data sources. Looking forward, Aimia aims to compete in customer-centric analytics, loyalty program management analytics, business intelligence powered by customer data, and data/channel monetization.
This document contains forward-looking statements and identifies them with terminology such as "anticipate", "believe", "could", "estimate", "expect", "intend", "may", "plan", "predict", "project", "will", "would", and "should". It cautions that forward-looking statements are based on assumptions and are subject to important risks and uncertainties that could cause actual results to differ materially from expectations. Specifically, it identifies dependencies on partners and clients, effective program enhancements, regulatory matters, economic conditions, industry competition, and other factors as risks to forward-looking projections. The document also excludes currency exchange rate effects and makes economic and market assumptions inherent in the forward-looking statements.
Satta matka fixx jodi panna all market dpboss matka guessing fixx panna jodi kalyan and all market game liss cover now 420 matka office mumbai maharashtra india fixx jodi panna
Call me 9040963354
WhatsApp 9040963354
Discover timeless style with the 2022 Vintage Roman Numerals Men's Ring. Crafted from premium stainless steel, this 6mm wide ring embodies elegance and durability. Perfect as a gift, it seamlessly blends classic Roman numeral detailing with modern sophistication, making it an ideal accessory for any occasion.
https://rb.gy/usj1a2
SATTA MATKA SATTA FAST RESULT KALYAN TOP MATKA RESULT KALYAN SATTA MATKA FAST RESULT MILAN RATAN RAJDHANI MAIN BAZAR MATKA FAST TIPS RESULT MATKA CHART JODI CHART PANEL CHART FREE FIX GAME SATTAMATKA ! MATKA MOBI SATTA 143 spboss.in TOP NO1 RESULT FULL RATE MATKA ONLINE GAME PLAY BY APP SPBOSS
AI Transformation Playbook: Thinking AI-First for Your BusinessArijit Dutta
I dive into how businesses can stay competitive by integrating AI into their core processes. From identifying the right approach to building collaborative teams and recognizing common pitfalls, this guide has got you covered. AI transformation is a journey, and this playbook is here to help you navigate it successfully.
Ellen Burstyn: From Detroit Dreamer to Hollywood Legend | CIO Women MagazineCIOWomenMagazine
In this article, we will dive into the extraordinary life of Ellen Burstyn, where the curtains rise on a story that's far more attractive than any script.
The Steadfast and Reliable Bull: Taurus Zodiac Signmy Pandit
Explore the steadfast and reliable nature of the Taurus Zodiac Sign. Discover the personality traits, key dates, and horoscope insights that define the determined and practical Taurus, and learn how their grounded nature makes them the anchor of the zodiac.
Storytelling is an incredibly valuable tool to share data and information. To get the most impact from stories there are a number of key ingredients. These are based on science and human nature. Using these elements in a story you can deliver information impactfully, ensure action and drive change.
Call8328958814 satta matka Kalyan result satta guessing➑➌➋➑➒➎➑➑➊➍
Satta Matka Kalyan Main Mumbai Fastest Results
Satta Matka ❋ Sattamatka ❋ New Mumbai Ratan Satta Matka ❋ Fast Matka ❋ Milan Market ❋ Kalyan Matka Results ❋ Satta Game ❋ Matka Game ❋ Satta Matka ❋ Kalyan Satta Matka ❋ Mumbai Main ❋ Online Matka Results ❋ Satta Matka Tips ❋ Milan Chart ❋ Satta Matka Boss❋ New Star Day ❋ Satta King ❋ Live Satta Matka Results ❋ Satta Matka Company ❋ Indian Matka ❋ Satta Matka 143❋ Kalyan Night Matka..
Zodiac Signs and Food Preferences_ What Your Sign Says About Your Tastemy Pandit
Know what your zodiac sign says about your taste in food! Explore how the 12 zodiac signs influence your culinary preferences with insights from MyPandit. Dive into astrology and flavors!
SATTA MATKA DPBOSS KALYAN MATKA RESULTS KALYAN CHART KALYAN MATKA MATKA RESULT KALYAN MATKA TIPS SATTA MATKA MATKA COM MATKA PANA JODI TODAY BATTA SATKA MATKA PATTI JODI NUMBER MATKA RESULTS MATKA CHART MATKA JODI SATTA COM INDIA SATTA MATKA MATKA TIPS MATKA WAPKA ALL MATKA RESULT LIVE ONLINE MATKA RESULT KALYAN MATKA RESULT DPBOSS MATKA 143 MAIN MATKA KALYAN MATKA RESULTS KALYAN CHART
3. FORWARD-LOOKING STATEMENTS
3
Forward-looking statements are included in the following presentation. These forward-looking statements are identified by the use of terms and
phrases such as “anticipate”, “believe”, “could”, “estimate”, “expect”, “intend”, “may”, “plan”, “predict”, “project”, “will”, “would”, ”should” and similar
terms and phrases, including references to assumptions. Such statements may involve but are not limited to comments with respect to strategies,
expectations, objectives, goals, aspirations, intentions, planned operations or future actions.
Forward-looking statements, by their nature, are based on assumptions and are subject to important risks and uncertainties. Any forecasts,
predictions or forward-looking statements cannot be relied upon due to, among other things, changing external events and general uncertainties of
the business and its corporate structure. Results indicated in forward-looking statements may differ materially from actual results for a number of
reasons, including without limitation, dependency on top Accumulation Partners and clients, changes to the Aeroplan Program, failure to safeguard
databases and consumer privacy, conflicts of interest, greater than expected redemptions for rewards, regulatory matters, retail market/economic
conditions, industry competition, Air Canada liquidity issues, Air Canada or travel industry disruptions, airline industry changes and increased airline
costs, supply and capacity costs, unfunded future redemption costs, changes to coalition loyalty programs, seasonal nature of the business, other
factors and prior performance, foreign operations, legal proceedings, reliance on key personnel, labour relations, pension liability, technological
disruptions and inability to use third-party software, failure to protect intellectual property rights, interest rate and currency fluctuations, leverage and
restrictive covenants in current and future indebtedness, uncertainty of dividend payments, managing growth, credit ratings, as well as the other
factors identified throughout Aimia’s MD&A and its other public disclosure records on file with the Canadian securities regulatory authorities.
Slide 18 of this presentation contain certain forward-looking statements with respect to certain financial metrics in 2014. These statements exclude
the effects of fluctuations in currency exchange rates and Aimia made a number of general economic and market assumptions in making these
statements, including assumptions regarding the performance of the economies in which the Corporation operates and market competition and tax
laws applicable to the Corporation’s operations. The Corporation cautions that the assumptions used to make these statements with respect to 2014,
although reasonable at the time they were made, may prove to be incorrect or inaccurate. In addition, these statements do not reflect the potential
impact of any non-recurring or other special items or of any new material commercial agreements, dispositions, mergers, acquisitions, other business
combinations or transactions that may be announced or that may occur after August 13, 2014. The financial impact of these transactions and non-
recurring and other special items can be complex and depends on the facts particular to each of them. We therefore cannot describe the expected
impact in a meaningful way or in the same way we present known risks affecting our business. Accordingly, our actual results could differ materially
from the statements made at Slide 18 of this presentation.
The forward-looking statements contained herein represent the Corporation’s expectations as of August 13, 2014 and are subject to change.
However, Aimia disclaims any intention or obligation to update or revise any forward-looking statements whether as a result of new information, future
events or otherwise, except as required under applicable securities regulations.
For further information, please contact Investor Relations at 416 352 3728 or karen.keyes@aimia.com.
5. OVERALL Q2 2014 HIGHLIGHTS
5
A strong quarter with a double digit increase in Gross Billings, up 13.6%, boosted
by Canadian Gross Billings up 12.4% and a favourable currency impact driving a
22.6% EMEA increase
Guidance for Free Cash Flow and capital expenditures updated, with Free Cash
Flow of $213.6 million generated in the first six months of 2014
Aeroplan membership up 4% to 5.0 million members since the announcement of
the Aeroplan transformation; gaining in the financial card space with co-branded
credit cardholders now at 1.5 million
New strategic long-term partnership agreement announced with Fractal Analytics,
building on Aimia’s existing capability and global presence with clients in analytics
6. MEMBERSHIP GROWTH AT AEROPLAN
• The first six months has demonstrated
significant membership growth, with new
members up 3% in the first six months of
2014 – driven by market share gains in
financial cards
• Goal continues to be upgrading an already
attractive membership profile:
o Aeroplan is present in almost a third
of Canadian households with an
incomes greater than $100K
o Aeroplan attracts 4 out of 5 Canadian
households with an income above
$500K
• New capabilities and data will allow for more
strategic and targeted marketing
Aeroplan Active Membership Base
Thousands of 12-month Active Members
4.37
4.57
4.66
4.73
4.80
4.84
4.97
2009
Dec
2010
Dec
2011
Dec
2012
Dec
2013
Jun
2013
Dec
2014
Jun
+11%
+3%
6
7. Aeroplan
Financial Sector
Gross Billings*
YTD 2014
+19.3%
• 25% lift in active co-branded
credit cards to 1.5 million
• Net new cards acquired
taking AMEX base up by
almost 30% YoY
• Strong momentum at AMEX
with new converters up
significantly YoY
FINANCIAL SERVICES MOMENTUM YTD 2014
7
Spend Per Card Active Card Base
Program Conversions
• Spend per card indicating
base of premium
cardholders and higher
spend per card among
tenured cardholders
• Yield reflecting impact of
higher contractual price
agreed in 2013, partly offset
by other incentive miles
issued
Price Per Mile$
* Gross Billings from the Sale of Loyalty Units excluding the $100.0 million TD contribution.
8. BETTER FLIGHT REWARDS: VALUE AND CERTAINTY
Members are embracing the certainty and value offered by the program
> We issued 1.6 million flight rewards in 2013, more than any other loyalty program in Canada, and
continue to provide unrivalled value in business class
> Members continue to take advantage of lower fares under the Distinction program. The number of
air rewards issued is up 13%, with almost 1 million flight rewards already issued YTD
Air Reward Redemptions By Type
0.7
8
1.22 million
1.31 million
Rewards issued
2013 YTD
Rewards issued
2014 YTD
+13%
YoY
Air Rewards
Non-air Rewards
0.87
0.98
9. BENEFITS TO AIR CANADA FROM TRANSFORMATION
Significant Increase In
Volume Of Rewards
Classic
Flights
Market
Fare Flight
Rewards
Moving to a More Balanced Split
Between Classic Rewards and
Market Fare Flight Rewards
Increases Yield To Air Canada
Aligned Outcomes For
Credit Card Acquisitions
Added Value for
Altitude Members
9
10. ROOM FOR STRONG GROWTH IN CANADA
GoalsLoyalty Currently Capturing Only 50%
of Total Household Expenditures
$1B
• Market share leadership
• Outstanding member
satisfaction and engagement
• Exceptional value delivered
to key partners
• Top line growth and cash
flow generation
3.0
1.8
1.3
Market
Opportunity
Aimia
Penetration
(2013)
Other
10 10
12. AIMIA PERFORMANCE: Q2 AND YTD 2014
12
Gross
Billings
$648.1M
+13.6%
Adjusted
EBITDA
$58.7M
9.1% margin
(2)
Free Cash
Flow
(1)
$153.1M
+72.4%
(1) Free cash flow before common and preferred dividends paid.
(2) Adjusted EBITDA as a % of Gross Billings.
Gross
Billings
$1,365.3M
+20.6%
Adjusted
EBITDA
$190.4M
13.9% margin
(2)
Free Cash
Flow
(1)
$213.6M
+169.7%
Q2 2014
YTD 2014
13. $648.1
$40.3
$36.5 $0.7
$570.6
2013 Reported 2014 Reported
Q2 2014 GROSS BILLINGS GROWTH BY REGION
($ MILLIONS)
13
(1) Constant Currency (c.c.) compares results between periods as if exchange rates had remained constant. For more information on Constant Currency, please refer to
Aimia’s August 13, 2014 earnings press release.
Consolidated: +13.6% growth; +8.1% in c.c.(1)
Canada: +12.4%; EMEA: +22.6%; +6.3% in c.c.;
US & APAC: +0.8%; (4.6%) in c.c.
Canada
EMEA
US & APAC
14. Q2 2014 GROSS BILLINGS GROWTH BY ACTIVITY
($ MILLIONS)
14
• Consolidated Loyalty Units +32.7% growth;
• Proprietary Loyalty & Other +14.1%
• Canada Loyalty Units +49.9%, +10.9% excluding TD Contribution
• EMEA Loyalty Units +4.7%
$648.1
$46.1
$30.7 $0.7
$570.6
2013 Reported 2014 Reported
Canada Loyalty
Units
EMEA Loyalty
Units
Proprietary Loyalty
& Other
Consolidated Loyalty Units: +18.5% growth;
Canada Loyalty Units: +17.0% growth;
EMEA Loyalty Units: +21.3% growth
Proprietary Loyalty & Other +0.4% growth
15. AEROPLAN ACCUMULATION & REDEMPTION
15
-4.5%
1.5% 2.1%
15.4%
17.9%
-4.5%
1.5% 2.1%
6.9%
10.4%
Q2/13 Q3/13 Q4/13 Q1/14 Q2/14
4.6%
-2.3%
-8.9%
2.9%
0.5%
9.6%
8.2%
Q2/13 Q3/13 Q4/13 Q1/14 Q2/14
Accumulation with
promotional miles
RedemptionAccumulation without
promotional miles
ACCUMULATION PATTERN REDEMPTION PATTERN
Redemption at 2013
average miles redeemed
per travel reward
16. Q2 2014 CONSOLIDATED AEBITDA
($ MILLIONS)
16
$58.7
$(18.5)
$(26.6)
$(3.0) $(1.4)
$3.7 $2.0
$0.5
$102.0
2013
Reported
2014
Reported
Canada EMEA
US &
APAC
VAT
impact
Club Premier
(PLM)
distribution
Corporate Stock
based
compensation
17. DRIVERS OF FREE CASH FLOW*
($ MILLIONS)
17
* Free Cash Flow before Dividends Paid (Common and Preferred).
$100.0
$171.2
-$11.2 -$18.1
$88.8
$153.1
$99.5
$253.3
-$20.3 -$39.7
$79.2
$213.6
Cash flow from Operations Capital Expenditures
Including
one off
of $83.4
million
Including
one offs
of $205.9
million
Q2 2013 Q2 2014 1H 2013 1H 2014
18. 2014 GUIDANCE*
18
* Please refer to Slide 3 for a description of the assumptions made and risks related to the 2014 forecasts.
1) Change to original guidance provided on February 26, 2014 which had expected Free Cash Flow in a range of $230 to $250 million.
2) Includes the $100.0 million payment received from TD.
3) Represents reported figures excluding the $150.0 million payment to CIBC and $50.0 million card migration provision.
4) Represents reported figures excluding the $150.0 million payment to CIBC and $22.5 of related harmonized sales tax.
5) Includes $100.0 million related to income tax refund of loss carry back applied in Canada and $22.5 million input tax credit on harmonized sales tax payment made in 2013.
2013
Guidance
(updated on May 13, 2014)(1)
2014 Target
(updated on August 13, 2014)
Gross Billings $2,366.4 million Between 7% and 9% growth
(constant currency)(2)
No Change
Adjusted EBITDA $350.5 million(3)
Adjusted EBITDA margin of
approximately 12%(2)
No Change
Free Cash Flow
before Dividends
Paid
$268.1 million(4)
Target range of $250 to $270
million(2)(5)
In excess of $270 million(2)(5)
Capital
Expenditures
$54.4 million To approximate $60 to $70
million
Between $70 to $80 million
21. ATTRACTIVE DIVIDEND RECORD
21
$0.125
$0.150 $0.160 $0.170 $0.180
$0.00
$0.02
$0.04
$0.06
$0.08
$0.10
$0.12
$0.14
$0.16
$0.18
$0.20
2010 2011 2012 2013 2014
(1) Quarterly dividends paid in June each year.
Quarterly Dividends Per Common Share(1)
22. YTD 2014 CONSOLIDATED GROSS BILLINGS GROWTH
($ MILLIONS)
22
Consolidated +60.1% growth
$1,365.3(2)
$100.0
$65.9 $49.8
$17.8
$1,131.7
2013 Reported 2014 Reported
TD Contribution
Canada
EMEA
US &
APAC
Consolidated: +20.6% growth; 15.3% in c.c.(1)
Canada: +26.3%; EMEA: +14.9%
US & APAC: +10.8%
(1) Constant Currency (c.c.) compares results between periods as if exchange rates had remained constant. For more information on Constant Currency, please refer to
Aimia’s August 13, 2014 earnings press release.
(2) Variance related to intercompany eliminations of $0.1 has been excluded from the bridge.
23. YTD 2014 CONSOLIDATED AEBITDA
($ MILLIONS)
23
TD
Contribution
Canada US &
APAC
EMEA
VAT
Impact Corporate
Stock
based
compensation
($66.5)
($1.7) ($24.0)
($6.6)
$100.0
$3.9 $0.5
$0.8 $190.4$184.0
2013
Reported
2014
Reported
Club Premier
(PLM)
distribution
24. Q2 ADJUSTED EBITDA TO FREE CASH FLOW BRIDGE
($ MILLIONS)
24
Q2 2013: $102.0 $34.3 $3.8 $12.4 ($7.7) ($1.6) ($11.2) ($17.1) ($26.1) $88.8
$153.1
($1.9) ($18.1)
($40.2)
$73.8 $5.2
$75.6
$58.7
Adjusted
EBITDA
Change in
FRC excluding
Breakage
impact
Stock based
compensation
Impact of
Breakage on
change in
FRC
Cash Taxes Net Cash
Interest
Capital
expenditures
Working
capital and
other
VAT Free Cash
Flow
Non-cash items
25. YTD ADJUSTED EBITDA TO FREE CASH FLOW BRIDGE
($ MILLIONS)
25
YTD 2013: $184.0 $19.1 $7.7 ($24.0) ($15.1) $0.0 ($13.8) ($20.3) ($58.4) $79.2
$213.6
($17.0)
($39.7)
($108.8)
$85.9 $6.9
$73.4
$22.5
$190.4
Adjusted
EBITDA
Change in
FRC
Stock based
compensation
VAT impact Cash Taxes Harmonized
sales tax on
CIBC
Payment
Net Cash
Interest
Capital
expenditures
Working
capital and
other
Free Cash
Flow
Non-cash items
26. Q2 2014 FINANCIAL HIGHLIGHTS – CONSOLIDATED
26
Three months ended June 30,
(in millions of Canadian dollars) 2014 2013 Variance %
Reported Reported Breakage VAT Adjusted Reported Adjusted
Gross Billings 648.1 570.6 570.6 13.6% 13.6%
Gross Billings from the sale of Loyalty
Units 491.1 414.3 414.3 18.5% 18.5%
Revenue from Loyalty Units 387.6 (282.5) 642.1 359.6 n.m. 7.8%
Revenue from proprietary loyalty
services 134.1 133.7 133.7 0.3% 0.3%
Other revenue 33.7 25.5 25.5 32.2% 32.2%
Total revenue 555.4 (123.3) 642.1 518.8 n.m. 7.1%
Cost of rewards and direct costs 354.5 230.6 74.9 305.5 53.7% 16.0%
Gross margin before depreciation and
amortization 200.9 (353.9) 642.1 (74.9) 213.3 n.m. -5.8%
Depreciation and amortization 45.1 30.6 30.6 47.4% 47.4%
Gross margin 155.8 (384.5) 642.1 (74.9) 182.7 n.m. -14.7%
Operating expenses before share-
based compensation 163.3 194.4 (48.8) 145.6 -16.0% 12.2%
Share-based compensation 5.2 3.8 3.8 36.8% 36.8%
Total operating expenses 168.5 198.2 - (48.8) 149.4 -15.0% 12.8%
Operating income (loss) (12.7) (582.7) 642.1 (26.1) 33.3 n.m. n.m.
Adjusted EBITDA 58.7 102.0 12.4 (26.6) 87.8 -42.5% -33.1%
Adjusted EBITDA as a % of Gross
Billings 9.1% 17.9% 15.4%
Gross Margin (before Depreciation and
Amortization) as a % of Revenue
36.2% n.m. 41.1%
n.m. means not meaningful.
27. YTD 2014 FINANCIAL HIGHLIGHTS – CONSOLIDATED
27
(1) Includes the $100.0 million upfront TD contribution received in the first quarter of 2014.
Six months ended June 30,
(in millions of Canadian dollars) 2014 2013 Variance %
Reported Reported Breakage VAT Adjusted Reported Adjusted
Gross Billings(1)
1,365.3 1,131.7 1,131.7 20.6% 20.6%
Gross Billings from the sale of Loyalty
Units(1)
1,039.8 827.6 827.6 25.6% 25.6%
Revenue from Loyalty Units 829.3 178.6 617.0 795.6 n.m. 4.2%
Revenue from proprietary loyalty
services 273.3 256.8 256.8 6.4% 6.4%
Other revenue 61.7 50.8 50.8 21.5% 21.5%
Total revenue 1,164.3 486.2 617.0 1,103.2 n.m. 5.5%
Cost of rewards and direct costs 759.0 584.0 72.8 656.8 30.0% 15.6%
Gross margin before depreciation and
amortization 405.3 (97.8) 617.0 (72.8) 446.4 n.m. -9.2%
Depreciation and amortization 89.6 61.2 61.2 46.4% 46.4%
Gross margin 315.7 (159.0) 617.0 (72.8) 385.2 n.m. -18.0%
Operating expenses before share-
based compensation 330.5 343.8 (48.8) 295.0 -3.9% 12.0%
Share-based compensation 6.9 7.7 7.7 -10.4% -10.4%
Total operating expenses 337.4 351.5 - (48.8) 302.7 -4.0% 11.5%
Operating income (loss) (21.7) (510.5) 617.0 (24.0) 82.5 n.m. n.m.
Adjusted EBITDA(1)
190.4 184.0 - (24.0) 160.0 3.5% 19.0%
Adjusted EBITDA as a % of Gross
Billings 13.9% 16.3% 14.1%
Gross Margin (before Depreciation and
Amortization) as a % of Revenue
34.8% n.m. 40.5%
n.m. means not meaningful.
28. CANADA PERFORMANCE
28
87%
13%
Q2 2014 Gross Billings
Loyalty Units - Aeroplan
Proprietary Loyalty & Other
Gross Billings
Canada
$365.2M
Q2 2014 Highlights
• Gross Billings up 12.4% over last year to $365.2
million driven by higher Gross Billings from sale of
Loyalty Unit offset in part by lower client activity in
Proprietary Loyalty and Other
• Gross Billings from Loyalty Units up 17.0%, driven
by financial card partners up 22.8%
• Adjusted EBITDA of $59.5 million impacted by
higher redemption costs, including a $14.2 million
increase in Future Redemption Costs on
promotional miles issued on new financial cards,
increased marketing and promotional spend offset
by higher Gross Billings and the Q2 2013 impact of
$12.4 million from the change in Breakage rate
29. Q2 2014 FINANCIAL HIGHLIGHTS – CANADA
29
Three months ended June 30,
(in millions of Canadian dollars) 2014 2013 Variance %
Reported Reported Breakage Adjusted Reported Adjusted
Gross Billings 365.2 324.9 324.9 12.4% 12.4%
Gross Billings from the sale of Loyalty
Units 316.6 270.5 270.5 17.0% 17.0%
Revenue from Loyalty Units 255.2 (388.5) 642.1 253.6 n.m. 0.6%
Revenue from proprietary loyalty
services 38.0 41.7 41.7 -8.9% -8.9%
Other revenue 16.1 12.1 12.1 33.1% 33.1%
Total revenue 309.3 (334.7) 642.1 307.4 n.m. 0.6%
Cost of rewards and direct costs 202.2 173.0 173.0 16.9% 16.9%
Gross margin before depreciation and
amortization 107.1 (507.7) 642.1 134.4 n.m. -20.3%
Depreciation and amortization 36.7 24.1 24.1 52.3% 52.3%
Gross margin 70.4 (531.8) 642.1 110.3 n.m. -36.2%
Total operating expenses 60.2 53.2 - 53.2 13.2% 13.2%
Operating income (loss) 10.2 (585.0) 642.1 57.1 n.m. -82.1%
Adjusted EBITDA 59.5 78.0 12.4 90.4 -23.7% -34.2%
Adjusted EBITDA as a % of Gross
Billings
16.3% 24.0% 27.8%
Gross Margin (before Depreciation
and Amortization) as a % of Revenue
34.6% n.m. 43.7%
n.m. means not meaningful.
30. Q2 2014 FINANCIAL HIGHLIGHTS – CANADA
30
(1) Before depreciation and amortization.
Three months ended June 30,
(in millions of Canadian dollars) 2014 2013 Variance
Reported Reported %
Gross Billings
Aeroplan 327.3 282.6 15.8%
Proprietary Loyalty 55.6 63.6 -12.6%
Intercompany eliminations (17.7) (21.3) n.m.
365.2 324.9 12.4%
Total revenue
Aeroplan 271.2 (376.4) n.m.
Proprietary Loyalty 55.8 63.0 -11.4%
Intercompany eliminations (17.7) (21.3) n.m.
309.3 (334.7) n.m.
Gross margin(1)
Aeroplan 90.2 (526.5) n.m.
Proprietary Loyalty 17.2 19.2 -10.4%
Intercompany eliminations (0.3) (0.4) n.m.
107.1 (507.7) n.m.
Operating income (loss)
Aeroplan 11.0 (586.7) n.m.
Proprietary Loyalty (0.8) 1.7 n.m.
10.2 (585.0) n.m.
Adjusted EBITDA
Adjusted EBITDA margin
(as a % of Gross Billings) 16.3% 24.0%
Aeroplan 56.9 72.4 -21.4%
Proprietary Loyalty 2.6 5.6 -53.6%
59.5 78.0 -23.7%
n.m. means not meaningful.
31. YTD 2014 FINANCIAL HIGHLIGHTS – CANADA
31
(1) Includes the $100.0 million upfront TD contribution received in the first quarter of 2014.
Six months ended June 30,
(in millions of Canadian dollars) 2014 2013 Variance %
Reported Reported Breakage Adjusted Reported Adjusted
Gross Billings(1)
797.9 632.0 632.0 26.3% 26.3%
Gross Billings from the sale of Loyalty
Units(1)
701.2 527.1 527.1 33.0% 33.0%
Revenue from Loyalty Units 561.1 (67.7) 617.0 549.3 n.m. 2.1%
Revenue from proprietary loyalty
services 76.3 80.5 80.5 -5.2% -5.2%
Other revenue 27.0 24.1 24.1 12.0% 12.0%
Total revenue 664.4 36.9 617.0 653.9 n.m. 1.6%
Cost of rewards and direct costs 443.7 375.8 375.8 18.1% 18.1%
Gross margin before depreciation and
amortization 220.7 (338.9) 617.0 278.1 n.m. -20.6%
Depreciation and amortization 72.9 47.9 47.9 52.2% 52.2%
Gross margin 147.8 (386.8) 617.0 230.2 n.m. -35.8%
Total operating expenses 119.8 107.6 - 107.6 11.3% 11.3%
Operating income (loss) 28.0 (494.4) 617.0 122.6 n.m. -77.2%
Adjusted EBITDA(1)
199.7 166.2 - 166.2 20.2% 20.2%
Adjusted EBITDA as a % of Gross
Billings
25.0% 26.3% 26.3%
Gross Margin (before Depreciation
and Amortization) as a % of Revenue
33.2% n.m. 42.5%
n.m. means not meaningful.
32. YTD 2014 FINANCIAL HIGHLIGHTS – CANADA
32
(1) Before depreciation and amortization.
(2) Includes the $100.0 million upfront TD contribution in the first quarter of 2014.
Six months ended June 30,
(in millions of Canadian dollars) 2014 2013 Variance
Reported Reported %
Gross Billings
Aeroplan2
722.7 551.2 31.1%
Proprietary Loyalty 110.9 121.8 -8.9%
Intercompany eliminations (35.7) (41.0) n.m.
797.9 632.0 26.3%
Total revenue
Aeroplan 588.0 (43.6) n.m.
Proprietary Loyalty 112.1 121.5 -7.7%
Intercompany eliminations (35.7) (41.0) n.m.
664.4 36.9 n.m.
Gross margin(1)
Aeroplan 184.3 (377.9) n.m.
Proprietary Loyalty 37.0 39.8 -7.0%
Intercompany eliminations (0.6) (0.8) n.m.
220.7 (338.9) n.m.
Operating income (loss)
Aeroplan 26.2 (497.6) n.m.
Proprietary Loyalty 1.8 3.2 -43.8%
28.0 (494.4) n.m.
Adjusted EBITDA
Adjusted EBITDA margin
(as a % of Gross Billings) 25.0% 26.3%
Aeroplan2
192.0 156.2 22.9%
Proprietary Loyalty 7.7 10.0 -23.0%
199.7 166.2 20.2%
n.m. means not meaningful.
33. EMEA PERFORMANCE
33
73%
15%
12%
Q2 2014 Gross Billings
Loyalty Units - Nectar UK
Loyalty Units - Other Coalition
Proprietary Loyalty & Other
Gross Billings
EMEA
$197.8M
Q2 2014 Highlights
• Gross Billings up 22.6% to $197.8 million driven by
favorable currency impact, as well as the Loyalty
Units and the Analytics and Insights and Proprietary
Loyalty businesses
• Adjusted EBITDA decreased to $19.9 million in the
quarter, mainly due to the $26.6 million positive
impact of the VAT litigation in the second quarter of
2013. Excluding the positive impact from VAT,
Adjusted EBITDA was $16.2 million in the second
quarter of 2013
34. Q2 2014 FINANCIAL HIGHLIGHTS – EMEA
34
Three months ended June 30,
(in millions of Canadian dollars) 2014 2013 Variance %
Reported Reported VAT Adjusted Reported Adjusted
Gross Billings 197.8 161.3 161.3 22.6% 22.6%
Gross Billings from the sale of Loyalty
Units 174.5 143.8 143.8 21.3% 21.3%
Revenue from Loyalty Units 132.4 106.0 106.0 24.9% 24.9%
Revenue from proprietary loyalty
services 5.9 4.3 4.3 37.2% 37.2%
Other revenue 17.6 13.4 13.4 31.3% 31.3%
Intercompany revenue 0.1 0.1 0.1 0.0% 0.0%
Total revenue 156.0 123.8 123.8 26.0% 26.0%
Cost of rewards and direct costs 106.7 9.3 74.9 84.2 n.m. 26.7%
Gross margin before depreciation and
amortization 49.3 114.5 (74.9) 39.6 -56.9% 24.5%
Depreciation and amortization 5.4 3.8 3.8 42.1% 42.1%
Gross margin 43.9 110.7 (74.9) 35.8 -60.3% 22.6%
Total operating expenses 40.7 83.2 (48.8) 34.4 -51.1% 18.3%
Operating income (loss) 3.2 27.5 (26.1) 1.4 -88.4% n.m.
Adjusted EBITDA 19.9 42.8 (26.6) 16.2 -53.5% 22.8%
Adjusted EBITDA as a % of Gross
Billings
10.1% 26.5% 10.0%
Gross Margin (before Depreciation
and Amortization) as a % of Revenue
31.6% 92.5% 32.0%
n.m. means not meaningful.
35. YTD 2014 FINANCIAL HIGHLIGHTS – EMEA
35
Six months ended June 30,
(in millions of Canadian dollars) 2014 2013 Variance %
Reported Reported VAT Adjusted Reported Adjusted
Gross Billings 384.8 335.0 335.0 14.9% 14.9%
Gross Billings from the sale of Loyalty
Units 338.6 300.5 300.5 12.7% 12.7%
Revenue from Loyalty Units 268.2 246.3 246.3 8.9% 8.9%
Revenue from proprietary loyalty
services 11.7 8.0 8.0 46.3% 46.3%
Other revenue 34.7 26.7 26.7 30.0% 30.0%
Intercompany revenue 0.1 0.2 0.2 -50.0% -50.0%
Total revenue 314.7 281.2 281.2 11.9% 11.9%
Cost of rewards and direct costs 215.5 115.7 72.8 188.5 86.3% 14.3%
Gross margin before depreciation and
amortization 99.2 165.5 (72.8) 92.7 -40.1% 7.0%
Depreciation and amortization 10.7 7.8 7.8 37.2% 37.2%
Gross margin 88.5 157.7 (72.8) 84.9 -43.9% 4.2%
Total operating expenses 83.6 122.4 (48.8) 73.6 -31.7% 13.6%
Operating income (loss) 4.9 35.3 (24.0) 11.3 -86.1% -56.6%
Adjusted EBITDA 34.5 60.2 (24.0) 36.2 -42.7% -4.7%
Adjusted EBITDA as a % of Gross
Billings
9.0% 18.0% 10.8%
Gross Margin (before Depreciation
and Amortization) as a % of Revenue
31.5% 58.9% 33.0%
36. US & APAC PERFORMANCE
36
100%
Q2 2014 Gross Billings
US & APAC
US &
APAC
$85.2M
Q2 2014 Highlights
• Gross Billings up 0.8% to $85.2 million from
favourable currency, increase business in APAC
offset in part by the reduced rewards fulfillment
volumes in the U.S
• Adjusted EBITDA improved by $2.0 million to
$(4.3) million in the quarter mainly attributable to
a higher gross margin which more than offset
increased operating expenses.
37. Q2 2014 FINANCIAL HIGHLIGHTS – US & APAC
37
Three months ended June 30,
(in millions of Canadian dollars) 2014 2013 Variance
Reported Reported %
Gross Billings 85.2 84.5 0.8%
Gross Billings from the sale of Loyalty
Units - - -
Revenue from Loyalty Units - - -
Revenue from proprietary loyalty
services 90.2 87.7 2.9%
Intercompany revenue - - -
Total revenue 90.2 87.7 2.9%
Cost of rewards and direct costs 45.6 48.3 -5.6%
Gross margin before depreciation and
amortization 44.6 39.4 13.2%
Depreciation and amortization 3.0 2.7 11.1%
Gross margin 41.6 36.7 13.4%
Total operating expenses 43.9 42.5 3.3%
Operating income (loss) (2.3) (5.8) 60.3%
Adjusted EBITDA (4.3) (6.3) 31.7%
Adjusted EBITDA as a % of Gross
Billings
-5.0% -7.5%
Gross Margin (before Depreciation
and Amortization) as a % of Revenue
49.4% 44.9%
38. YTD 2014 FINANCIAL HIGHLIGHTS – US & APAC
38
Six months ended June 30,
(in millions of Canadian dollars) 2014 2013 Variance
Reported Reported %
Gross Billings 182.9 165.1 10.8%
Gross Billings from the sale of Loyalty
Units - - -
Revenue from Loyalty Units - - -
Revenue from proprietary loyalty
services 185.3 168.3 10.1%
Other revenue - - -
Intercompany revenue 0.2 0.2 0.0%
Total revenue 185.5 168.5 10.1%
Cost of rewards and direct costs 99.8 92.5 7.9%
Gross margin before depreciation and
amortization 85.7 76.0 12.8%
Depreciation and amortization 6.0 5.5 9.1%
Gross margin 79.7 70.5 13.0%
Total operating expenses 89.1 82.5 8.0%
Operating income (loss) (9.4) (12.0) 21.7%
Adjusted EBITDA (6.0) (9.9) 39.4%
Adjusted EBITDA as a % of Gross
Billings
-3.3% -6.0%
Gross Margin (before Depreciation
and Amortization) as a % of Revenue
46.2% 45.1%
39. 33.7%
17.2%
10.2%
14.1%
24.8%
GROSS BILLINGS FROM SALE OF LOYALTY UNITS BY
MAJOR PARTNER
39
14.2%
19.5%
19.2%
11.9%
13.1%
22.1%
Partner D
Partner A
Partner
B
Partner C
Air
Canada
Other
Partner A
Partner B
Partner D
Air
Canada
Other
Q2 2013
$414.3M
Q2 2014
$491.1M
40. 14.3%
19.4%
18.2%12.1%
12.9%
23.1%
GROSS BILLINGS FROM SALE OF LOYALTY UNITS BY
MAJOR PARTNER
40
1H 2013
$827.6M
1H 2014*
$939.8M
Partner A
* Excludes the $100.0 million upfront TD Payment received in the first quarter of 2014.
32.4%
17.8%
10.0%
14.4%
25.4%
Partner A
Partner A
Partner B
Partner
B
Partner D Partner CPartner D
Air
Canada
Air
Canada
Other Other
41. BALANCE SHEET AT JUNE 30, 2014
AVAILABLE CASH
$ millions
June
30, 2014
Cash and cash equivalents 748.1
Restricted cash 28.6
Short-term investments 71.6
Long-term investments in bonds 237.4
Cash and Investments 1,085.7
Aeroplan reserves (300.0)
Other loyalty programs reserves (172.6)
Restricted cash (28.6)
Available cash 584.5
DEBT
$ millions
Annual
Interest
Rate Maturing
June
30, 2014
Revolving Facility(1) Apr. 23, 2018 -
Senior Secured Notes 2 7.90% Sept. 2, 2014 150.0
Senior Secured Notes 3 6.95% Jan. 26, 2017 200.0
Senior Secured Notes 4 5.60% May 17, 2019 250.0
Senior Secured Notes 5 4.35% Jan. 22, 2018 200.0
Total Long Term Debt 800.0
Less Current Portion (150.0)
Long Term Debt 650.0
41
Preferred Shares (Series 1) 6.50%(2) Perpetual 172.5
(1) As of June 30, 2014, Aimia held a $300.0 million revolving credit facility which comes to term on April 23, 2018. Interest rates on this facility are tied to the Corporation’s credit
ratings and range between Canadian prime rate plus 0.20% to 1.50% and Bankers’ Acceptance and LIBOR rates plus 1.20% to 2.50%. As of June 30, 2014, Aimia also had
outstanding letters of credit totaling approximately $56.9 million which were issued against the revolving facility. This amount reduces the available credit under the revolving facility.
(2) Annual dividend rate is subject to a rate reset on March 31, 2015 and every 5 years thereafter.
(3) Annual dividend rate is subject to a rate reset on March 31, 2019 and every 5 years thereafter.
Preferred share issuance at June 30, 2014
Preferred Shares (Series 3) 6.25%(3) Perpetual 150.0
42. FOREIGN EXCHANGE RATES
42
Q2 2014 Q2 2013 % Change
Average
Quarter
Average
YTD
Period
End
Average
Quarter
Average
YTD
Period
End
Average
Quarter
Average
YTD
Period
End
£ to $ 1.8350 1.8293 1.8154 1.5710 1.5679 1.5992 16.8% 16.7% 13.5%
AED to $ 0.2969 0.2984 0.2902 0.2785 0.2764 0.2862 6.6% 8.0% 1.4%
USD to $ 1.0901 1.0960 1.0466 1.0231 1.0155 1.0515 6.5% 7.9% -0.5%
€ to $ 1.4961 1.5029 1.4548 1.3357 1.3332 1.3677 12.0% 12.7% 6.4%