Download as PDF, PPTX

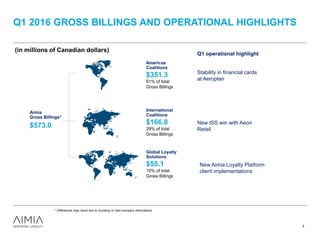
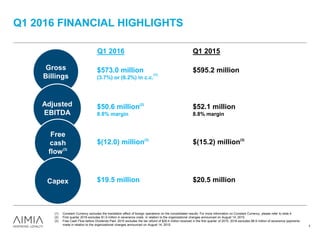
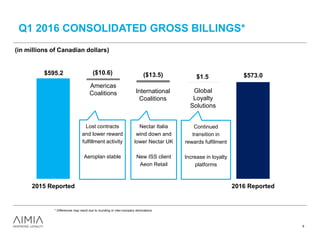
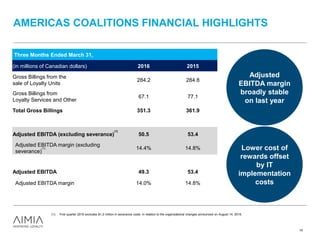

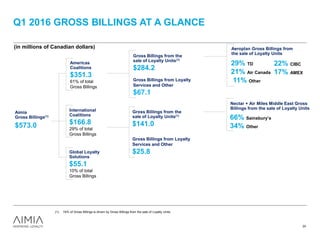
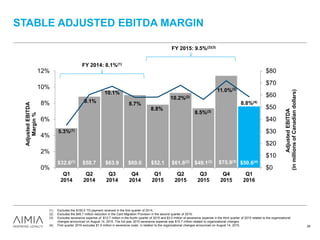
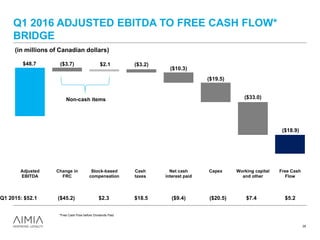
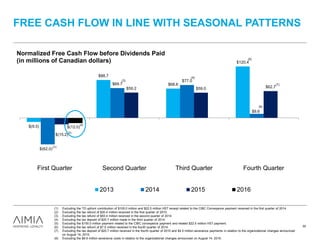
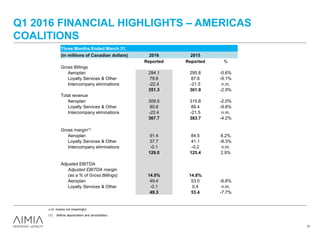

- The document discusses Aimia's Q1 2016 highlights and financial results. It provides forward-looking statements and cautions that actual results may differ materially from expectations. - Gross billings decreased 3.7% to $573.0 million due to lost contracts, lower reward fulfillment activity, and wind downs, partially offset by new client wins. Adjusted EBITDA was $50.6 million. - Key highlights included stability in Aeroplan's financial cards business, a new ISS win with Aeon Retail, and progress on Aimia's operating cost reduction initiatives.


