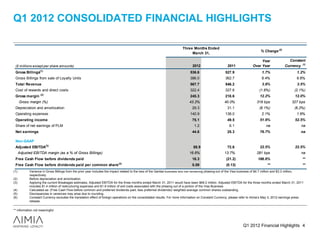
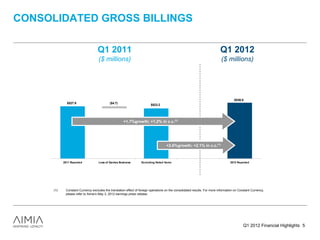
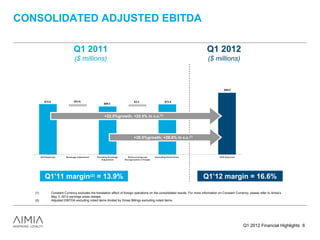
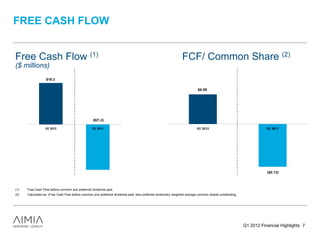
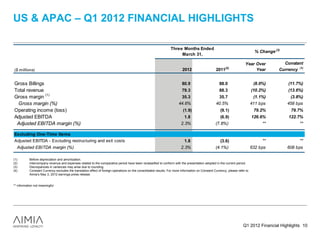
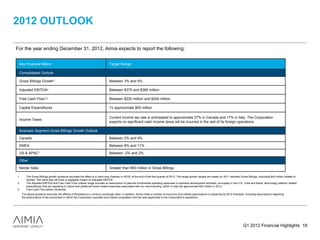
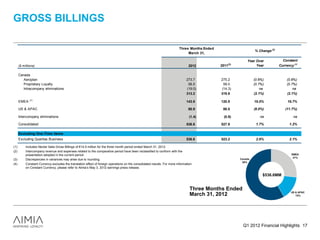
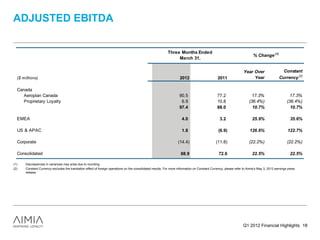
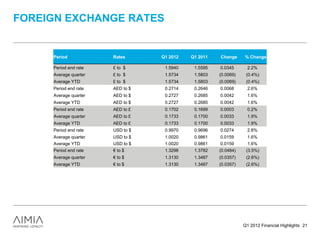
- Gross billings increased 1.7% year-over-year to $536.6 million driven by a 6.4% increase in loyalty units sold, partially offset by the loss of the Qantas program. On a constant currency basis, gross billings increased 1.2%.
- Adjusted EBITDA increased 22.5% year-over-year to $88.9 million due to improved margins and cost containment. On a constant currency basis, adjusted EBITDA growth was also 22.5%.
- Free cash flow was $18.3 million compared to negative $21.2 million in the prior year due to higher earnings and working capital improvements.
What is the TDS Return Filing Due Date for FY 2024-25.pdfseoforlegalpillers
It is crucial for the taxpayers to understand about the TDS Return Filing Due Date, so that they can fulfill your TDS obligations efficiently. Taxpayers can avoid penalties by sticking to the deadlines and by accurate filing of TDS. Timely filing of TDS will make sure about the availability of tax credits. You can also seek the professional guidance of experts like Legal Pillers for timely filing of the TDS Return.
Kseniya Leshchenko: Shared development support service model as the way to ma...Lviv Startup Club
Kseniya Leshchenko: Shared development support service model as the way to make small projects with small budgets profitable for the company (UA)
Kyiv PMDay 2024 Summer
Website – www.pmday.org
Youtube – https://www.youtube.com/startuplviv
FB – https://www.facebook.com/pmdayconference
Skye Residences | Extended Stay Residences Near Toronto Airportmarketingjdass
Experience unparalleled EXTENDED STAY and comfort at Skye Residences located just minutes from Toronto Airport. Discover sophisticated accommodations tailored for discerning travelers.
Website Link :
https://skyeresidences.com/
https://skyeresidences.com/about-us/
https://skyeresidences.com/gallery/
https://skyeresidences.com/rooms/
https://skyeresidences.com/near-by-attractions/
https://skyeresidences.com/commute/
https://skyeresidences.com/contact/
https://skyeresidences.com/queen-suite-with-sofa-bed/
https://skyeresidences.com/queen-suite-with-sofa-bed-and-balcony/
https://skyeresidences.com/queen-suite-with-sofa-bed-accessible/
https://skyeresidences.com/2-bedroom-deluxe-queen-suite-with-sofa-bed/
https://skyeresidences.com/2-bedroom-deluxe-king-queen-suite-with-sofa-bed/
https://skyeresidences.com/2-bedroom-deluxe-queen-suite-with-sofa-bed-accessible/
#Skye Residences Etobicoke, #Skye Residences Near Toronto Airport, #Skye Residences Toronto, #Skye Hotel Toronto, #Skye Hotel Near Toronto Airport, #Hotel Near Toronto Airport, #Near Toronto Airport Accommodation, #Suites Near Toronto Airport, #Etobicoke Suites Near Airport, #Hotel Near Toronto Pearson International Airport, #Toronto Airport Suite Rentals, #Pearson Airport Hotel Suites
"𝑩𝑬𝑮𝑼𝑵 𝑾𝑰𝑻𝑯 𝑻𝑱 𝑰𝑺 𝑯𝑨𝑳𝑭 𝑫𝑶𝑵𝑬"
𝐓𝐉 𝐂𝐨𝐦𝐬 (𝐓𝐉 𝐂𝐨𝐦𝐦𝐮𝐧𝐢𝐜𝐚𝐭𝐢𝐨𝐧𝐬) is a professional event agency that includes experts in the event-organizing market in Vietnam, Korea, and ASEAN countries. We provide unlimited types of events from Music concerts, Fan meetings, and Culture festivals to Corporate events, Internal company events, Golf tournaments, MICE events, and Exhibitions.
𝐓𝐉 𝐂𝐨𝐦𝐬 provides unlimited package services including such as Event organizing, Event planning, Event production, Manpower, PR marketing, Design 2D/3D, VIP protocols, Interpreter agency, etc.
Sports events - Golf competitions/billiards competitions/company sports events: dynamic and challenging
⭐ 𝐅𝐞𝐚𝐭𝐮𝐫𝐞𝐝 𝐩𝐫𝐨𝐣𝐞𝐜𝐭𝐬:
➢ 2024 BAEKHYUN [Lonsdaleite] IN HO CHI MINH
➢ SUPER JUNIOR-L.S.S. THE SHOW : Th3ee Guys in HO CHI MINH
➢FreenBecky 1st Fan Meeting in Vietnam
➢CHILDREN ART EXHIBITION 2024: BEYOND BARRIERS
➢ WOW K-Music Festival 2023
➢ Winner [CROSS] Tour in HCM
➢ Super Show 9 in HCM with Super Junior
➢ HCMC - Gyeongsangbuk-do Culture and Tourism Festival
➢ Korean Vietnam Partnership - Fair with LG
➢ Korean President visits Samsung Electronics R&D Center
➢ Vietnam Food Expo with Lotte Wellfood
"𝐄𝐯𝐞𝐫𝐲 𝐞𝐯𝐞𝐧𝐭 𝐢𝐬 𝐚 𝐬𝐭𝐨𝐫𝐲, 𝐚 𝐬𝐩𝐞𝐜𝐢𝐚𝐥 𝐣𝐨𝐮𝐫𝐧𝐞𝐲. 𝐖𝐞 𝐚𝐥𝐰𝐚𝐲𝐬 𝐛𝐞𝐥𝐢𝐞𝐯𝐞 𝐭𝐡𝐚𝐭 𝐬𝐡𝐨𝐫𝐭𝐥𝐲 𝐲𝐨𝐮 𝐰𝐢𝐥𝐥 𝐛𝐞 𝐚 𝐩𝐚𝐫𝐭 𝐨𝐟 𝐨𝐮𝐫 𝐬𝐭𝐨𝐫𝐢𝐞𝐬."
Improving profitability for small businessBen Wann
In this comprehensive presentation, we will explore strategies and practical tips for enhancing profitability in small businesses. Tailored to meet the unique challenges faced by small enterprises, this session covers various aspects that directly impact the bottom line. Attendees will learn how to optimize operational efficiency, manage expenses, and increase revenue through innovative marketing and customer engagement techniques.
Cracking the Workplace Discipline Code Main.pptxWorkforce Group
Cultivating and maintaining discipline within teams is a critical differentiator for successful organisations.
Forward-thinking leaders and business managers understand the impact that discipline has on organisational success. A disciplined workforce operates with clarity, focus, and a shared understanding of expectations, ultimately driving better results, optimising productivity, and facilitating seamless collaboration.
Although discipline is not a one-size-fits-all approach, it can help create a work environment that encourages personal growth and accountability rather than solely relying on punitive measures.
In this deck, you will learn the significance of workplace discipline for organisational success. You’ll also learn
• Four (4) workplace discipline methods you should consider
• The best and most practical approach to implementing workplace discipline.
• Three (3) key tips to maintain a disciplined workplace.
3.0 Project 2_ Developing My Brand Identity Kit.pptxtanyjahb
A personal brand exploration presentation summarizes an individual's unique qualities and goals, covering strengths, values, passions, and target audience. It helps individuals understand what makes them stand out, their desired image, and how they aim to achieve it.
The world of search engine optimization (SEO) is buzzing with discussions after Google confirmed that around 2,500 leaked internal documents related to its Search feature are indeed authentic. The revelation has sparked significant concerns within the SEO community. The leaked documents were initially reported by SEO experts Rand Fishkin and Mike King, igniting widespread analysis and discourse. For More Info:- https://news.arihantwebtech.com/search-disrupted-googles-leaked-documents-rock-the-seo-world/
Unveiling the Secrets How Does Generative AI Work.pdfSam H
At its core, generative artificial intelligence relies on the concept of generative models, which serve as engines that churn out entirely new data resembling their training data. It is like a sculptor who has studied so many forms found in nature and then uses this knowledge to create sculptures from his imagination that have never been seen before anywhere else. If taken to cyberspace, gans work almost the same way.
Enterprise Excellence is Inclusive Excellence.pdfKaiNexus
Enterprise excellence and inclusive excellence are closely linked, and real-world challenges have shown that both are essential to the success of any organization. To achieve enterprise excellence, organizations must focus on improving their operations and processes while creating an inclusive environment that engages everyone. In this interactive session, the facilitator will highlight commonly established business practices and how they limit our ability to engage everyone every day. More importantly, though, participants will likely gain increased awareness of what we can do differently to maximize enterprise excellence through deliberate inclusion.
What is Enterprise Excellence?
Enterprise Excellence is a holistic approach that's aimed at achieving world-class performance across all aspects of the organization.
What might I learn?
A way to engage all in creating Inclusive Excellence. Lessons from the US military and their parallels to the story of Harry Potter. How belt systems and CI teams can destroy inclusive practices. How leadership language invites people to the party. There are three things leaders can do to engage everyone every day: maximizing psychological safety to create environments where folks learn, contribute, and challenge the status quo.
Who might benefit? Anyone and everyone leading folks from the shop floor to top floor.
Dr. William Harvey is a seasoned Operations Leader with extensive experience in chemical processing, manufacturing, and operations management. At Michelman, he currently oversees multiple sites, leading teams in strategic planning and coaching/practicing continuous improvement. William is set to start his eighth year of teaching at the University of Cincinnati where he teaches marketing, finance, and management. William holds various certifications in change management, quality, leadership, operational excellence, team building, and DiSC, among others.
LA HUG - Video Testimonials with Chynna Morgan - June 2024Lital Barkan
Have you ever heard that user-generated content or video testimonials can take your brand to the next level? We will explore how you can effectively use video testimonials to leverage and boost your sales, content strategy, and increase your CRM data.🤯
We will dig deeper into:
1. How to capture video testimonials that convert from your audience 🎥
2. How to leverage your testimonials to boost your sales 💲
3. How you can capture more CRM data to understand your audience better through video testimonials. 📊
VAT Registration Outlined In UAE: Benefits and Requirementsuae taxgpt
Vat Registration is a legal obligation for businesses meeting the threshold requirement, helping companies avoid fines and ramifications. Contact now!
https://viralsocialtrends.com/vat-registration-outlined-in-uae/
2. FORWARD-LOOKING STATEMENTS
Forward-looking statements are included in the following presentations. These forward-looking statements are identified by the use of terms and
phrases such as “anticipate”, “believe”, “could”, “estimate”, “expect”, “intend”, “may”, “plan”, “predict”, “project”, “will”, “would”, and similar terms and
phrases, including references to assumptions. Such statements may involve but are not limited to comments with respect to strategies, expectations,
objectives, goals, aspirations, intentions, planned operations or future actions.
Forward-looking statements, by their nature, are based on assumptions and are subject to important risks and uncertainties. Any forecasts,
predictions or forward-looking statements cannot be relied upon due to, among other things, changing external events and general uncertainties of the
business and its corporate structure. Results indicated in forward-looking statements may differ materially from actual results for a number of reasons,
including without limitation, dependency on top Accumulation Partners and clients, conflicts of interest, greater than expected redemptions for
rewards, regulatory matters, retail market/economic conditions, industry competition, Air Canada liquidity issues, Air Canada or travel industry
disruptions, airline industry changes and increased airline costs, supply and capacity costs, unfunded future redemption costs, failure to safeguard
databases and consumer privacy, changes to coalition loyalty programs, seasonal nature of the business, other factors and prior performance, foreign
operations, legal proceedings, reliance on key personnel, labour relations, pension liability, technological disruptions and inability to use third party
software, failure to protect intellectual property rights, interest rate and currency fluctuations, leverage and restrictive covenants in current and future
indebtedness, uncertainty of dividend payments, managing growth, credit ratings, as well as the other factors identified throughout this presentation
and throughout our public disclosure record on file with the Canadian securities regulatory authorities.
The forward-looking statements contained herein represent the expectations of Groupe Aeroplan Inc., doing business as Aimia (“Aimia”), as of May 3,
2012 and are subject to change. However, Aimia disclaims any intention or obligation to update or revise any forward-looking statements whether as a
result of new information, future events or otherwise, except as required under applicable securities regulations.
For further information, please contact Investor Relations at 416 352 3728 or trish.moran@aimia.com.
Q1 2012 Financial Highlights 2
4. Q1 2012 CONSOLIDATED FINANCIAL HIGHLIGHTS
Three Months Ended
% Change (5)
March 31,
Year Constant
($ millions except per share amounts) 2012 2011 Over Year Currency (6)
Gross Billings(1) 536.6 527.9 1.7% 1.2%
Gross Billings from sale of Loyalty Units 386.0 362.7 6.4% 6.6%
Total Revenue 567.7 546.2 3.9% 3.5%
Cost of rewards and direct costs 322.4 327.6 (1.6%) (2.1%)
(2)
Gross margin 245.3 218.6 12.2% 12.0%
Gross margin (%) 43.2% 40.0% 319 bps 327 bps
Depreciation and amortization 29.3 31.1 (6.1%) (6.2%)
Operating expenses 140.9 138.0 2.1% 1.6%
Operating income 75.1 49.5 51.9% 52.5%
Share of net earnings of PLM 1.2 6.1 na na
Net earnings 44.6 25.3 76.7% na
Non-GAAP
Adjusted EBITDA(3) 88.9 72.6 22.5% 22.5%
Adjusted EBITDA margin (as a % of Gross Billings) 16.6% 13.7% 281 bps na
Free Cash Flow before dividends paid 18.3 (21.2) 186.6% **
Free Cash Flow before dividends paid per common share (4) 0.09 (0.13) ** **
(1) Variance in Gross Billings from the prior year includes the impact related to the loss of the Qantas business and the remaining phasing-out of the Visa business of $4.7 million and $3.3 million,
respectively.
(2) Before depreciation and amortization.
(3) Applying the current Breakages estimates, Adjusted EBITDA for the three months ended March 31, 2011 would have been $69.2 million. Adjusted EBITDA for the three months ended March 31, 2011
includes $1.4 million of restructuring expenses and $1.9 million of exit costs associated with the phasing out of a portion of the Visa Business.
(4) Calculated as: (Free Cash Flow before common and preferred dividends paid, less preferred dividends)/ weighted average common shares outstanding.
(5) Discrepancies in variances may arise due to rounding.
(6) Constant Currency excludes the translation effect of foreign operations on the consolidated results. For more information on Constant Currency, please refer to Aimia’s May 3, 2012 earnings press
release.
** information not meaningful
Q1 2012 Financial Highlights 4
5. CONSOLIDATED GROSS BILLINGS
Q1 2011 Q1 2012
($ millions) ($ millions)
$536.6
$527.9 ($4.7)
$523.2
+1.7%growth; +1.2% in c.c.(1)
+2.6%growth; +2.1% in c.c.(1)
2011 Reported Loss of Qantas Business Excluding Noted Items 2012 Reported
(1) Constant Currency excludes the translation effect of foreign operations on the consolidated results. For more information on Constant Currency,
please refer to Aimia’s May 3, 2012 earnings press release.
Q1 2012 Financial Highlights 5
6. CONSOLIDATED ADJUSTED EBITDA
Q1 2011 Q1 2012
($ millions) ($ millions)
$88.9
$72.6 ($3.4) $3.3 $72.5
$69.2
+22.5%growth; +22.5% in c.c.(1)
+28.5%growth; +28.6% in c.c.(1)
2 0 11 R e po rt e d B re a k a ge A djus t m e nt E xc luding B re a k a ge R e s t ruc t uring a nd E xc luding N o t e d It e m s 2 0 12 R e po rt e d
A djus t m e nt R e o rga niza t io n C ha rge s
Q1’11 margin(2) = 13.9% Q1’12 margin = 16.6%
(1) Constant Currency excludes the translation effect of foreign operations on the consolidated results. For more information on Constant Currency, please refer to Aimia’s
May 3, 2012 earnings press release.
(2) Adjusted EBITDA excluding noted items divided by Gross Billings excluding noted items.
Q1 2012 Financial Highlights 6
7. FREE CASH FLOW
Free Cash Flow (1) FCF/ Common Share (2)
($ millions)
$18.3
$0.09
$0.09
$197.6
($21.2)
Q1 2012 Q1 2011 Q1 2012 Q1 2011
-$0.13
($0.13)
(1) Free Cash Flow before common and preferred dividends paid.
(2) Calculated as: (Free Cash Flow before common and preferred dividends paid, less preferred dividends)/ weighted average common shares outstanding.
Q1 2012 Financial Highlights 7
8. CANADA – Q1 2012 FINANCIAL HIGHLIGHTS
Three Months Ended
% Change (3)
March 31,
($ millions) 2012 2011(2) Year Over Year
Gross Billings
Aeroplan 273.7 275.2 (0.6%)
Proprietary Loyalty 58.5 59.0 (0.7%)
Intercompany eliminations (19.0) (14.3) na Positive results despite
313.2 319.9 (2.1%) challenging market
Total revenue conditions
Aeroplan 332.4 309.7 7.3%
Proprietary Loyalty 59.3 59.2 0.2%
Intercompany eliminations (19.0) (14.3) na
372.7 354.6 5.1%
Gross margin (1)
Gross margin (%) 47.8% 42.4% 546 bps
Aeroplan 154.4 125.1 23.4%
Proprietary Loyalty 24.3 25.2 (3.5%)
Intercompany eliminations (0.4) - na
178.3 150.3 18.6%
Operating income
Aeroplan 93.5 64.7 44.5%
Proprietary Loyalty 4.3 8.0 (45.9%)
97.8 72.7 34.5%
Adjusted EBITDA
Adjusted EBITDA margin (as a % of Gross Billings) 31.1% 27.5% 358 bps
Aeroplan 90.5 77.2 17.3%
Proprietary Loyalty 6.9 10.8 (36.4%)
97.4 88.0 10.7%
(1) Before depreciation and amortization.
(2) Intercompany revenue and expenses related to the comparative period have been reclassified to conform with the presentation adopted in
the current period.
(3) Discrepancies in variances may arise due to rounding.
Q1 2012 Financial Highlights 8
9. EMEA – Q1 2012 FINANCIAL HIGHLIGHTS
Three Months Ended
% Change (3)
March 31,
Wins with Year Constant
existing clients in
($ millions) 2012 2011 (2)
Wins Customer Currency (4)
both with existing clients in
Over Year Loyalty and
both CustomerLoyalty and
Business Loyalty
Gross Billings 143.9 120.9 Business Loyalty
19.0% 19.7%
Decrease in Gross Billings
Total revenue 117.1 104.1 Decrease in Gross by the 13.1%
mostly 12.5%
explained Billings
(1)
Gross margin 33.0 33.3 mostly explained by the
phasing(1.0%) a portion of 0.3%
out of
Gross margin (%) 28.2% 32.0% the Visa businessportion(365 bps)
phasing out of a in the US
(385 bps) of
therepresenting $5.8MMUS
Visa business in the
Operating income (loss) (6.4) (2.4) (170.8%) (159.7%)
representing $5.8MM
Adjusted EBITDA 4.0 3.2 25.9% 35.6%
Adjusted EBITDA margin (%) 2.8% 2.6% 15 bps 35 bps
Adjusted for Change in Breakage Estimate
Adjusted EBITDA - On a consistent breakage rate basis 4.0 (0.2) ** **
Adjusted EBITDA margin (%) 2.8% (0.2%) 296 bps 316 bps
(1) Before depreciation and amortization.
(2) Intercompany revenue and expenses related to the comparative period have been reclassified to conform with the presentation adopted in the current period.
(3) Discrepancies in variances may arise due to rounding.
(4) Constant Currency excludes the translation effect of foreign operations on the consolidated results. For more information on Constant Currency, please refer to Aimia’s May 3, 2012 earnings press
release.
** information not meaningful
Q1 2012 Financial Highlights 9
10. US & APAC – Q1 2012 FINANCIAL HIGHLIGHTS
Three Months Ended
% Change (3)
March 31,
Year Over Constant
($ millions) 2012 2011(2) Year Currency (4)
Gross Billings 80.9 88.0 (8.0%) (11.7%)
Total revenue 79.3 88.3 (10.2%) (13.6%)
Gross margin (1) 35.3 35.7 (1.1%) (3.8%)
Gross margin (%) 44.6% 40.5% Proprietary loyalty services bps
411 bps 458
Operating income (loss) (1.9) (9.1) (formerly Carlson Marketing)
79.2% 79.7%
on track to deliver AEBITDA
Adjusted EBITDA 1.8 (6.9) % margin of between 6%122.7%
126.6% -
Adjusted EBITDA margin (%) 2.3% (7.8%) 8%, excluding restructuring
** **
and VISA exit costs.
Excluding One-Time Items
Adjusted EBITDA - Excluding restructuring and exit costs 1.8 (3.6) ** **
Adjusted EBITDA margin (%) 2.3% (4.1%) 632 bps 608 bps
(1) Before depreciation and amortization.
(2) Intercompany revenue and expenses related to the comparative period have been reclassified to conform with the presentation adopted in the current period.
(3) Discrepancies in variances may arise due to rounding.
(4) Constant Currency excludes the translation effect of foreign operations on the consolidated results. For more information on Constant Currency, please refer to
Aimia’s May 3, 2012 earnings press release.
** information not meaningful
Q1 2012 Financial Highlights 10
11. CLUB PREMIER (PLM)
2010 2011 2012
Quarter Quarter Quarter Quarter
Quarter Total
Sept. 12, Sept. 13 to ended ended ended ended
2010 Dec.31, 2010
ended March
Sept. 30,
Wins with existing clients in
March 31,
31, 2011 June 30, 2011 Dec. 31, 2011 2011 Wins Customer Loyalty and
both with existing clients in
2011 2012
both CustomerLoyalty and
Business Loyalty
Gross
N/A $26.4M USD $24.5M USD $28.8M USD $29.8M USD $31.9M USD $115.0M USD Business Loyalty
$32.1M USD
Billings Decrease in Gross Billings
Decrease in Gross by the
mostly explained Billings
Members
2,744,334 2,786,621 2,825,044 2,889,784 2,976,999 3,044,099 phasing explained by the
mostly out of a portion of
3,044,099 3,102,383
Enrolled the Visa businessportion US
phasing out of a in the of
therepresenting $5.8MMUS
Visa business in the
Partners 57 56 57 59 60 64 64 67
representing $5.8MM
Number
of
N/A 75,618 68,627 72,217 76,912 78,900 296,656 77,045
Rewards
Issued
New
Members N/A 42,287 38,423 64,740 87,215 67,100 257,478 58,284
Enrolled
• Key Q1 2012 metrics include:
− US$32 million in Gross Billings (over 30% growth versus prior year)
− More than 30% Adjusted EBITDA margin
• Based on performance to date, we anticipate that Club Premier will be in a position to begin paying dividends before the
end of 2012 without affecting the program’s ability to execute its expansion and capital investment plans
Q1 2012 Financial Highlights 11
12. LIQUIDITY
Mar 31, 2012 Dec 31, 2011
($ millions) • On April 13, 2012,
Aimia extended the
term of its existing
Cash and cash equivalents $179.8 $202.1 $300 million revolving
facility by 2 years to
Restricted cash $17.4 $15.1 April 23, 2016 and
obtained an additional
Short-term investments $52.9 $58.4 revolving facility in an
amount not to exceed
Long-term investments in bonds $280.7 $279.7 $200 million, for any
term it may request not
$530.8 $555.3 extending beyond the
new maturity date.
• On April 23, 2012,
Current portion of long-term debt $200.0 $200.0 Senior Secured Notes
Series 1 of $200 million
Long-term debt $372.1 $386.7 were repaid with funds
drawn from the
Total Debt $572.1 $586.7 additional revolving
facility.
Q1 2012 Financial Highlights 12
13. COMMON DIVIDENDS
AIM Payout Ratio Dividend Yield
Dividend policy will continue to be reviewed annually to
ensure that growth in the payout ratio is proportionate to
Aimia’s free cash flow generation.
6.0%
Dividends 5.0%
($ millions)
4.0%
$113
$108
$100
3.0%
2.0%
$29 1.0%
0.0%
Q110 Q210 Q310 Q410 Q111 Q2 Q211 Q3 Q311 Q4 Q411Q1
1/4/2010
2/4/2010
3/4/2010
4/4/2010
5/4/2010
6/4/2010
7/4/2010
8/4/2010
9/4/2010
10/4/2010
11/4/2010
12/4/2010
1/4/2011
2/4/2011
3/4/2011
4/4/2011
5/4/2011
6/4/2011
7/4/2011
8/4/2011
9/4/2011
10/4/2011
11/4/2011
12/4/2011
1/4/2012
2/4/2012
3/4/2012
4/4/2012
2009 2010 2011 2012 Q1 Q2 Q3 Q4 Q1
Q112
2010 2010 2010 2010 2011 2011 2011 2011 2012
Common Preferred
• Common Share Dividend
Increase of 6.7% to $0.64 per share per year
Dividend yield to exceed 5% based on May 3, 2012 closing price
Q1 2012 Financial Highlights 13
14. COMMON SHARE REPURCHASE SUMMARY
Average
Common Total
Price Per Common Shares Repurchased (MM)
Initial NCIB Shares Consideration
Common
Repurchased (MM) Average Price per Common Share
Share
Total Shares Repurchased to May 13, 2011 19,983,631 $233.0 $11.66
$12.58
$12.34
Renewed NCIB
May 16, 2011 – December 31, 2011 6,262,800 $75.8 $12.10 $10.94
January 1, 2012 – March 31, 2012 480,000 $5.9 $12.30 13.0 13.2
Initial and Renewed NCIB
Total Shares Repurchased to 26,726,431 $314.7 $11.77
March 31, 2012
March 31, 2012 – May 3, 2012 1,481,900 $18.3 $12.35
2.0
Total Shares Repurchased 28,208,331 $333.0 $11.80
Total Common Shares Outstanding as at: FY 2010 FY 2011 Q1 2012
March 31, 2012 173.4 million
May 3, 2012 171.9 million
Q1 2012 Financial Highlights 14
15. 2012 OUTLOOK
For the year ending December 31, 2012, Aimia expects to report the following:
Key Financial Metric Target Range
Consolidated Outlook
Gross Billings Growth 1 Between 3% and 5%
Adjusted EBITDA2 Between $370 and $380 million
Free Cash Flow 2,3 Between $220 million and $240 million
Capital Expenditures To approximate $55 million
Current income tax rate is anticipated to approximate 27% in Canada and 17% in Italy. The Corporation
Income Taxes
expects no significant cash income taxes will be incurred in the rest of its foreign operations.
Business Segment Gross Billings Growth Outlook
Canada Between 2% and 4%
EMEA Between 8% and 11%
US & APAC1 Between -2% and 2%
Other
Nectar Italia Greater than €60 million in Gross Billings
1. The Gross Billings growth guidance excludes the effect of a client loss (Qantas) in APAC at the end of the first quarter of 2012. The target growth ranges are based on 2011 reported Gross Billings, excluding $40 million related to
Qantas. The client loss will have a negligible impact on Adjusted EBITDA
2. The Adjusted EBITDA and Free Cash Flow outlook range includes an assumption of planned incremental operating expenses in business development activities, principally in the U.S., India and Brazil, technology platform related
expenditures that are operating in nature and additional brand related expenses associated with our new branding, which in total will approximate $20 million in 2012.
3. Free Cash Flow before Dividends
The above guidance excludes the effects of fluctuations in currency exchange rates. In addition, Aimia made a number of economic and market assumptions in preparing its 2012 forecasts, including assumptions regarding
the performance of the economies in which the Corporation operates and market competition and tax laws applicable to the Corporation's operations.
Q1 2012 Financial Highlights 15
17. GROSS BILLINGS
Three Months Ended
% Change (3)
March 31,
Year Over Constant
($ millions) 2012 2011(2) Year Currency (4)
Canada
Aeroplan 273.7 275.2 (0.6%) (0.6%)
Proprietary Loyalty 58.5 59.0 (0.7%) (0.7%)
Intracompany eliminations (19.0) (14.3) na na
313.2 319.9 (2.1%) (2.1%)
(1)
EMEA 143.9 120.9 19.0% 19.7%
US & APAC 80.9 88.0 (8.0%) (11.7%)
Intercompany eliminations (1.4) (0.9) na na
Consolidated 536.6 527.9 1.7% 1.2%
Excluding One-Time Items
Excluding Quantas Business 536.6 523.2 2.6% 2.1%
(1) Includes Nectar Italia Gross Billings of €14.5 million for the three month period ended March 31, 2012.
(2) Intercompany revenue and expenses related to the comparative period have been reclassified to conform with the
presentation adopted in the current period. EMEA
27%
(3) Discrepancies in variances may arise due to rounding. Canada
58%
(4) Constant Currency excludes the translation effect of foreign operations on the consolidated results. For more information
on Constant Currency, please refer to Aimia’s May 3, 2012 earnings press release.
$536.6MM
Three Months Ended
US & APAC
March 31, 2012 15%
Q1 2012 Financial Highlights 17
18. ADJUSTED EBITDA
Three Months Ended
% Change (1)
March 31,
Year Over Constant
($ millions) 2012 2011 Year Currency (2)
Canada
Aeroplan Canada 90.5 77.2 17.3% 17.3%
Proprietary Loyalty 6.9 10.8 (36.4%) (36.4%)
97.4 88.0 10.7% 10.7%
EMEA 4.0 3.2 25.9% 35.6%
US & APAC 1.8 (6.9) 126.6% 122.7%
Corporate (14.4) (11.8) (22.2%) (22.2%)
Consolidated 88.9 72.6 22.5% 22.5%
(1) Discrepancies in variances may arise due to rounding.
(2) Constant Currency excludes the translation effect of foreign operations on the consolidated results. For more information on Constant Currency, please refer to Aimia’s May 3, 2012 earnings press
release.
Q1 2012 Financial Highlights 18
19. AEROPLAN – REVENUE AND MILES
Revenue Breakdown
Three Months Ended March 31,
(in $ millions) 2012 2011 Change % Change
Miles revenue 263.2 243.3 20.0 8.2%
Breakage revenue 57.2 52.9 4.3 8.2%
Other 11.9 13.6 (1.6) (12.0)%
Total Revenue 332.4 309.7 22.7 7.3%
Aeroplan Miles Issued & Redeemed Average Selling Price & Cost
(billions) (cents / mile)
21.4 1.26 1.25
21.0
20.9 0.93
0.83
19.9
Q1 2012 Q1 2011 Q1 2012 Q1 2011
Aeroplan Miles Issued Aeroplan Miles Redeemed Average Selling Price Average Cost/ Aeroplan Mile Redeemed
Q1 2012 Financial Highlights 19
20. GROSS BILLINGS FROM SALE OF LOYALTY UNITS BY
MAJOR PARTNER
Q1 2012 Gross Billings Q1 2011 Gross Billings
from sale of Loyalty Units from sale of Loyalty Units
22.9% 20.2%
33.5%
34.6%
$386.0M $362.7M
20.3%
17.6%
16.2% 15.3%
9.8% 9.6%
Partner A Partner B Partner C Air Canada Other
Q1 2012 Financial Highlights 20
21. FOREIGN EXCHANGE RATES
Period Rates Q1 2012 Q1 2011 Change % Change
Period end rate £ to $ 1.5940 1.5595 0.0345 2.2%
Average quarter £ to $ 1.5734 1.5803 (0.0069) (0.4%)
Average YTD £ to $ 1.5734 1.5803 (0.0069) (0.4%)
Period end rate AED to $ 0.2714 0.2646 0.0068 2.6%
Average quarter AED to $ 0.2727 0.2685 0.0042 1.6%
Average YTD AED to $ 0.2727 0.2685 0.0042 1.6%
Period end rate AED to £ 0.1702 0.1699 0.0003 0.2%
Average quarter AED to £ 0.1733 0.1700 0.0033 1.9%
Average YTD AED to £ 0.1733 0.1700 0.0033 1.9%
Period end rate USD to $ 0.9970 0.9696 0.0274 2.8%
Average quarter USD to $ 1.0020 0.9861 0.0159 1.6%
Average YTD USD to $ 1.0020 0.9861 0.0159 1.6%
Period end rate € to $ 1.3298 1.3782 (0.0484) (3.5%)
Average quarter € to $ 1.3130 1.3487 (0.0357) (2.6%)
Average YTD € to $ 1.3130 1.3487 (0.0357) (2.6%)
Q1 2012 Financial Highlights 21