SlideShare a Scribd company logo
1 of 8
Download to read offline
ALLTEL CORPORATION
CONSOLIDATED HIGHLIGHTS AND OTHER FINANCIAL INFORMATION
(In thousands, except per share amounts)

                                                                                                                   THREE MONTHS ENDED
                                                                                                                                             Increase
                                                                                                 March 31,             March 31,            (Decrease)
                                                                                                   2007                  2006                Amount        %
UNDER GAAP:
 Service revenues                                                                            $    1,880,120        $    1,649,148       $      230,972      14
 Total revenues and sales
    Wireless                                                                                 $    2,078,548        $    1,843,233       $      235,315      13
 Operating income
    Wireless                                                                                 $      354,291        $      291,954       $       62,337      21
 Service revenue operating margin (A)                                                                 18.8%                 17.7%                  1.1%      6
 Operating margin (B)
    Wireless                                                                                          17.0%                 15.8%                  1.2%      8
 Income from continuing operations                                                           $      230,283        $      134,184       $       96,099      72
 Net income                                                                                  $      230,138        $      297,407       $      (67,269)    (23)
 Earnings per share:
    Basic                                                                                               $.64                 $.77                 $(.13)   (17)
    Diluted                                                                                             $.64                 $.77                 $(.13)   (17)

 Weighted average common shares:
   Basic                                                                                            357,180                                    (29,602)      (8)
                                                                                                                            386,782
   Diluted                                                                                          359,815                                    (29,861)      (8)
                                                                                                                            389,676

 Capital expenditures (C)                                                                    $    169,648          $    158,387         $     11,261         7
 Total assets                                                                                $ 17,575,613          $ 24,046,118         $ (6,470,505)      (27)

FROM CURRENT BUSINESSES (NON-GAAP) (D):
  Operating income                                                                           $      406,518        $      348,236       $       58,282      17
  Service revenue operating margin (A)                                                                21.6%                 21.1%                   .5%      2
  Operating margin (B)                                                                                19.6%                 18.9%                   .7%      4
  Net income                                                                                 $      225,437        $      168,573       $       56,864      34
  Earnings per share:
    Basic                                                                                              $.63                  $.44                 $.19      43
    Diluted                                                                                            $.63                  $.43                 $.20      47
  Equity free cash flow (E)                                                                   $      359,417        $      264,006       $       95,411      36


 (A) Service revenue operating margin is calculated by dividing operating income by service revenues.
 (B) Operating margin is calculated by dividing operating income by total revenues and sales.
 (C) Includes capitalized software development costs.
 (D) Current businesses excludes the effects of discontinued operations, amortization expense related to acquired, finite-lived intangible assets, gain on disposal of
              assets and integration expenses and other charges.
 (E) Equity free cash flow is calculated as the sum of net income from current businesses plus depreciation expense less capital expenditures, which includes
             capitalized software development costs as indicated in Note C.


                  Operating results from current businesses have been reconciled to operating results under GAAP on page 6 of this release.
                                                                          -more-
ALLTEL CORPORATION
CONSOLIDATED STATEMENTS OF INCOME UNDER GAAP-Page 2
(In thousands, except per share amounts)

                                                                        THREE MONTHS ENDED
                                                                     March 31,       March 31,
                                                                       2007            2006
Revenues and sales:
    Service revenues                                             $ 1,880,120        $ 1,649,148
    Product sales                                                    198,428            194,085
       Total revenues and sales                                    2,078,548          1,843,233
Costs and expenses:
    Cost of services                                                   610,995            542,784
    Cost of products sold                                              287,509            272,697
    Selling, general, administrative and other                         469,898            425,696
    Depreciation and amortization                                      349,505            299,312
    Integration expenses and other charges                               6,350             10,790
       Total costs and expenses                                      1,724,257          1,551,279
Operating income                                                       354,291           291,954
Equity earnings in unconsolidated partnerships                          14,979             12,932
Minority interest in consolidated partnerships                          (9,694)           (13,895)
Other income, net                                                        7,672             10,791
Interest expense                                                       (46,695)           (84,716)
Gain on disposal of assets                                              56,548                -
Income from continuing operations before income taxes                  377,101           217,066
Income taxes                                                           146,818            82,882
Income from continuing operations                                      230,283           134,184
Income (loss) from discontinued operations                                (145)          163,223
Net income                                                             230,138           297,407
Preferred dividends                                                         20                21
Net income applicable to common shares                           $     230,118      $    297,386

Basic earnings per share:
  Income from continuing operations                                       $.64               $.35
  Income (loss) from discontinued operations                               -                  .42
  Net income                                                              $.64               $.77

Diluted earnings per share:
   Income from continuing operations                                      $.64               $.35
   Income (loss) from discontinued operations                              -                  .42
   Net income                                                             $.64               $.77


                                                        -more-
ALLTEL CORPORATION
CONSOLIDATED BALANCE SHEETS UNDER GAAP-Page 3
(In thousands)


ASSETS                                                                                  LIABILITIES AND SHAREHOLDERS' EQUITY

                                                  March 31,   December 31,                                                                     March 31,     December 31,
                                                    2007         2006                                                                            2007           2006

CURRENT ASSETS:                                                                         CURRENT LIABILITIES:
  Cash and short-term investments             $     576,829   $     934,228                Current maturities of long-term debt            $      75,263     $      36,285
  Accounts receivable (less allowance for                                                  Accounts payable                                      487,872           576,126
     doubtful accounts of $43,101 and                                                      Advance payments and customer deposits                204,908           186,193
     $54,865, respectively)                         765,223         807,307                Accrued taxes                                         204,246           114,109
  Inventories                                       214,362         218,629                Accrued dividends                                      44,644            46,039
  Prepaid expenses and other                         82,373          67,665                Accrued interest                                       49,057            79,281
  Assets related to discontinued operations           3,976           4,321                Other current liabilities                             153,226           156,471
                                                                                          Liabilities related to discontinued operations             374             2,761
   Total current assets                           1,642,763        2,032,150
                                                                                           Total current liabilities                            1,219,590         1,197,265
Investments                                         184,540          368,871
Goodwill                                          8,418,777        8,447,013
Other intangibles                                 2,083,806        2,129,346            Long-term debt                                          2,661,310         2,697,412
                                                                                        Deferred income taxes                                   1,059,562         1,109,479
PROPERTY, PLANT AND EQUIPMENT:                                                          Other liabilities                                         698,733           677,609
  Land                                              322,142          314,902
  Buildings and improvements                        973,330          955,061              Total liabilities                                     5,639,195         5,681,765
  Operating plant and equipment                   8,144,201        7,933,840
  Information processing                          1,081,295        1,048,136
  Furniture and fixtures                             177,268          173,835            SHAREHOLDERS' EQUITY:
  Under construction                                360,060          495,968               Preferred stock                                            253               258
                                                                                           Common stock                                           350,411           364,572
   Total property, plant and equipment         11,058,296         10,921,742               Additional paid-in capital                           3,433,180         4,296,786
   Less accumulated depreciation                5,971,119          5,690,360               Accumulated other comprehensive income (loss)          (27,042)            9,525
                                                                                           Retained earnings                                    8,179,616         7,990,808
   Net property, plant and equipment              5,087,177        5,231,382
                                                                                           Total shareholders' equity                          11,936,418        12,661,949
Other assets                                        114,011          89,455
Assets related to discontinued operations            44,539          45,497
                                                                                        TOTAL LIABILITIES AND
TOTAL ASSETS                                  $ 17,575,613    $ 18,343,714              SHAREHOLDERS' EQUITY                               $ 17,575,613      $ 18,343,714


                                                                               -more-
ALLTEL CORPORATION
CONSOLIDATED STATEMENTS OF CASH FLOWS UNDER GAAP-Page 4
(In thousands)
                                                                                 THREE MONTHS ENDED
                                                                              March 31,       March 31,
                                                                                2007            2006
Net Cash Provided from Operations:
  Net income                                                                  $ 230,138      $ 297,407
  Adjustments to reconcile net income to net cash provided from operations:
     Loss (income) from discontinued operations                                    145        (163,223)
     Depreciation and amortization expense                                     349,505         299,312
     Provision for doubtful accounts                                            37,261          48,700
     Non-cash portion of gain on disposal of assets                            (56,548)            -
     Change in deferred income taxes                                            12,155          40,487
     Other, net                                                                 (6,722)            (70)
  Changes in operating assets and liabilities, net of the effects of
  acquisitions and dispositions:
     Accounts receivable                                                         3,559          (8,693)
     Inventories                                                                 4,267          36,664
     Accounts payable                                                          (89,778)       (100,635)
     Other current liabilities                                                  99,001         (46,801)
     Other, net                                                                (21,822)        (18,311)
            Net cash provided from operations                                  561,161         384,837

Cash Flows from Investing Activities:
  Additions to property, plant and equipment                                   (161,855)      (150,673)
  Additions to capitalized software development costs                            (7,793)        (7,714)
  Purchases of property, net of cash acquired                                    (2,500)      (458,931)
  Proceeds from the sale of investments                                         188,711            -
  Proceeds from the return on investments                                        10,931          8,914
  Other, net                                                                       (356)         7,319
           Net cash provided from (used in) investing activities                 27,138       (601,085)

Cash Flows from Financing Activities:
  Dividends on common and preferred stock                                       (45,961)      (147,737)
  Repayments of long-term debt                                                     (664)          (689)
  Distributions to minority investors                                            (7,772)       (11,810)
  Repurchases of common stock                                                  (938,784)           -
  Excess tax benefits from stock option exercises                                  3,830          3,381
  Cash payments to effect conversion of convertible notes                           -          (59,848)
  Common stock issued                                                            42,448         54,896
            Net cash used in financing activities                               (946,903)      (161,807)

Cash Flows from Discontinued Operations:
  Cash provided from operating activities                                         1,929        434,471
  Cash used in investing activities                                                (724)       (65,813)
  Cash used in financing activities                                                  -          (91,757)
           Net cash provided from discontinued operations                         1,205        276,901

Effect of exchange rate changes on cash and short-term investments                  -              585

Decrease in cash and short-term investments                                    (357,399)      (100,569)

Cash and Short-term Investments:
  Beginning of the period                                                       934,228        982,407
  End of the period                                                           $ 576,829      $ 881,838
                                                             -more-
ALLTEL CORPORATION
SUPPLEMENTAL OPERATING INFORMATION-Page 5
(Dollars in thousands, except per customer amounts)

                                                                                                                      THREE MONTHS ENDED
                                                                                                                                      Increase
                                                                                                        March 31,       March 31,    (Decrease)
                                                                                                          2007            2006        Amount             %

   Controlled POPs                                                                                     79,575,793      77,292,038       2,283,755         3
   Customers                                                                                           12,060,572      10,827,065       1,233,507        11
   Penetration rate                                                                                         15.2%           14.0%             1.2%        9
   Average customers                                                                                   11,940,660      10,731,389       1,209,271        11
   Gross customer additions:
          Internal                                                                                        867,473          805,454         62,019            8
          Acquired                                                                                            -                -              -              -
          Total                                                                                           867,473          805,454         62,019            8
   Net customer additions:
          Internal                                                                                        236,634          164,741         71,893        44
          Acquired                                                                                            -                -              -           -
          Total                                                                                           236,634          164,741         71,893        44
   Cash costs:
          Cost of services                                                                             $ 610,995       $ 542,784        $ 68,211         13
          Cost of products sold                                                                           287,509         272,697          14,812         5
          Selling, general, administrative and other                                                      469,898         425,696          44,202        10
          Less product sales                                                                              198,428         194,085           4,343         2
          Total                                                                                        $1,169,974      $1,047,092       $ 122,882        12
   Cash costs per unit per month (A)                                                                       $32.66          $32.52            $.14         -
   Revenues:
          Service revenues                                                                             $1,880,120      $1,649,148       $ 230,972        14
          Less wholesale roaming revenues                                                                 154,187         151,003           3,184         2
          Less wholesale transport revenues                                                                46,434          10,350          36,084       349
          Retail revenues                                                                              $1,679,499      $1,487,795       $ 191,704        13
   Average revenue per customer per month (B)                                                              $52.49          $51.23           $1.26         2
   Retail revenue per customer per month (C)                                                               $46.88          $46.21             $.67        1
   Retail minutes of use per customer per month (D)                                                           651             610               41        7
   Postpay churn                                                                                            1.33%           1.66%           (.33%)      (20)
   Total churn                                                                                              1.77%           2.00%           (.23%)      (12)

   (A) Cash costs per unit per month is calculated by dividing the sum of the reported cost of services, cost of products sold, selling, general, administrative and other
            expenses less product sales, as reported in the Consolidated Statements of Income, by the number of average customers for the period.
   (B) Average revenue per customer per month is calculated by dividing service revenues by average customers for the period.
   (C) Retail revenue per customer per month is calculated by dividing retail revenues (service revenues less wholesale revenues) by average customers for the period.
   (D) Retail minutes of use per customer per month represents the average monthly minutes that Alltel's customers use on both the Company's network and while roaming on
         other carriers' networks.


                                                                              -more-
ALLTEL CORPORATION
RECONCILIATIONS OF RESULTS OF OPERATIONS UNDER GAAP TO RESULTS OF OPERATIONS FROM CURRENT BUSINESSES (NON-GAAP)-Page 6
(In thousands)


                                                                                                       THREE MONTHS ENDED MARCH 31, 2007
                                                                                                     Income                  Income
                                                                       Depreciation                   Before                  From                         Basic      Diluted
                                                                           and         Operating     Income      Income    Continuing      Net           Earnings    Earnings
                                                                       Amortization     Income        Taxes       Taxes     Operations   Income          Per Share   Per Share
                                                                                                                                                            $.64        $.64
Under GAAP                                                             $    349,505   $ 354,291     $ 377,101   $ 146,818  $ 230,283    $ 230,138
Items excluded from measuring results from current businesses:
       Amortization expense related to acquired,
                                                                                                                                                             .08         .08
           finite-lived intangible assets                        (A)       (45,877)      45,877        45,877       17,846       28,031       28,031
                                                                                                                                                             .01         .01
       Integration expenses and other charges                    (B)           -          6,350         6,350        2,471        3,879        3,879
       Gain on disposal of assets                                                                                                                           (.10)       (.10)
                                                                 (C)           -            -         (56,548)     (19,792)     (36,756)     (36,756)
                                                                                                                                                             -           -
       Loss from discontinued operations                         (E)           -            -             -            -            -            145
                                                                                                                                                            (.01)       (.01)
                   Net increase (decrease)                                 (45,877)      52,227        (4,321)         525       (4,846)      (4,701)
                                                                                                                                                            $.63        $.63
From current businesses                                                $   303,628    $ 406,518     $ 372,780    $ 147,343    $ 225,437    $ 225,437


                                                                                                       THREE MONTHS ENDED MARCH 31, 2006
                                                                                                     Income                  Income
                                                                       Depreciation                   Before                  From                         Basic      Diluted
                                                                           and         Operating     Income      Income    Continuing      Net           Earnings    Earnings
                                                                       Amortization     Income        Taxes       Taxes     Operations   Income          Per Share   Per Share
                                                                                                                                                            $.77        $.77
Under GAAP                                                             $    299,312   $ 291,954     $ 217,066   $ 82,882   $ 134,184    $ 297,407
Items excluded from measuring results from current businesses:
       Amortization expense related to acquired,
                                                                                                                                                             .07         .07
           finite-lived intangible assets                        (A)       (45,492)      45,492        45,492       17,696       27,796        27,796
                                                                                                                                                             .02         .01
       Integration expenses and other charges                    (D)           -         10,790        10,790        4,197        6,593         6,593
                                                                                                                                                            (.42)       (.42)
       Income from discontinued operations                       (E)           -            -             -            -            -        (163,223)
                                                                                                                                                            (.33)       (.34)
                   Net increase (decrease)                                 (45,492)      56,282        56,282       21,893       34,389      (128,834)
                                                                                                                                                            $.44        $.43
From current businesses                                                $   253,820    $ 348,236     $ 273,348    $ 104,775    $ 168,573    $ 168,573


                                                                                           -more-
ALLTEL CORPORATION
RECONCILIATIONS OF RESULTS OF OPERATIONS UNDER GAAP TO RESULTS OF OPERATIONS FROM CURRENT BUSINESSES (NON-GAAP)-Page 7
(In thousands)

                                                                                                THREE MONTHS ENDED
                                                                                               March 31,     March 31,
                                                                                                2007           2006


Net cash provided from operations                                                          $     561,161     $   384,837
Adjustments to reconcile to net income under GAAP:
      Income (loss) from discontinued operations                                                     (145)        163,223
      Depreciation and amortization expense                                                      (349,505)       (299,312)
      Provision for doubtful accounts                                                             (37,261)        (48,700)
      Non-cash portion of gain on disposal of assets                                               56,548             -
      Change in deferred income taxes                                                             (12,155)        (40,487)
      Other non-cash changes, net                                                                   6,722               70
      Changes in operating assets and liabilities, net of the
         effects of acquisitions and dispositions                                                  4,773         137,776
Net income under GAAP                                                                            230,138         297,407
Adjustments to reconcile to net income from current businesses,
  net of tax (see specific items listed on page 6)                                                (4,701)        (128,834)
Net income from current businesses                                                               225,437          168,573
Adjustments to reconcile to equity free cash flow from current businesses:
      Depreciation expense from current businesses                                                303,628         253,820
      Capital expenditures                                                                       (169,648)       (158,387)
Equity free cash flow from current businesses                                              $      359,417    $    264,006

                                                                             -more-
ALLTEL CORPORATION
NOTES TO RECONCILIATIONS OF RESULTS OF OPERATIONS UNDER GAAP TO RESULTS OF OPERATIONS FROM CURRENT BUSINESSES (NON-GAAP)-Page 8


      As disclosed in the ALLTEL Corporation (quot;Alltelquot; or the quot;Companyquot;) Form 8-K filed on April 27, 2007, Alltel has presented in this earnings release results of operations from current businesses which
      exclude the effects of discontinued operations, amortization expense related to acquired, finite-lived intangible assets, gain on disposal of assets and integration expenses and other charges. Alltel's purpose for
      excluding items from the current business measures is to focus on Alltel’s true earnings capacity associated with providing wireless communications services. Management believes the items excluded from
      the current business measures are related to strategic activities or other events, specific to the time and opportunity available, and, accordingly, should be excluded when evaluating the trends of the Company's
      operations.

      Alltel believes that presenting the current business measures assists investors in assessing the true business performance of the Company by clarifying for investors the effects that certain items such as asset
      sales, integration expenses and other business consolidation costs arising from past acquisition and integration activities had on the Company’s GAAP consolidated results of operations. The Company uses
      results from current businesses as management’s primary measure of the performance of its business operations. Alltel's management, including the chief operating decision-maker, uses the current business
      measures consistently for all purposes, including internal reporting purposes, the evaluation of business objectives, opportunities and performance and the determination of management compensation.


(A)   Eliminates the effects of amortization expense related to acquired, finite-lived intangible assets.

(B)   The Company incurred $2.6 million of integration expenses related to its acquisitions of Midwest Wireless Holdings (quot;Midwest Wirelessquot;) and wireless properties in Illinois, Texas and Virginia completed
      during 2006. These expenses primarily consisted of branding, signage and computer system conversion costs. Alltel also recorded a pretax charge of $3.7 million associated with the closing of two call
      centers consisting of severance and employee benefit costs related to a planned workforce reduction.
(C)   Alltel completed the sale of marketable equity securities that had been acquired in connection with its August 1, 2005 merger with Western Wireless Corporation (quot;Western Wirelessquot;). In connection with the
      sale of these securities, Alltel recorded a pretax gain of $56.5 million.

(D)   The Company incurred $10.8 million of integration expenses related to its acquisition of Western Wireless. These expenses consisted of $8.3 million of rebranding costs and $2.5 million of system conversion
      costs and other integration costs.
(E)   Eliminates the effects of discontinued operations. Loss from discontinued operations in the first quarter of 2007 included an impairment charge of $1.7 million to reflect the fair value less cost to sell of the
      four rural markets in Minnesota required to be divested, as further discussed below.
      As a condition of receiving approval from the Department of Justice (quot;DOJquot;) and the Federal Communications Commission (quot;FCCquot;) for its acquisition of Midwest Wireless, on September 7, 2006, Alltel
      agreed to divest certain wireless operations in four rural markets in Minnesota. Accordingly, the four markets to be divested in Minnesota have been classified as discontinued operations in the accompanying
      unaudited consolidated financial statements. On April 3, 2007, Alltel completed the sale of these properties.
      On July 17, 2006, Alltel completed the spin-off of its wireline telecommunications business to its stockholders and the merger of that wireline business with Valor Communications Group, Inc. (quot;Valorquot;). The
      spin-off included the majority of Alltel’s communications support services, including directory publishing, information technology outsourcing services, retail long-distance and the wireline sales portion of
      communications products. The new wireline company formed in the merger of Alltel's wireline operations and Valor is named Windstream Corporation. As a result, Alltel's historical results of operations
      have been adjusted to reflect the wireline business as discontinued operations in the accompanying unaudited consolidated financial statements.

      In addition, as a condition of receiving approval for the Western Wireless acquisition from the DOJ and the FCC, Alltel agreed to divest certain wireless operations of Western Wireless in 16 markets in
      Arkansas, Kansas and Nebraska. In December 2005, Alltel completed an exchange of wireless properties with United States Cellular Corporation that included a substantial portion of the divestiture
      requirements related to the merger. In the first quarter of 2006, Alltel completed the required divestitures with the sale of the remaining property in Arkansas. During 2005, Alltel completed the sales of
      international operations in Georgia, Ghana and Ireland acquired from Western Wireless. During the second quarter of 2006, Alltel completed the sales of the remaining international operations acquired from
      Western Wireless in Austria, Bolivia, Côte d’Ivoire, Haiti, and Slovenia. As a result, the acquired international operations and interests of Western Wireless and the 16 markets to be divested in Arkansas,
      Kansas and Nebraska have been classified as discontinued operations in the accompanying unaudited consolidated financial statements.


                                                                                                            -end-

More Related Content

What's hot

Big_Lots_AR2007
Big_Lots_AR2007Big_Lots_AR2007
Big_Lots_AR2007finance50
 
capital one Printer Friendly Version of the Financial Supplement
capital one Printer Friendly Version of the Financial Supplementcapital one Printer Friendly Version of the Financial Supplement
capital one Printer Friendly Version of the Financial Supplementfinance13
 
tribune earnings_q1_07_tables
tribune  earnings_q1_07_tablestribune  earnings_q1_07_tables
tribune earnings_q1_07_tablesfinance47
 
Q1/05Schedules_Baxter
Q1/05Schedules_BaxterQ1/05Schedules_Baxter
Q1/05Schedules_Baxterfinance24
 
pantry 2001AR
pantry  2001ARpantry  2001AR
pantry 2001ARfinance34
 
dover 1Q06_Earnings
dover 1Q06_Earningsdover 1Q06_Earnings
dover 1Q06_Earningsfinance30
 
United Health Group Form 8-K Related to Earnings Release
United Health Group Form 8-K Related to Earnings ReleaseUnited Health Group Form 8-K Related to Earnings Release
United Health Group Form 8-K Related to Earnings Releasefinance3
 
itw 10 q2 q05
itw 10 q2 q05itw 10 q2 q05
itw 10 q2 q05finance16
 
motorola 2001 Summary Annual Report
motorola 	2001 Summary Annual Reportmotorola 	2001 Summary Annual Report
motorola 2001 Summary Annual Reportfinance7
 
alltel 4q 07_highlights
alltel  4q 07_highlightsalltel  4q 07_highlights
alltel 4q 07_highlightsfinance27
 
baxter international Schedules_Q2-05
baxter international Schedules_Q2-05baxter international Schedules_Q2-05
baxter international Schedules_Q2-05finance24
 
yum brands annual reports 2001
 yum brands annual reports 2001 yum brands annual reports 2001
yum brands annual reports 2001finance26
 
Paychex Fiscal 2010 Annual Report
Paychex Fiscal 2010 Annual ReportPaychex Fiscal 2010 Annual Report
Paychex Fiscal 2010 Annual Reportkmdefilipps
 
ppg industries 3Q2007EARNINGSTABLES
ppg industries 3Q2007EARNINGSTABLESppg industries 3Q2007EARNINGSTABLES
ppg industries 3Q2007EARNINGSTABLESfinance22
 
dover Q308_Supplement
dover Q308_Supplementdover Q308_Supplement
dover Q308_Supplementfinance30
 
vppg industries 2Q2008EARNINGSTABLESPDF
vppg industries 2Q2008EARNINGSTABLESPDFvppg industries 2Q2008EARNINGSTABLESPDF
vppg industries 2Q2008EARNINGSTABLESPDFfinance22
 

What's hot (17)

Big_Lots_AR2007
Big_Lots_AR2007Big_Lots_AR2007
Big_Lots_AR2007
 
capital one Printer Friendly Version of the Financial Supplement
capital one Printer Friendly Version of the Financial Supplementcapital one Printer Friendly Version of the Financial Supplement
capital one Printer Friendly Version of the Financial Supplement
 
tribune earnings_q1_07_tables
tribune  earnings_q1_07_tablestribune  earnings_q1_07_tables
tribune earnings_q1_07_tables
 
Q1/05Schedules_Baxter
Q1/05Schedules_BaxterQ1/05Schedules_Baxter
Q1/05Schedules_Baxter
 
pantry 2001AR
pantry  2001ARpantry  2001AR
pantry 2001AR
 
dover 1Q06_Earnings
dover 1Q06_Earningsdover 1Q06_Earnings
dover 1Q06_Earnings
 
hp 2004 /2003Financial Overview
hp 2004 /2003Financial Overviewhp 2004 /2003Financial Overview
hp 2004 /2003Financial Overview
 
United Health Group Form 8-K Related to Earnings Release
United Health Group Form 8-K Related to Earnings ReleaseUnited Health Group Form 8-K Related to Earnings Release
United Health Group Form 8-K Related to Earnings Release
 
itw 10 q2 q05
itw 10 q2 q05itw 10 q2 q05
itw 10 q2 q05
 
motorola 2001 Summary Annual Report
motorola 	2001 Summary Annual Reportmotorola 	2001 Summary Annual Report
motorola 2001 Summary Annual Report
 
alltel 4q 07_highlights
alltel  4q 07_highlightsalltel  4q 07_highlights
alltel 4q 07_highlights
 
baxter international Schedules_Q2-05
baxter international Schedules_Q2-05baxter international Schedules_Q2-05
baxter international Schedules_Q2-05
 
yum brands annual reports 2001
 yum brands annual reports 2001 yum brands annual reports 2001
yum brands annual reports 2001
 
Paychex Fiscal 2010 Annual Report
Paychex Fiscal 2010 Annual ReportPaychex Fiscal 2010 Annual Report
Paychex Fiscal 2010 Annual Report
 
ppg industries 3Q2007EARNINGSTABLES
ppg industries 3Q2007EARNINGSTABLESppg industries 3Q2007EARNINGSTABLES
ppg industries 3Q2007EARNINGSTABLES
 
dover Q308_Supplement
dover Q308_Supplementdover Q308_Supplement
dover Q308_Supplement
 
vppg industries 2Q2008EARNINGSTABLESPDF
vppg industries 2Q2008EARNINGSTABLESPDFvppg industries 2Q2008EARNINGSTABLESPDF
vppg industries 2Q2008EARNINGSTABLESPDF
 

Similar to alltel 1q 07_highlights

Big_Lots_AR2003FSO
Big_Lots_AR2003FSOBig_Lots_AR2003FSO
Big_Lots_AR2003FSOfinance50
 
Big_Lots_AR2002FSO
Big_Lots_AR2002FSOBig_Lots_AR2002FSO
Big_Lots_AR2002FSOfinance50
 
alltel 3Q05_Highlights
alltel  3Q05_Highlightsalltel  3Q05_Highlights
alltel 3Q05_Highlightsfinance27
 
tribune earnings_q3_06_tables
tribune  earnings_q3_06_tablestribune  earnings_q3_06_tables
tribune earnings_q3_06_tablesfinance47
 
alltel 4Q 04_Highlights
alltel  4Q 04_Highlightsalltel  4Q 04_Highlights
alltel 4Q 04_Highlightsfinance27
 
alltel 4Q 04_Highlights
alltel  4Q 04_Highlightsalltel  4Q 04_Highlights
alltel 4Q 04_Highlightsfinance27
 
alltel 4Q 04_Highlights
alltel  4Q 04_Highlightsalltel  4Q 04_Highlights
alltel 4Q 04_Highlightsfinance27
 
alltel 4Q04_Highlights
alltel  4Q04_Highlightsalltel  4Q04_Highlights
alltel 4Q04_Highlightsfinance27
 
alltel 4Q04_Highlights
alltel  4Q04_Highlightsalltel  4Q04_Highlights
alltel 4Q04_Highlightsfinance27
 
alltel 4Q04_Highlights
alltel  4Q04_Highlightsalltel  4Q04_Highlights
alltel 4Q04_Highlightsfinance27
 
alltel 4Q 04_Highlights
alltel  4Q 04_Highlightsalltel  4Q 04_Highlights
alltel 4Q 04_Highlightsfinance27
 
Maxim 2Q FISCAL 2009 RESULTS
Maxim 2Q FISCAL 2009 RESULTSMaxim 2Q FISCAL 2009 RESULTS
Maxim 2Q FISCAL 2009 RESULTSearningsreport
 
tribune earnings_q2_07_tables
tribune  earnings_q2_07_tablestribune  earnings_q2_07_tables
tribune earnings_q2_07_tablesfinance47
 
alltel 1Q06_Highlights
alltel  1Q06_Highlightsalltel  1Q06_Highlights
alltel 1Q06_Highlightsfinance27
 
Q2 2004 Earnings Release Financial Tables
	Q2 2004 Earnings Release Financial Tables	Q2 2004 Earnings Release Financial Tables
Q2 2004 Earnings Release Financial Tablesfinance7
 
alltel 4Q 04_Highlights
alltel  4Q 04_Highlightsalltel  4Q 04_Highlights
alltel 4Q 04_Highlightsfinance27
 
alltel 4Q04_Highlights
alltel  4Q04_Highlightsalltel  4Q04_Highlights
alltel 4Q04_Highlightsfinance27
 
alltel 4Q 04_Highlights
alltel  4Q 04_Highlightsalltel  4Q 04_Highlights
alltel 4Q 04_Highlightsfinance27
 
alltel 4Q 04_Highlights
alltel  4Q 04_Highlightsalltel  4Q 04_Highlights
alltel 4Q 04_Highlightsfinance27
 
alltel 4Q04_Highlights
alltel  4Q04_Highlightsalltel  4Q04_Highlights
alltel 4Q04_Highlightsfinance27
 

Similar to alltel 1q 07_highlights (20)

Big_Lots_AR2003FSO
Big_Lots_AR2003FSOBig_Lots_AR2003FSO
Big_Lots_AR2003FSO
 
Big_Lots_AR2002FSO
Big_Lots_AR2002FSOBig_Lots_AR2002FSO
Big_Lots_AR2002FSO
 
alltel 3Q05_Highlights
alltel  3Q05_Highlightsalltel  3Q05_Highlights
alltel 3Q05_Highlights
 
tribune earnings_q3_06_tables
tribune  earnings_q3_06_tablestribune  earnings_q3_06_tables
tribune earnings_q3_06_tables
 
alltel 4Q 04_Highlights
alltel  4Q 04_Highlightsalltel  4Q 04_Highlights
alltel 4Q 04_Highlights
 
alltel 4Q 04_Highlights
alltel  4Q 04_Highlightsalltel  4Q 04_Highlights
alltel 4Q 04_Highlights
 
alltel 4Q 04_Highlights
alltel  4Q 04_Highlightsalltel  4Q 04_Highlights
alltel 4Q 04_Highlights
 
alltel 4Q04_Highlights
alltel  4Q04_Highlightsalltel  4Q04_Highlights
alltel 4Q04_Highlights
 
alltel 4Q04_Highlights
alltel  4Q04_Highlightsalltel  4Q04_Highlights
alltel 4Q04_Highlights
 
alltel 4Q04_Highlights
alltel  4Q04_Highlightsalltel  4Q04_Highlights
alltel 4Q04_Highlights
 
alltel 4Q 04_Highlights
alltel  4Q 04_Highlightsalltel  4Q 04_Highlights
alltel 4Q 04_Highlights
 
Maxim 2Q FISCAL 2009 RESULTS
Maxim 2Q FISCAL 2009 RESULTSMaxim 2Q FISCAL 2009 RESULTS
Maxim 2Q FISCAL 2009 RESULTS
 
tribune earnings_q2_07_tables
tribune  earnings_q2_07_tablestribune  earnings_q2_07_tables
tribune earnings_q2_07_tables
 
alltel 1Q06_Highlights
alltel  1Q06_Highlightsalltel  1Q06_Highlights
alltel 1Q06_Highlights
 
Q2 2004 Earnings Release Financial Tables
	Q2 2004 Earnings Release Financial Tables	Q2 2004 Earnings Release Financial Tables
Q2 2004 Earnings Release Financial Tables
 
alltel 4Q 04_Highlights
alltel  4Q 04_Highlightsalltel  4Q 04_Highlights
alltel 4Q 04_Highlights
 
alltel 4Q04_Highlights
alltel  4Q04_Highlightsalltel  4Q04_Highlights
alltel 4Q04_Highlights
 
alltel 4Q 04_Highlights
alltel  4Q 04_Highlightsalltel  4Q 04_Highlights
alltel 4Q 04_Highlights
 
alltel 4Q 04_Highlights
alltel  4Q 04_Highlightsalltel  4Q 04_Highlights
alltel 4Q 04_Highlights
 
alltel 4Q04_Highlights
alltel  4Q04_Highlightsalltel  4Q04_Highlights
alltel 4Q04_Highlights
 

More from finance27

commercial metals Overview_03/08
commercial metals Overview_03/08commercial metals Overview_03/08
commercial metals Overview_03/08finance27
 
commercial metals 2Q 08_Presentation
commercial metals 2Q 08_Presentationcommercial metals 2Q 08_Presentation
commercial metals 2Q 08_Presentationfinance27
 
commercial metals BofA_05/08
commercial metals BofA_05/08commercial metals BofA_05/08
commercial metals BofA_05/08finance27
 
commercial metals Overview_06/08_2
commercial metals Overview_06/08_2commercial metals Overview_06/08_2
commercial metals Overview_06/08_2finance27
 
commercial metals Q3 08_Presentation
commercial metals Q3 08_Presentationcommercial metals Q3 08_Presentation
commercial metals Q3 08_Presentationfinance27
 
commercial metals Q3 08_Presentation
commercial metals Q3 08_Presentationcommercial metals Q3 08_Presentation
commercial metals Q3 08_Presentationfinance27
 
commercial metals Hodges_09/08
commercial metals Hodges_09/08commercial metals Hodges_09/08
commercial metals Hodges_09/08finance27
 
commercial metals 4thQ 2008
commercial metals 4thQ 2008commercial metals 4thQ 2008
commercial metals 4thQ 2008finance27
 
commercial metals 4thQ 2008
commercial metals  4thQ 2008commercial metals  4thQ 2008
commercial metals 4thQ 2008finance27
 
commercial metals GoldmanSachs_12/04/08
commercial metals GoldmanSachs_12/04/08commercial metals GoldmanSachs_12/04/08
commercial metals GoldmanSachs_12/04/08finance27
 
commercial metals 12/02/05TwinsBroch
commercial metals 12/02/05TwinsBrochcommercial metals 12/02/05TwinsBroch
commercial metals 12/02/05TwinsBrochfinance27
 
commercial metals 12/02/05TwinsBroch
commercial metals 12/02/05TwinsBrochcommercial metals 12/02/05TwinsBroch
commercial metals 12/02/05TwinsBrochfinance27
 
commercial metals 12/02/05TwinsBroch
commercial metals 12/02/05TwinsBrochcommercial metals 12/02/05TwinsBroch
commercial metals 12/02/05TwinsBrochfinance27
 
commercial metals 2005AR
commercial metals 2005ARcommercial metals 2005AR
commercial metals 2005ARfinance27
 
commercial metals 2005AR
commercial metals 2005ARcommercial metals 2005AR
commercial metals 2005ARfinance27
 
commercial metals 2005AR
commercial metals 2005ARcommercial metals 2005AR
commercial metals 2005ARfinance27
 
commercial metals AR_2006
commercial metals AR_2006commercial metals AR_2006
commercial metals AR_2006finance27
 
commercial metals AR_2006
commercial metals AR_2006commercial metals AR_2006
commercial metals AR_2006finance27
 
commercial metals AR_2006
commercial metals AR_2006commercial metals AR_2006
commercial metals AR_2006finance27
 
commercial metals 2007_AR
commercial metals 2007_ARcommercial metals 2007_AR
commercial metals 2007_ARfinance27
 

More from finance27 (20)

commercial metals Overview_03/08
commercial metals Overview_03/08commercial metals Overview_03/08
commercial metals Overview_03/08
 
commercial metals 2Q 08_Presentation
commercial metals 2Q 08_Presentationcommercial metals 2Q 08_Presentation
commercial metals 2Q 08_Presentation
 
commercial metals BofA_05/08
commercial metals BofA_05/08commercial metals BofA_05/08
commercial metals BofA_05/08
 
commercial metals Overview_06/08_2
commercial metals Overview_06/08_2commercial metals Overview_06/08_2
commercial metals Overview_06/08_2
 
commercial metals Q3 08_Presentation
commercial metals Q3 08_Presentationcommercial metals Q3 08_Presentation
commercial metals Q3 08_Presentation
 
commercial metals Q3 08_Presentation
commercial metals Q3 08_Presentationcommercial metals Q3 08_Presentation
commercial metals Q3 08_Presentation
 
commercial metals Hodges_09/08
commercial metals Hodges_09/08commercial metals Hodges_09/08
commercial metals Hodges_09/08
 
commercial metals 4thQ 2008
commercial metals 4thQ 2008commercial metals 4thQ 2008
commercial metals 4thQ 2008
 
commercial metals 4thQ 2008
commercial metals  4thQ 2008commercial metals  4thQ 2008
commercial metals 4thQ 2008
 
commercial metals GoldmanSachs_12/04/08
commercial metals GoldmanSachs_12/04/08commercial metals GoldmanSachs_12/04/08
commercial metals GoldmanSachs_12/04/08
 
commercial metals 12/02/05TwinsBroch
commercial metals 12/02/05TwinsBrochcommercial metals 12/02/05TwinsBroch
commercial metals 12/02/05TwinsBroch
 
commercial metals 12/02/05TwinsBroch
commercial metals 12/02/05TwinsBrochcommercial metals 12/02/05TwinsBroch
commercial metals 12/02/05TwinsBroch
 
commercial metals 12/02/05TwinsBroch
commercial metals 12/02/05TwinsBrochcommercial metals 12/02/05TwinsBroch
commercial metals 12/02/05TwinsBroch
 
commercial metals 2005AR
commercial metals 2005ARcommercial metals 2005AR
commercial metals 2005AR
 
commercial metals 2005AR
commercial metals 2005ARcommercial metals 2005AR
commercial metals 2005AR
 
commercial metals 2005AR
commercial metals 2005ARcommercial metals 2005AR
commercial metals 2005AR
 
commercial metals AR_2006
commercial metals AR_2006commercial metals AR_2006
commercial metals AR_2006
 
commercial metals AR_2006
commercial metals AR_2006commercial metals AR_2006
commercial metals AR_2006
 
commercial metals AR_2006
commercial metals AR_2006commercial metals AR_2006
commercial metals AR_2006
 
commercial metals 2007_AR
commercial metals 2007_ARcommercial metals 2007_AR
commercial metals 2007_AR
 

Recently uploaded

House of Commons ; CDC schemes overview document
House of Commons ; CDC schemes overview documentHouse of Commons ; CDC schemes overview document
House of Commons ; CDC schemes overview documentHenry Tapper
 
VIP Call Girls LB Nagar ( Hyderabad ) Phone 8250192130 | ₹5k To 25k With Room...
VIP Call Girls LB Nagar ( Hyderabad ) Phone 8250192130 | ₹5k To 25k With Room...VIP Call Girls LB Nagar ( Hyderabad ) Phone 8250192130 | ₹5k To 25k With Room...
VIP Call Girls LB Nagar ( Hyderabad ) Phone 8250192130 | ₹5k To 25k With Room...Suhani Kapoor
 
Quantitative Analysis of Retail Sector Companies
Quantitative Analysis of Retail Sector CompaniesQuantitative Analysis of Retail Sector Companies
Quantitative Analysis of Retail Sector Companiesprashantbhati354
 
Monthly Market Risk Update: April 2024 [SlideShare]
Monthly Market Risk Update: April 2024 [SlideShare]Monthly Market Risk Update: April 2024 [SlideShare]
Monthly Market Risk Update: April 2024 [SlideShare]Commonwealth
 
Q3 2024 Earnings Conference Call and Webcast Slides
Q3 2024 Earnings Conference Call and Webcast SlidesQ3 2024 Earnings Conference Call and Webcast Slides
Q3 2024 Earnings Conference Call and Webcast SlidesMarketing847413
 
OAT_RI_Ep19 WeighingTheRisks_Apr24_TheYellowMetal.pptx
OAT_RI_Ep19 WeighingTheRisks_Apr24_TheYellowMetal.pptxOAT_RI_Ep19 WeighingTheRisks_Apr24_TheYellowMetal.pptx
OAT_RI_Ep19 WeighingTheRisks_Apr24_TheYellowMetal.pptxhiddenlevers
 
Russian Call Girls In Gtb Nagar (Delhi) 9711199012 💋✔💕😘 Naughty Call Girls Se...
Russian Call Girls In Gtb Nagar (Delhi) 9711199012 💋✔💕😘 Naughty Call Girls Se...Russian Call Girls In Gtb Nagar (Delhi) 9711199012 💋✔💕😘 Naughty Call Girls Se...
Russian Call Girls In Gtb Nagar (Delhi) 9711199012 💋✔💕😘 Naughty Call Girls Se...shivangimorya083
 
government_intervention_in_business_ownership[1].pdf
government_intervention_in_business_ownership[1].pdfgovernment_intervention_in_business_ownership[1].pdf
government_intervention_in_business_ownership[1].pdfshaunmashale756
 
Authentic No 1 Amil Baba In Pakistan Authentic No 1 Amil Baba In Karachi No 1...
Authentic No 1 Amil Baba In Pakistan Authentic No 1 Amil Baba In Karachi No 1...Authentic No 1 Amil Baba In Pakistan Authentic No 1 Amil Baba In Karachi No 1...
Authentic No 1 Amil Baba In Pakistan Authentic No 1 Amil Baba In Karachi No 1...First NO1 World Amil baba in Faisalabad
 
VIP Kolkata Call Girl Serampore 👉 8250192130 Available With Room
VIP Kolkata Call Girl Serampore 👉 8250192130  Available With RoomVIP Kolkata Call Girl Serampore 👉 8250192130  Available With Room
VIP Kolkata Call Girl Serampore 👉 8250192130 Available With Roomdivyansh0kumar0
 
Call Girls Service Nagpur Maya Call 7001035870 Meet With Nagpur Escorts
Call Girls Service Nagpur Maya Call 7001035870 Meet With Nagpur EscortsCall Girls Service Nagpur Maya Call 7001035870 Meet With Nagpur Escorts
Call Girls Service Nagpur Maya Call 7001035870 Meet With Nagpur Escortsranjana rawat
 
Independent Lucknow Call Girls 8923113531WhatsApp Lucknow Call Girls make you...
Independent Lucknow Call Girls 8923113531WhatsApp Lucknow Call Girls make you...Independent Lucknow Call Girls 8923113531WhatsApp Lucknow Call Girls make you...
Independent Lucknow Call Girls 8923113531WhatsApp Lucknow Call Girls make you...makika9823
 
fca-bsps-decision-letter-redacted (1).pdf
fca-bsps-decision-letter-redacted (1).pdffca-bsps-decision-letter-redacted (1).pdf
fca-bsps-decision-letter-redacted (1).pdfHenry Tapper
 
Attachment Of Assets......................
Attachment Of Assets......................Attachment Of Assets......................
Attachment Of Assets......................AmanBajaj36
 
Chapter 2.ppt of macroeconomics by mankiw 9th edition
Chapter 2.ppt of macroeconomics by mankiw 9th editionChapter 2.ppt of macroeconomics by mankiw 9th edition
Chapter 2.ppt of macroeconomics by mankiw 9th editionMuhammadHusnain82237
 
VIP High Class Call Girls Saharanpur Anushka 8250192130 Independent Escort Se...
VIP High Class Call Girls Saharanpur Anushka 8250192130 Independent Escort Se...VIP High Class Call Girls Saharanpur Anushka 8250192130 Independent Escort Se...
VIP High Class Call Girls Saharanpur Anushka 8250192130 Independent Escort Se...Suhani Kapoor
 
Call Girls In Yusuf Sarai Women Seeking Men 9654467111
Call Girls In Yusuf Sarai Women Seeking Men 9654467111Call Girls In Yusuf Sarai Women Seeking Men 9654467111
Call Girls In Yusuf Sarai Women Seeking Men 9654467111Sapana Sha
 
VIP Call Girls Service Begumpet Hyderabad Call +91-8250192130
VIP Call Girls Service Begumpet Hyderabad Call +91-8250192130VIP Call Girls Service Begumpet Hyderabad Call +91-8250192130
VIP Call Girls Service Begumpet Hyderabad Call +91-8250192130Suhani Kapoor
 
Log your LOA pain with Pension Lab's brilliant campaign
Log your LOA pain with Pension Lab's brilliant campaignLog your LOA pain with Pension Lab's brilliant campaign
Log your LOA pain with Pension Lab's brilliant campaignHenry Tapper
 

Recently uploaded (20)

House of Commons ; CDC schemes overview document
House of Commons ; CDC schemes overview documentHouse of Commons ; CDC schemes overview document
House of Commons ; CDC schemes overview document
 
VIP Call Girls LB Nagar ( Hyderabad ) Phone 8250192130 | ₹5k To 25k With Room...
VIP Call Girls LB Nagar ( Hyderabad ) Phone 8250192130 | ₹5k To 25k With Room...VIP Call Girls LB Nagar ( Hyderabad ) Phone 8250192130 | ₹5k To 25k With Room...
VIP Call Girls LB Nagar ( Hyderabad ) Phone 8250192130 | ₹5k To 25k With Room...
 
Quantitative Analysis of Retail Sector Companies
Quantitative Analysis of Retail Sector CompaniesQuantitative Analysis of Retail Sector Companies
Quantitative Analysis of Retail Sector Companies
 
Monthly Market Risk Update: April 2024 [SlideShare]
Monthly Market Risk Update: April 2024 [SlideShare]Monthly Market Risk Update: April 2024 [SlideShare]
Monthly Market Risk Update: April 2024 [SlideShare]
 
Q3 2024 Earnings Conference Call and Webcast Slides
Q3 2024 Earnings Conference Call and Webcast SlidesQ3 2024 Earnings Conference Call and Webcast Slides
Q3 2024 Earnings Conference Call and Webcast Slides
 
OAT_RI_Ep19 WeighingTheRisks_Apr24_TheYellowMetal.pptx
OAT_RI_Ep19 WeighingTheRisks_Apr24_TheYellowMetal.pptxOAT_RI_Ep19 WeighingTheRisks_Apr24_TheYellowMetal.pptx
OAT_RI_Ep19 WeighingTheRisks_Apr24_TheYellowMetal.pptx
 
Russian Call Girls In Gtb Nagar (Delhi) 9711199012 💋✔💕😘 Naughty Call Girls Se...
Russian Call Girls In Gtb Nagar (Delhi) 9711199012 💋✔💕😘 Naughty Call Girls Se...Russian Call Girls In Gtb Nagar (Delhi) 9711199012 💋✔💕😘 Naughty Call Girls Se...
Russian Call Girls In Gtb Nagar (Delhi) 9711199012 💋✔💕😘 Naughty Call Girls Se...
 
government_intervention_in_business_ownership[1].pdf
government_intervention_in_business_ownership[1].pdfgovernment_intervention_in_business_ownership[1].pdf
government_intervention_in_business_ownership[1].pdf
 
Authentic No 1 Amil Baba In Pakistan Authentic No 1 Amil Baba In Karachi No 1...
Authentic No 1 Amil Baba In Pakistan Authentic No 1 Amil Baba In Karachi No 1...Authentic No 1 Amil Baba In Pakistan Authentic No 1 Amil Baba In Karachi No 1...
Authentic No 1 Amil Baba In Pakistan Authentic No 1 Amil Baba In Karachi No 1...
 
VIP Kolkata Call Girl Serampore 👉 8250192130 Available With Room
VIP Kolkata Call Girl Serampore 👉 8250192130  Available With RoomVIP Kolkata Call Girl Serampore 👉 8250192130  Available With Room
VIP Kolkata Call Girl Serampore 👉 8250192130 Available With Room
 
Call Girls Service Nagpur Maya Call 7001035870 Meet With Nagpur Escorts
Call Girls Service Nagpur Maya Call 7001035870 Meet With Nagpur EscortsCall Girls Service Nagpur Maya Call 7001035870 Meet With Nagpur Escorts
Call Girls Service Nagpur Maya Call 7001035870 Meet With Nagpur Escorts
 
Independent Lucknow Call Girls 8923113531WhatsApp Lucknow Call Girls make you...
Independent Lucknow Call Girls 8923113531WhatsApp Lucknow Call Girls make you...Independent Lucknow Call Girls 8923113531WhatsApp Lucknow Call Girls make you...
Independent Lucknow Call Girls 8923113531WhatsApp Lucknow Call Girls make you...
 
fca-bsps-decision-letter-redacted (1).pdf
fca-bsps-decision-letter-redacted (1).pdffca-bsps-decision-letter-redacted (1).pdf
fca-bsps-decision-letter-redacted (1).pdf
 
Attachment Of Assets......................
Attachment Of Assets......................Attachment Of Assets......................
Attachment Of Assets......................
 
Chapter 2.ppt of macroeconomics by mankiw 9th edition
Chapter 2.ppt of macroeconomics by mankiw 9th editionChapter 2.ppt of macroeconomics by mankiw 9th edition
Chapter 2.ppt of macroeconomics by mankiw 9th edition
 
Monthly Economic Monitoring of Ukraine No 231, April 2024
Monthly Economic Monitoring of Ukraine No 231, April 2024Monthly Economic Monitoring of Ukraine No 231, April 2024
Monthly Economic Monitoring of Ukraine No 231, April 2024
 
VIP High Class Call Girls Saharanpur Anushka 8250192130 Independent Escort Se...
VIP High Class Call Girls Saharanpur Anushka 8250192130 Independent Escort Se...VIP High Class Call Girls Saharanpur Anushka 8250192130 Independent Escort Se...
VIP High Class Call Girls Saharanpur Anushka 8250192130 Independent Escort Se...
 
Call Girls In Yusuf Sarai Women Seeking Men 9654467111
Call Girls In Yusuf Sarai Women Seeking Men 9654467111Call Girls In Yusuf Sarai Women Seeking Men 9654467111
Call Girls In Yusuf Sarai Women Seeking Men 9654467111
 
VIP Call Girls Service Begumpet Hyderabad Call +91-8250192130
VIP Call Girls Service Begumpet Hyderabad Call +91-8250192130VIP Call Girls Service Begumpet Hyderabad Call +91-8250192130
VIP Call Girls Service Begumpet Hyderabad Call +91-8250192130
 
Log your LOA pain with Pension Lab's brilliant campaign
Log your LOA pain with Pension Lab's brilliant campaignLog your LOA pain with Pension Lab's brilliant campaign
Log your LOA pain with Pension Lab's brilliant campaign
 

alltel 1q 07_highlights

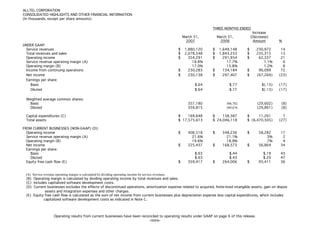
  • 1. ALLTEL CORPORATION CONSOLIDATED HIGHLIGHTS AND OTHER FINANCIAL INFORMATION (In thousands, except per share amounts) THREE MONTHS ENDED Increase March 31, March 31, (Decrease) 2007 2006 Amount % UNDER GAAP: Service revenues $ 1,880,120 $ 1,649,148 $ 230,972 14 Total revenues and sales Wireless $ 2,078,548 $ 1,843,233 $ 235,315 13 Operating income Wireless $ 354,291 $ 291,954 $ 62,337 21 Service revenue operating margin (A) 18.8% 17.7% 1.1% 6 Operating margin (B) Wireless 17.0% 15.8% 1.2% 8 Income from continuing operations $ 230,283 $ 134,184 $ 96,099 72 Net income $ 230,138 $ 297,407 $ (67,269) (23) Earnings per share: Basic $.64 $.77 $(.13) (17) Diluted $.64 $.77 $(.13) (17) Weighted average common shares: Basic 357,180 (29,602) (8) 386,782 Diluted 359,815 (29,861) (8) 389,676 Capital expenditures (C) $ 169,648 $ 158,387 $ 11,261 7 Total assets $ 17,575,613 $ 24,046,118 $ (6,470,505) (27) FROM CURRENT BUSINESSES (NON-GAAP) (D): Operating income $ 406,518 $ 348,236 $ 58,282 17 Service revenue operating margin (A) 21.6% 21.1% .5% 2 Operating margin (B) 19.6% 18.9% .7% 4 Net income $ 225,437 $ 168,573 $ 56,864 34 Earnings per share: Basic $.63 $.44 $.19 43 Diluted $.63 $.43 $.20 47 Equity free cash flow (E) $ 359,417 $ 264,006 $ 95,411 36 (A) Service revenue operating margin is calculated by dividing operating income by service revenues. (B) Operating margin is calculated by dividing operating income by total revenues and sales. (C) Includes capitalized software development costs. (D) Current businesses excludes the effects of discontinued operations, amortization expense related to acquired, finite-lived intangible assets, gain on disposal of assets and integration expenses and other charges. (E) Equity free cash flow is calculated as the sum of net income from current businesses plus depreciation expense less capital expenditures, which includes capitalized software development costs as indicated in Note C. Operating results from current businesses have been reconciled to operating results under GAAP on page 6 of this release. -more-
  • 2. ALLTEL CORPORATION CONSOLIDATED STATEMENTS OF INCOME UNDER GAAP-Page 2 (In thousands, except per share amounts) THREE MONTHS ENDED March 31, March 31, 2007 2006 Revenues and sales: Service revenues $ 1,880,120 $ 1,649,148 Product sales 198,428 194,085 Total revenues and sales 2,078,548 1,843,233 Costs and expenses: Cost of services 610,995 542,784 Cost of products sold 287,509 272,697 Selling, general, administrative and other 469,898 425,696 Depreciation and amortization 349,505 299,312 Integration expenses and other charges 6,350 10,790 Total costs and expenses 1,724,257 1,551,279 Operating income 354,291 291,954 Equity earnings in unconsolidated partnerships 14,979 12,932 Minority interest in consolidated partnerships (9,694) (13,895) Other income, net 7,672 10,791 Interest expense (46,695) (84,716) Gain on disposal of assets 56,548 - Income from continuing operations before income taxes 377,101 217,066 Income taxes 146,818 82,882 Income from continuing operations 230,283 134,184 Income (loss) from discontinued operations (145) 163,223 Net income 230,138 297,407 Preferred dividends 20 21 Net income applicable to common shares $ 230,118 $ 297,386 Basic earnings per share: Income from continuing operations $.64 $.35 Income (loss) from discontinued operations - .42 Net income $.64 $.77 Diluted earnings per share: Income from continuing operations $.64 $.35 Income (loss) from discontinued operations - .42 Net income $.64 $.77 -more-
  • 3. ALLTEL CORPORATION CONSOLIDATED BALANCE SHEETS UNDER GAAP-Page 3 (In thousands) ASSETS LIABILITIES AND SHAREHOLDERS' EQUITY March 31, December 31, March 31, December 31, 2007 2006 2007 2006 CURRENT ASSETS: CURRENT LIABILITIES: Cash and short-term investments $ 576,829 $ 934,228 Current maturities of long-term debt $ 75,263 $ 36,285 Accounts receivable (less allowance for Accounts payable 487,872 576,126 doubtful accounts of $43,101 and Advance payments and customer deposits 204,908 186,193 $54,865, respectively) 765,223 807,307 Accrued taxes 204,246 114,109 Inventories 214,362 218,629 Accrued dividends 44,644 46,039 Prepaid expenses and other 82,373 67,665 Accrued interest 49,057 79,281 Assets related to discontinued operations 3,976 4,321 Other current liabilities 153,226 156,471 Liabilities related to discontinued operations 374 2,761 Total current assets 1,642,763 2,032,150 Total current liabilities 1,219,590 1,197,265 Investments 184,540 368,871 Goodwill 8,418,777 8,447,013 Other intangibles 2,083,806 2,129,346 Long-term debt 2,661,310 2,697,412 Deferred income taxes 1,059,562 1,109,479 PROPERTY, PLANT AND EQUIPMENT: Other liabilities 698,733 677,609 Land 322,142 314,902 Buildings and improvements 973,330 955,061 Total liabilities 5,639,195 5,681,765 Operating plant and equipment 8,144,201 7,933,840 Information processing 1,081,295 1,048,136 Furniture and fixtures 177,268 173,835 SHAREHOLDERS' EQUITY: Under construction 360,060 495,968 Preferred stock 253 258 Common stock 350,411 364,572 Total property, plant and equipment 11,058,296 10,921,742 Additional paid-in capital 3,433,180 4,296,786 Less accumulated depreciation 5,971,119 5,690,360 Accumulated other comprehensive income (loss) (27,042) 9,525 Retained earnings 8,179,616 7,990,808 Net property, plant and equipment 5,087,177 5,231,382 Total shareholders' equity 11,936,418 12,661,949 Other assets 114,011 89,455 Assets related to discontinued operations 44,539 45,497 TOTAL LIABILITIES AND TOTAL ASSETS $ 17,575,613 $ 18,343,714 SHAREHOLDERS' EQUITY $ 17,575,613 $ 18,343,714 -more-
  • 4. ALLTEL CORPORATION CONSOLIDATED STATEMENTS OF CASH FLOWS UNDER GAAP-Page 4 (In thousands) THREE MONTHS ENDED March 31, March 31, 2007 2006 Net Cash Provided from Operations: Net income $ 230,138 $ 297,407 Adjustments to reconcile net income to net cash provided from operations: Loss (income) from discontinued operations 145 (163,223) Depreciation and amortization expense 349,505 299,312 Provision for doubtful accounts 37,261 48,700 Non-cash portion of gain on disposal of assets (56,548) - Change in deferred income taxes 12,155 40,487 Other, net (6,722) (70) Changes in operating assets and liabilities, net of the effects of acquisitions and dispositions: Accounts receivable 3,559 (8,693) Inventories 4,267 36,664 Accounts payable (89,778) (100,635) Other current liabilities 99,001 (46,801) Other, net (21,822) (18,311) Net cash provided from operations 561,161 384,837 Cash Flows from Investing Activities: Additions to property, plant and equipment (161,855) (150,673) Additions to capitalized software development costs (7,793) (7,714) Purchases of property, net of cash acquired (2,500) (458,931) Proceeds from the sale of investments 188,711 - Proceeds from the return on investments 10,931 8,914 Other, net (356) 7,319 Net cash provided from (used in) investing activities 27,138 (601,085) Cash Flows from Financing Activities: Dividends on common and preferred stock (45,961) (147,737) Repayments of long-term debt (664) (689) Distributions to minority investors (7,772) (11,810) Repurchases of common stock (938,784) - Excess tax benefits from stock option exercises 3,830 3,381 Cash payments to effect conversion of convertible notes - (59,848) Common stock issued 42,448 54,896 Net cash used in financing activities (946,903) (161,807) Cash Flows from Discontinued Operations: Cash provided from operating activities 1,929 434,471 Cash used in investing activities (724) (65,813) Cash used in financing activities - (91,757) Net cash provided from discontinued operations 1,205 276,901 Effect of exchange rate changes on cash and short-term investments - 585 Decrease in cash and short-term investments (357,399) (100,569) Cash and Short-term Investments: Beginning of the period 934,228 982,407 End of the period $ 576,829 $ 881,838 -more-
  • 5. ALLTEL CORPORATION SUPPLEMENTAL OPERATING INFORMATION-Page 5 (Dollars in thousands, except per customer amounts) THREE MONTHS ENDED Increase March 31, March 31, (Decrease) 2007 2006 Amount % Controlled POPs 79,575,793 77,292,038 2,283,755 3 Customers 12,060,572 10,827,065 1,233,507 11 Penetration rate 15.2% 14.0% 1.2% 9 Average customers 11,940,660 10,731,389 1,209,271 11 Gross customer additions: Internal 867,473 805,454 62,019 8 Acquired - - - - Total 867,473 805,454 62,019 8 Net customer additions: Internal 236,634 164,741 71,893 44 Acquired - - - - Total 236,634 164,741 71,893 44 Cash costs: Cost of services $ 610,995 $ 542,784 $ 68,211 13 Cost of products sold 287,509 272,697 14,812 5 Selling, general, administrative and other 469,898 425,696 44,202 10 Less product sales 198,428 194,085 4,343 2 Total $1,169,974 $1,047,092 $ 122,882 12 Cash costs per unit per month (A) $32.66 $32.52 $.14 - Revenues: Service revenues $1,880,120 $1,649,148 $ 230,972 14 Less wholesale roaming revenues 154,187 151,003 3,184 2 Less wholesale transport revenues 46,434 10,350 36,084 349 Retail revenues $1,679,499 $1,487,795 $ 191,704 13 Average revenue per customer per month (B) $52.49 $51.23 $1.26 2 Retail revenue per customer per month (C) $46.88 $46.21 $.67 1 Retail minutes of use per customer per month (D) 651 610 41 7 Postpay churn 1.33% 1.66% (.33%) (20) Total churn 1.77% 2.00% (.23%) (12) (A) Cash costs per unit per month is calculated by dividing the sum of the reported cost of services, cost of products sold, selling, general, administrative and other expenses less product sales, as reported in the Consolidated Statements of Income, by the number of average customers for the period. (B) Average revenue per customer per month is calculated by dividing service revenues by average customers for the period. (C) Retail revenue per customer per month is calculated by dividing retail revenues (service revenues less wholesale revenues) by average customers for the period. (D) Retail minutes of use per customer per month represents the average monthly minutes that Alltel's customers use on both the Company's network and while roaming on other carriers' networks. -more-
  • 6. ALLTEL CORPORATION RECONCILIATIONS OF RESULTS OF OPERATIONS UNDER GAAP TO RESULTS OF OPERATIONS FROM CURRENT BUSINESSES (NON-GAAP)-Page 6 (In thousands) THREE MONTHS ENDED MARCH 31, 2007 Income Income Depreciation Before From Basic Diluted and Operating Income Income Continuing Net Earnings Earnings Amortization Income Taxes Taxes Operations Income Per Share Per Share $.64 $.64 Under GAAP $ 349,505 $ 354,291 $ 377,101 $ 146,818 $ 230,283 $ 230,138 Items excluded from measuring results from current businesses: Amortization expense related to acquired, .08 .08 finite-lived intangible assets (A) (45,877) 45,877 45,877 17,846 28,031 28,031 .01 .01 Integration expenses and other charges (B) - 6,350 6,350 2,471 3,879 3,879 Gain on disposal of assets (.10) (.10) (C) - - (56,548) (19,792) (36,756) (36,756) - - Loss from discontinued operations (E) - - - - - 145 (.01) (.01) Net increase (decrease) (45,877) 52,227 (4,321) 525 (4,846) (4,701) $.63 $.63 From current businesses $ 303,628 $ 406,518 $ 372,780 $ 147,343 $ 225,437 $ 225,437 THREE MONTHS ENDED MARCH 31, 2006 Income Income Depreciation Before From Basic Diluted and Operating Income Income Continuing Net Earnings Earnings Amortization Income Taxes Taxes Operations Income Per Share Per Share $.77 $.77 Under GAAP $ 299,312 $ 291,954 $ 217,066 $ 82,882 $ 134,184 $ 297,407 Items excluded from measuring results from current businesses: Amortization expense related to acquired, .07 .07 finite-lived intangible assets (A) (45,492) 45,492 45,492 17,696 27,796 27,796 .02 .01 Integration expenses and other charges (D) - 10,790 10,790 4,197 6,593 6,593 (.42) (.42) Income from discontinued operations (E) - - - - - (163,223) (.33) (.34) Net increase (decrease) (45,492) 56,282 56,282 21,893 34,389 (128,834) $.44 $.43 From current businesses $ 253,820 $ 348,236 $ 273,348 $ 104,775 $ 168,573 $ 168,573 -more-
  • 7. ALLTEL CORPORATION RECONCILIATIONS OF RESULTS OF OPERATIONS UNDER GAAP TO RESULTS OF OPERATIONS FROM CURRENT BUSINESSES (NON-GAAP)-Page 7 (In thousands) THREE MONTHS ENDED March 31, March 31, 2007 2006 Net cash provided from operations $ 561,161 $ 384,837 Adjustments to reconcile to net income under GAAP: Income (loss) from discontinued operations (145) 163,223 Depreciation and amortization expense (349,505) (299,312) Provision for doubtful accounts (37,261) (48,700) Non-cash portion of gain on disposal of assets 56,548 - Change in deferred income taxes (12,155) (40,487) Other non-cash changes, net 6,722 70 Changes in operating assets and liabilities, net of the effects of acquisitions and dispositions 4,773 137,776 Net income under GAAP 230,138 297,407 Adjustments to reconcile to net income from current businesses, net of tax (see specific items listed on page 6) (4,701) (128,834) Net income from current businesses 225,437 168,573 Adjustments to reconcile to equity free cash flow from current businesses: Depreciation expense from current businesses 303,628 253,820 Capital expenditures (169,648) (158,387) Equity free cash flow from current businesses $ 359,417 $ 264,006 -more-
  • 8. ALLTEL CORPORATION NOTES TO RECONCILIATIONS OF RESULTS OF OPERATIONS UNDER GAAP TO RESULTS OF OPERATIONS FROM CURRENT BUSINESSES (NON-GAAP)-Page 8 As disclosed in the ALLTEL Corporation (quot;Alltelquot; or the quot;Companyquot;) Form 8-K filed on April 27, 2007, Alltel has presented in this earnings release results of operations from current businesses which exclude the effects of discontinued operations, amortization expense related to acquired, finite-lived intangible assets, gain on disposal of assets and integration expenses and other charges. Alltel's purpose for excluding items from the current business measures is to focus on Alltel’s true earnings capacity associated with providing wireless communications services. Management believes the items excluded from the current business measures are related to strategic activities or other events, specific to the time and opportunity available, and, accordingly, should be excluded when evaluating the trends of the Company's operations. Alltel believes that presenting the current business measures assists investors in assessing the true business performance of the Company by clarifying for investors the effects that certain items such as asset sales, integration expenses and other business consolidation costs arising from past acquisition and integration activities had on the Company’s GAAP consolidated results of operations. The Company uses results from current businesses as management’s primary measure of the performance of its business operations. Alltel's management, including the chief operating decision-maker, uses the current business measures consistently for all purposes, including internal reporting purposes, the evaluation of business objectives, opportunities and performance and the determination of management compensation. (A) Eliminates the effects of amortization expense related to acquired, finite-lived intangible assets. (B) The Company incurred $2.6 million of integration expenses related to its acquisitions of Midwest Wireless Holdings (quot;Midwest Wirelessquot;) and wireless properties in Illinois, Texas and Virginia completed during 2006. These expenses primarily consisted of branding, signage and computer system conversion costs. Alltel also recorded a pretax charge of $3.7 million associated with the closing of two call centers consisting of severance and employee benefit costs related to a planned workforce reduction. (C) Alltel completed the sale of marketable equity securities that had been acquired in connection with its August 1, 2005 merger with Western Wireless Corporation (quot;Western Wirelessquot;). In connection with the sale of these securities, Alltel recorded a pretax gain of $56.5 million. (D) The Company incurred $10.8 million of integration expenses related to its acquisition of Western Wireless. These expenses consisted of $8.3 million of rebranding costs and $2.5 million of system conversion costs and other integration costs. (E) Eliminates the effects of discontinued operations. Loss from discontinued operations in the first quarter of 2007 included an impairment charge of $1.7 million to reflect the fair value less cost to sell of the four rural markets in Minnesota required to be divested, as further discussed below. As a condition of receiving approval from the Department of Justice (quot;DOJquot;) and the Federal Communications Commission (quot;FCCquot;) for its acquisition of Midwest Wireless, on September 7, 2006, Alltel agreed to divest certain wireless operations in four rural markets in Minnesota. Accordingly, the four markets to be divested in Minnesota have been classified as discontinued operations in the accompanying unaudited consolidated financial statements. On April 3, 2007, Alltel completed the sale of these properties. On July 17, 2006, Alltel completed the spin-off of its wireline telecommunications business to its stockholders and the merger of that wireline business with Valor Communications Group, Inc. (quot;Valorquot;). The spin-off included the majority of Alltel’s communications support services, including directory publishing, information technology outsourcing services, retail long-distance and the wireline sales portion of communications products. The new wireline company formed in the merger of Alltel's wireline operations and Valor is named Windstream Corporation. As a result, Alltel's historical results of operations have been adjusted to reflect the wireline business as discontinued operations in the accompanying unaudited consolidated financial statements. In addition, as a condition of receiving approval for the Western Wireless acquisition from the DOJ and the FCC, Alltel agreed to divest certain wireless operations of Western Wireless in 16 markets in Arkansas, Kansas and Nebraska. In December 2005, Alltel completed an exchange of wireless properties with United States Cellular Corporation that included a substantial portion of the divestiture requirements related to the merger. In the first quarter of 2006, Alltel completed the required divestitures with the sale of the remaining property in Arkansas. During 2005, Alltel completed the sales of international operations in Georgia, Ghana and Ireland acquired from Western Wireless. During the second quarter of 2006, Alltel completed the sales of the remaining international operations acquired from Western Wireless in Austria, Bolivia, Côte d’Ivoire, Haiti, and Slovenia. As a result, the acquired international operations and interests of Western Wireless and the 16 markets to be divested in Arkansas, Kansas and Nebraska have been classified as discontinued operations in the accompanying unaudited consolidated financial statements. -end-