Download to read offline

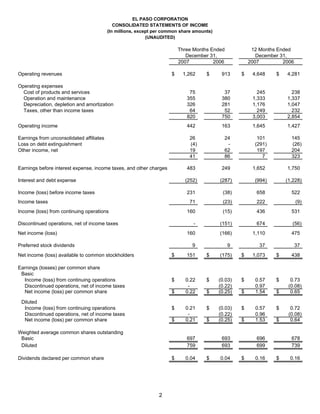
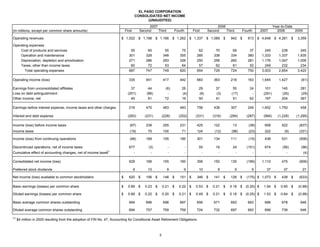
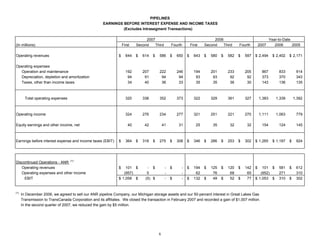
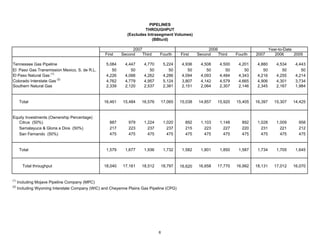
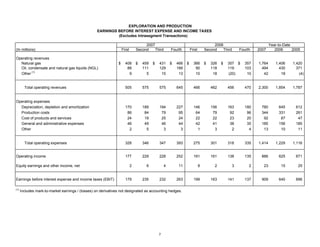
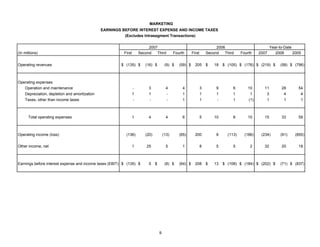
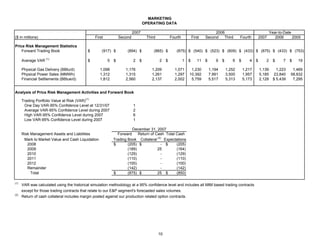
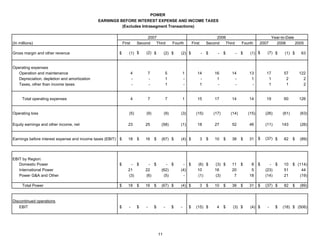
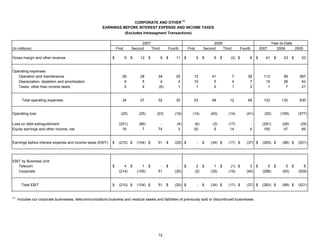
The document provides operating statistics and financial results for El Paso Corporation for the fourth quarter and full year of 2007. Key highlights include: - Consolidated net income for Q4 2007 was $160 million compared to a net loss of $166 million in Q4 2006. For the full year, net income was $1.11 billion compared to $475 million in 2006. - The Pipelines segment saw earnings before interest and taxes of $277 million in Q4 2007, up from $270 million in Q4 2006. For the full year, earnings were $1.11 billion, up from $1.06 billion in 2006. - Exploration and Production earnings before interest and taxes were $252


