Download to read offline

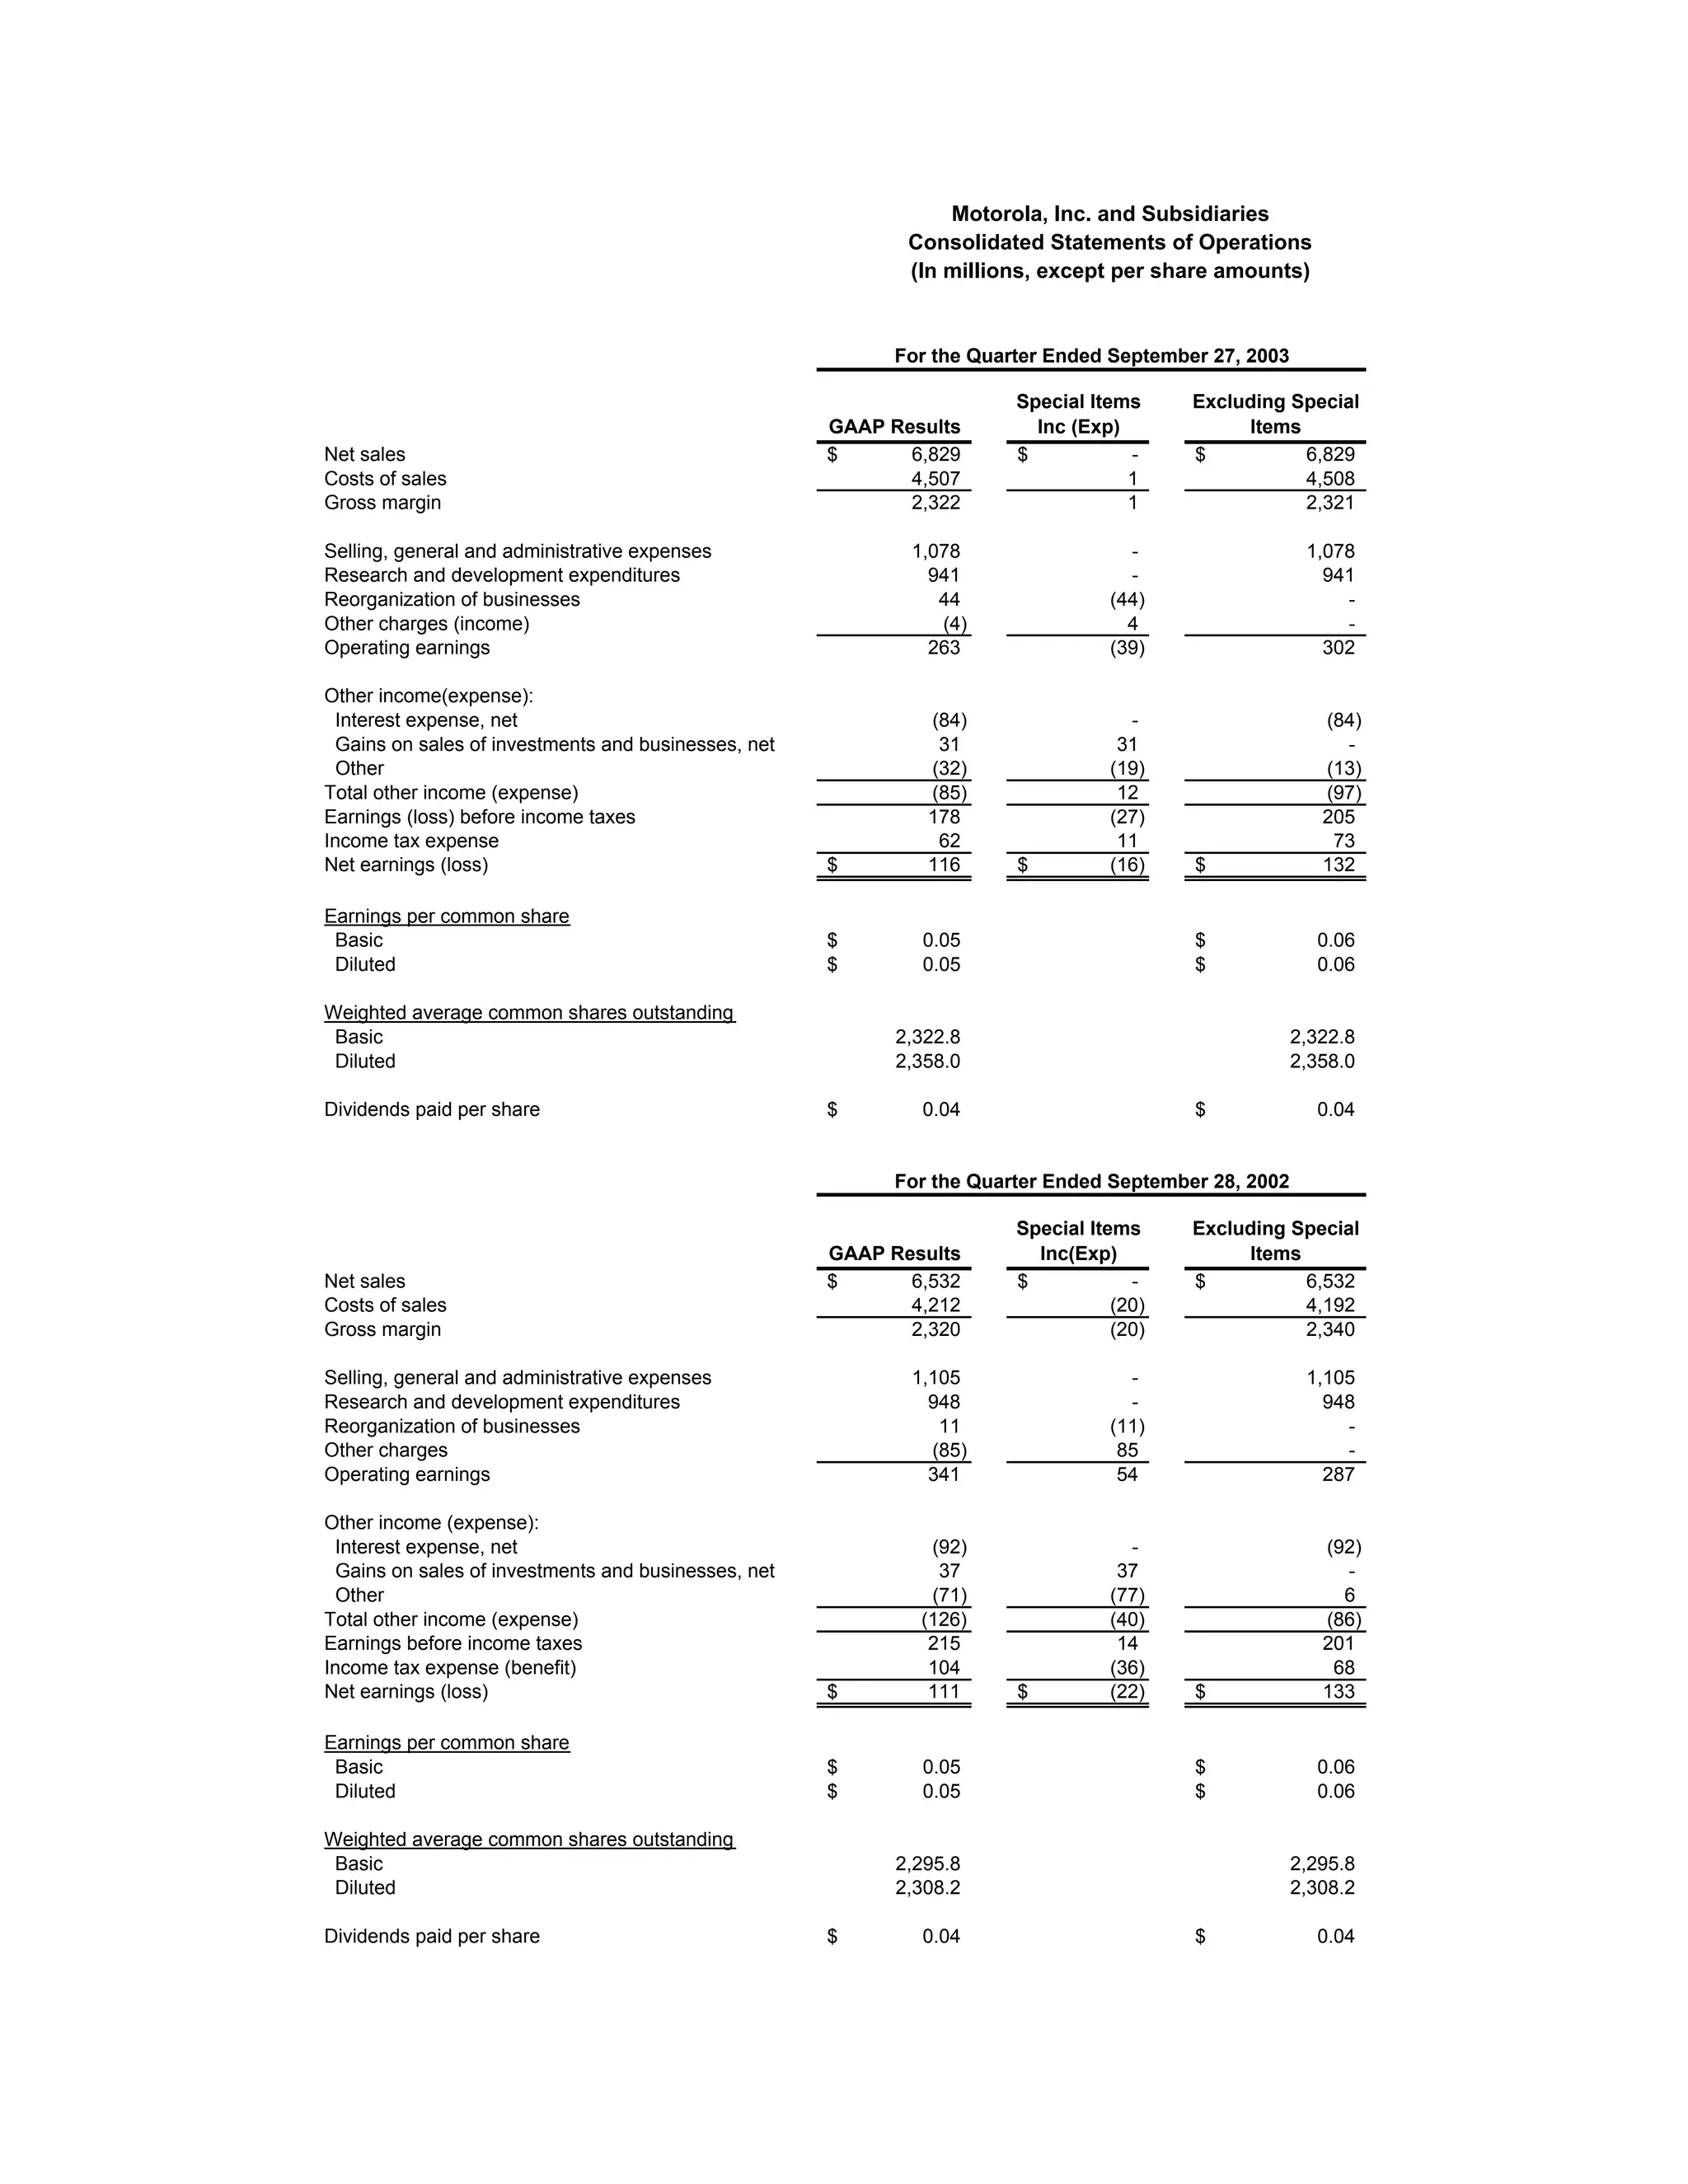
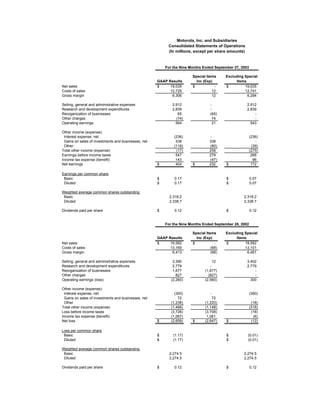
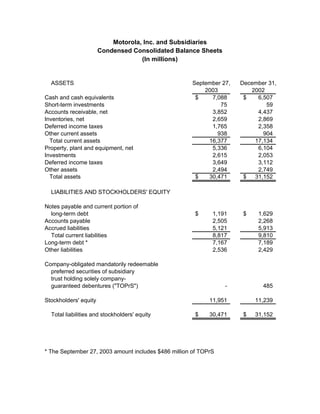
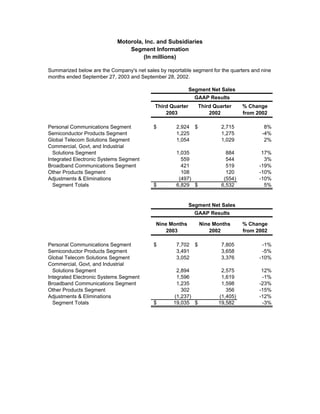
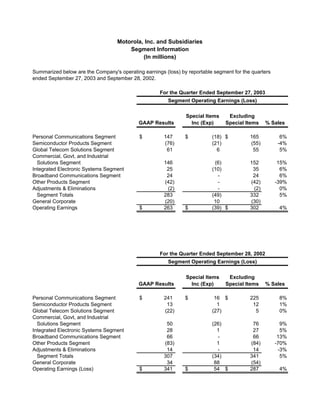
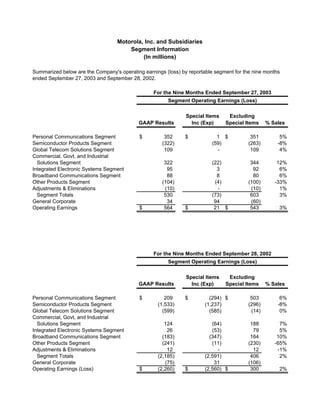
The document summarizes Motorola's consolidated statements of operations and segment information for quarters and nine months ending in September 2003 and September 2002. It shows Motorola's net sales, costs, expenses, earnings and losses. It also provides segment-level details on net sales and operating earnings/losses, with and without special items. Motorola's total net sales for the quarter increased 5% to $6.8 billion in 2003, with personal communications and commercial/government segments seeing growth, while its net earnings increased slightly to $116 million.


