SlideShare a Scribd company logo
1 of 6
Download to read offline
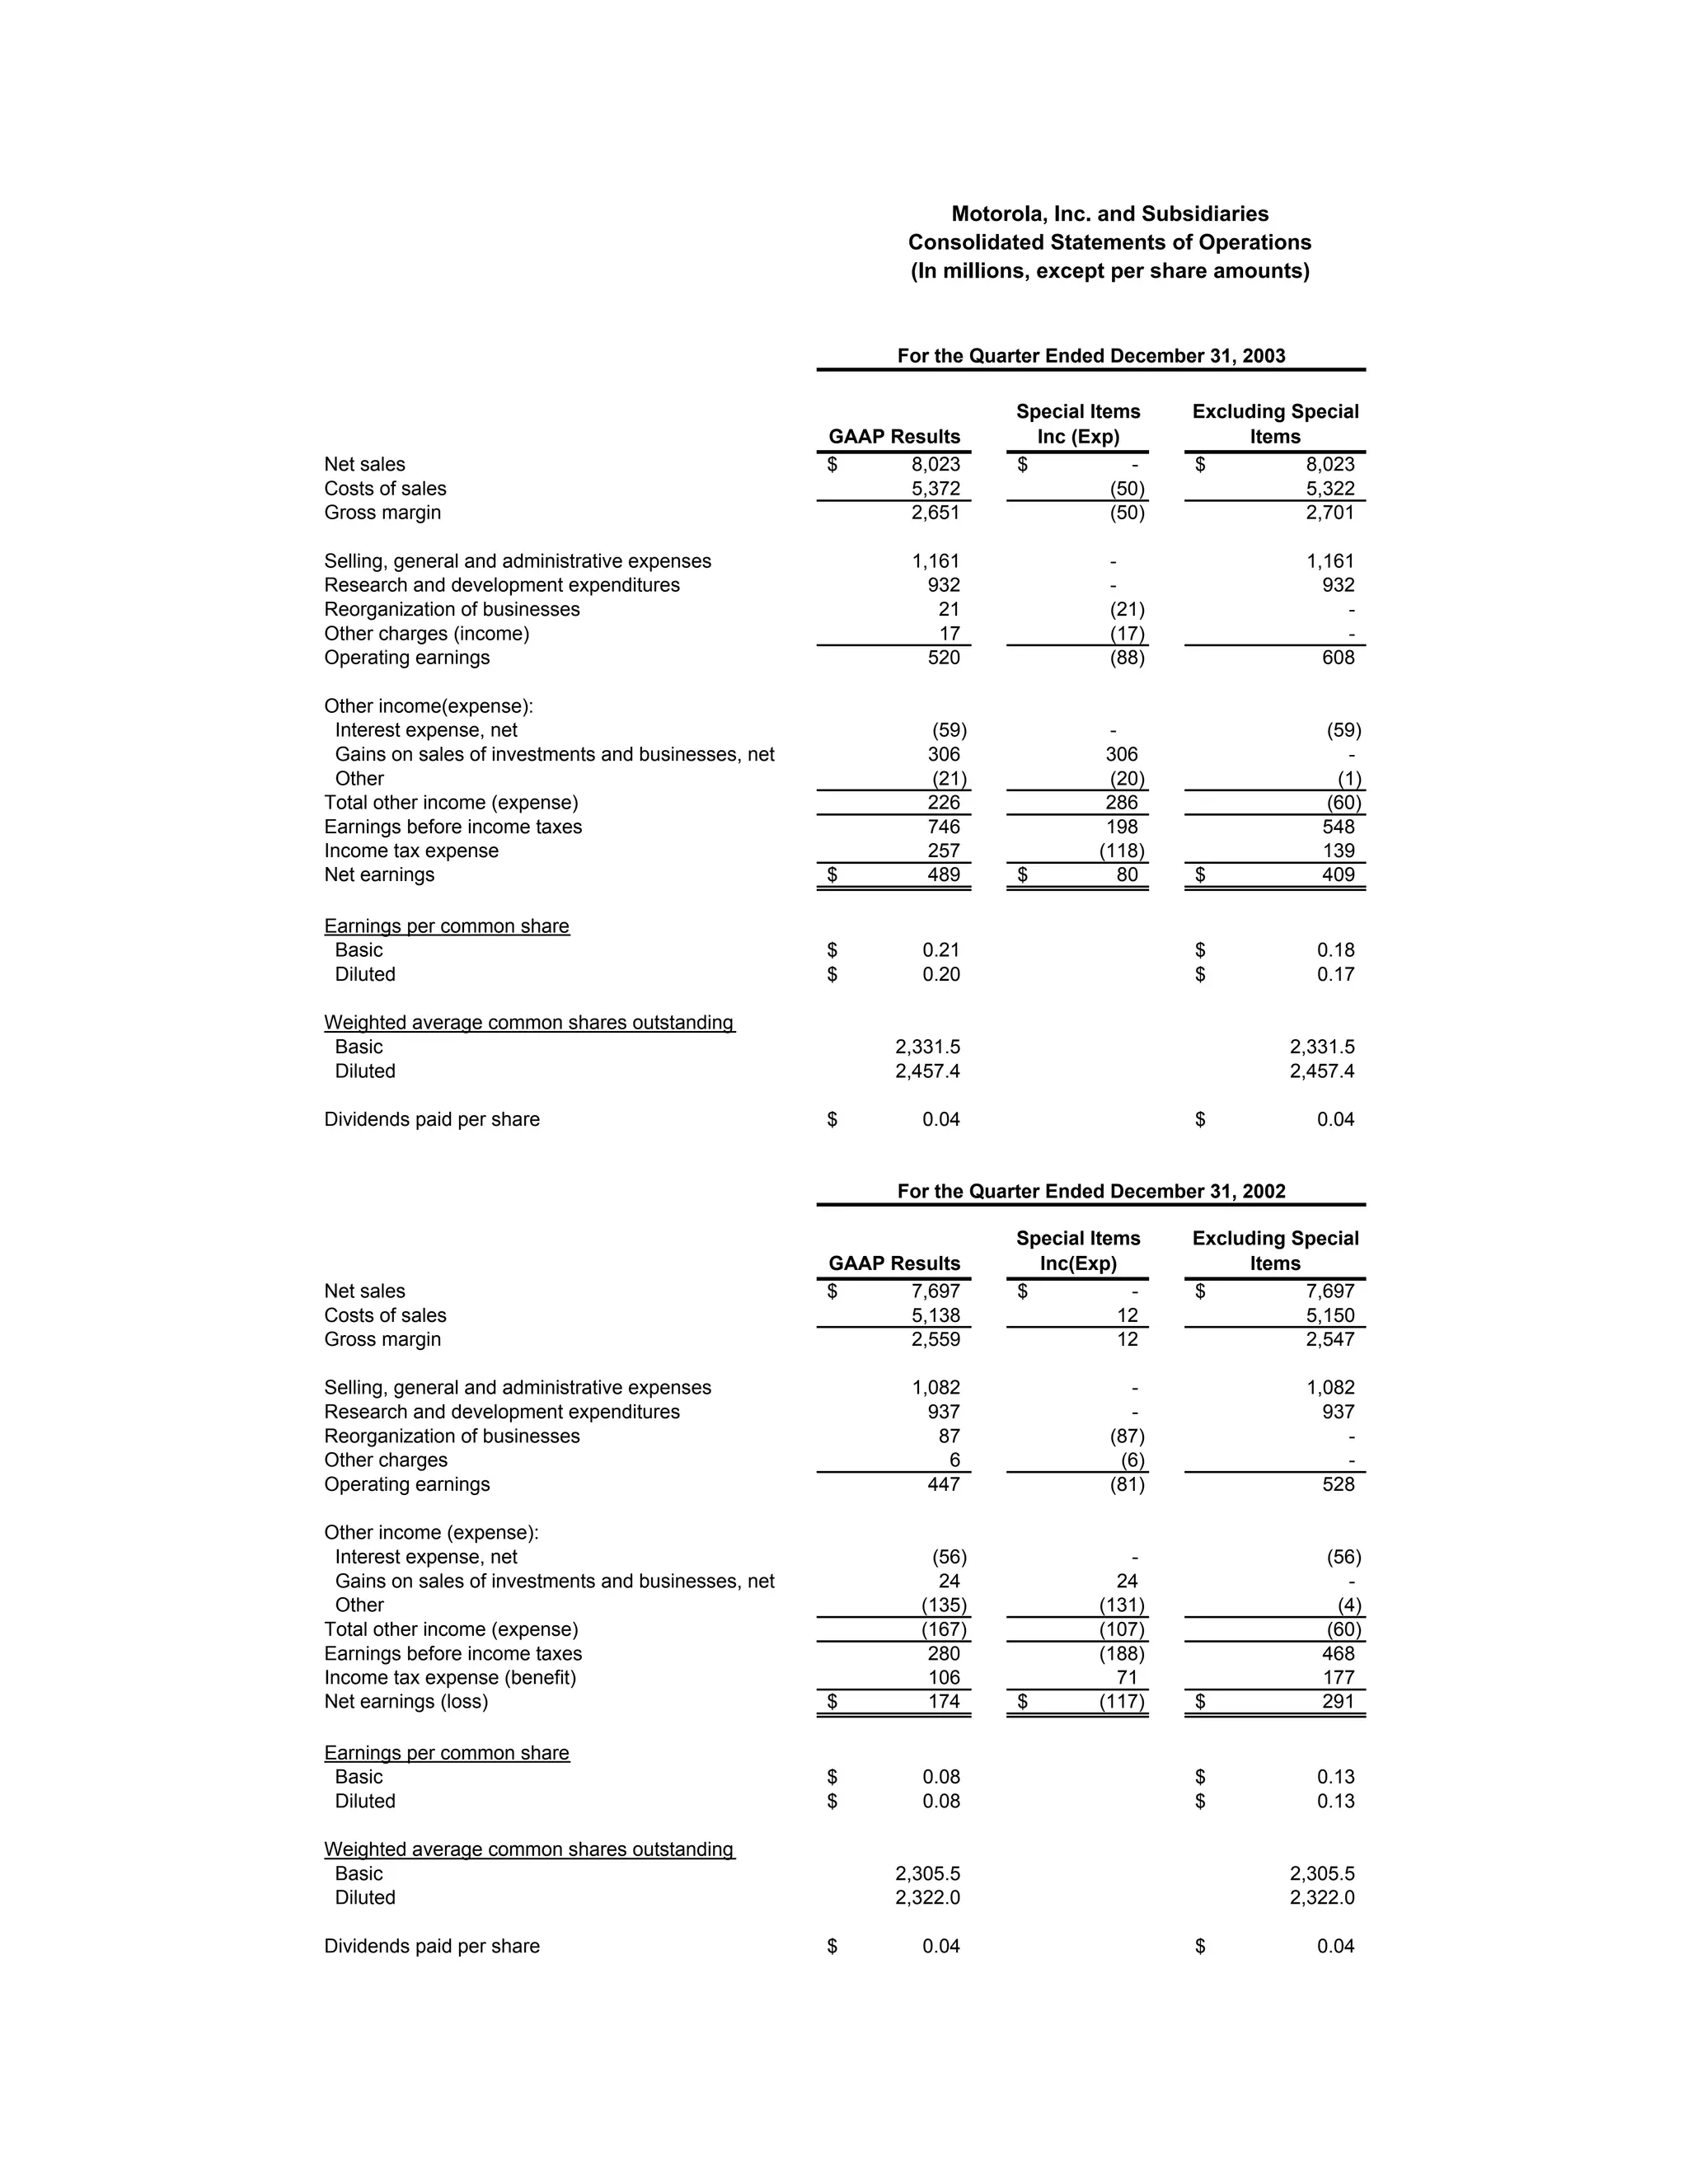
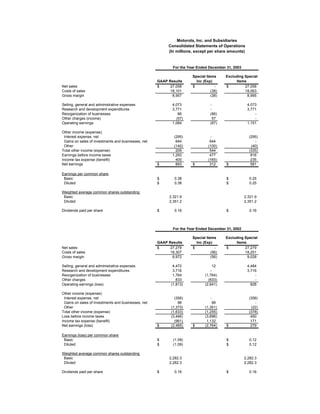
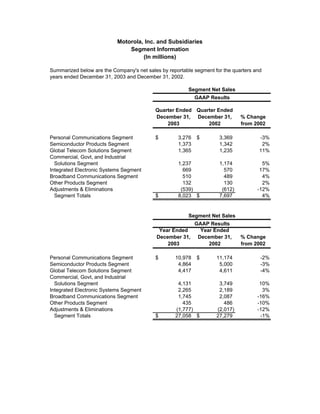
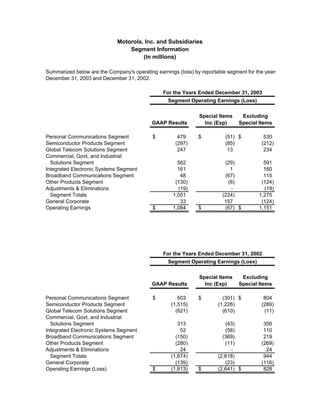
Motorola, Inc. and Subsidiaries
                                                            Consolidated Statements of Operations
                                                            (In millions, except per share amounts)


                                                           For the Quarter Ended December 31, 2003

                                                                      Special Items     Excluding Special
                                                     GAAP Results       Inc (Exp)            Items
Net sales                                            $      8,023     $            -    $          8,023
Costs of sales                                              5,372                (50)              5,322
Gross margin                                                2,651                (50)              2,701

Selling, general and administrative expenses                1,161               -                     1,161
Research and development expenditures                         932               -                       932
Reorganization of businesses                                   21               (21)                      -
Other charges (income)                                         17               (17)                      -
Operating earnings                                            520               (88)                    608

Other income(expense):
 Interest expense, net                                        (59)              -                       (59)
 Gains on sales of investments and businesses, net            306               306                       -
 Other                                                        (21)              (20)                     (1)
Total other income (expense)                                  226               286                     (60)
Earnings before income taxes                                  746               198                     548
Income tax expense                                            257              (118)                    139
Net earnings                                         $        489      $          80    $               409

Earnings per common share
 Basic                                               $       0.21                       $              0.18
 Diluted                                             $       0.20                       $              0.17

Weighted average common shares outstanding
 Basic                                                     2,331.5                                   2,331.5
 Diluted                                                   2,457.4                                   2,457.4

Dividends paid per share                             $       0.04                       $              0.04


                                                           For the Quarter Ended December 31, 2002

                                                                      Special Items     Excluding Special
                                                     GAAP Results       Inc(Exp)             Items
Net sales                                            $      7,697     $           -     $          7,697
Costs of sales                                              5,138                12                5,150
Gross margin                                                2,559                12                2,547

Selling, general and administrative expenses                1,082                 -                   1,082
Research and development expenditures                         937                 -                     937
Reorganization of businesses                                   87               (87)                      -
Other charges                                                   6                (6)                      -
Operating earnings                                            447               (81)                    528

Other income (expense):
 Interest expense, net                                        (56)                -                     (56)
 Gains on sales of investments and businesses, net             24                24                       -
 Other                                                       (135)             (131)                     (4)
Total other income (expense)                                 (167)             (107)                    (60)
Earnings before income taxes                                  280              (188)                    468
Income tax expense (benefit)                                  106                71                     177
Net earnings (loss)                                  $        174      $       (117)    $               291

Earnings per common share
 Basic                                               $       0.08                       $              0.13
 Diluted                                             $       0.08                       $              0.13

Weighted average common shares outstanding
 Basic                                                     2,305.5                                   2,305.5
 Diluted                                                   2,322.0                                   2,322.0

Dividends paid per share                             $       0.04                       $              0.04
Motorola, Inc. and Subsidiaries
                                                          Consolidated Statements of Operations
                                                          (In millions, except per share amounts)


                                                            For the Year Ended December 31, 2003

                                                                      Special Items     Excluding Special
                                                     GAAP Results       Inc (Exp)            Items
Net sales                                            $     27,058     $            -    $         27,058
Costs of sales                                             18,101                (38)             18,063
Gross margin                                                8,957                (38)              8,995

Selling, general and administrative expenses                4,073               -                   4,073
Research and development expenditures                       3,771               -                   3,771
Reorganization of businesses                                   86               (86)                    -
Other charges (income)                                        (57)                57                    -
Operating earnings                                          1,084               (67)                1,151

Other income (expense):
 Interest expense, net                                       (295)              -                    (295)
 Gains on sales of investments and businesses, net            644               644                     -
 Other                                                       (140)             (100)                  (40)
Total other income (expense)                                  209               544                  (335)
Earnings before income taxes                                1,293               477                   816
Income tax expense (benefit)                                  400              (165)                  235
Net earnings                                         $        893     $         312     $             581

Earnings per common share
 Basic                                               $       0.38                       $            0.25
 Diluted                                             $       0.38                       $            0.25

Weighted average common shares outstanding
 Basic                                                    2,321.9                                  2,321.9
 Diluted                                                  2,351.2                                  2,351.2

Dividends paid per share                             $       0.16                       $            0.16


                                                            For the Year Ended December 31, 2002

                                                                      Special Items     Excluding Special
                                                     GAAP Results       Inc (Exp)            Items
Net sales                                            $     27,279     $            -    $         27,279
Costs of sales                                             18,307                (56)             18,251
Gross margin                                                8,972                (56)              9,028

Selling, general and administrative expenses                4,472                 12                4,484
Research and development expenditures                       3,716               -                   3,716
Reorganization of businesses                                1,764            (1,764)                    -
Other charges                                                 833              (833)                    -
Operating earnings (loss)                                  (1,813)           (2,641)                  828

Other income (expense):
 Interest expense, net                                       (356)              -                    (356)
 Gains on sales of investments and businesses, net             96                96                     -
 Other                                                     (1,373)           (1,351)                  (22)
Total other income (expense)                               (1,633)           (1,255)                 (378)
Loss before income taxes                                   (3,446)           (3,896)                  450
Income tax expense (benefit)                                 (961)            1,132                   171
Net earnings (loss)                                  $     (2,485)    $      (2,764)    $             279

Earnings (loss) per common share
 Basic                                               $      (1.09)                      $            0.12
 Diluted                                             $      (1.09)                      $            0.12

Weighted average common shares outstanding
 Basic                                                    2,282.3                                  2,282.3
 Diluted                                                  2,282.3                                  2,282.3

Dividends paid per share                             $       0.16                       $            0.16
Motorola, Inc. and Subsidiaries
                       Condensed Consolidated Balance Sheets
                                    (In millions)


  ASSETS                                           December 31,   December 31,
                                                      2003           2002
Cash and cash equivalents                          $     7,877     $   6,507
Short-term investments                                     139            59
Accounts receivable, net                                 4,436         4,437
Inventories, net                                         2,792         2,869
Deferred income taxes                                    1,678         2,358
Other current assets                                       985           904
  Total current assets                                  17,907        17,134
Property, plant and equipment, net                       5,164         6,104
Investments                                              3,335         2,053
Deferred income taxes                                    3,349         3,112
Other assets                                             2,343         2,749
  Total assets                                     $    32,098     $  31,152

  LIABILITIES AND STOCKHOLDERS' EQUITY

Notes payable and current portion of
  long-term debt                                   $       896     $    1,629
Accounts payable                                         2,789          2,268
Accrued liabilities                                      5,748          5,913
  Total current liabilities                              9,433          9,810
Long-term debt                                           6,675          7,189
Other liabilities                                        2,815          2,429

Company-obligated mandatorily redeemable
  preferred securities of subsidiary
  trust holding solely company-
  guaranteed debentures (quot;TOPrSquot;)                          486           485

Stockholders' equity                                    12,689         11,239

  Total liabilities and stockholders' equity       $    32,098     $   31,152
Motorola, Inc. and Subsidiaries
                               Segment Information
                                    (In millions)

Summarized below are the Company's net sales by reportable segment for the quarters and
years ended December 31, 2003 and December 31, 2002.

                                                        Segment Net Sales
                                                            GAAP Results

                                           Quarter Ended Quarter Ended
                                           December 31, December 31,          % Change
                                               2003          2002             from 2002

Personal Communications Segment            $        3,276   $        3,369            -3%
Semiconductor Products Segment                      1,373            1,342             2%
Global Telecom Solutions Segment                    1,365            1,235            11%
Commercial, Govt, and Industrial
  Solutions Segment                                 1,237            1,174             5%
Integrated Electronic Systems Segment                 669              570            17%
Broadband Communications Segment                      510              489             4%
Other Products Segment                                132              130             2%
Adjustments & Eliminations                           (539)            (612)          -12%
  Segment Totals                           $        8,023 $          7,697             4%


                                                        Segment Net Sales
                                                            GAAP Results
                                            Year Ended        Year Ended
                                           December 31,      December 31,     % Change
                                               2003              2002         from 2002

Personal Communications Segment            $       10,978   $       11,174            -2%
Semiconductor Products Segment                      4,864            5,000            -3%
Global Telecom Solutions Segment                    4,417            4,611            -4%
Commercial, Govt, and Industrial
  Solutions Segment                                 4,131            3,749            10%
Integrated Electronic Systems Segment               2,265            2,189             3%
Broadband Communications Segment                    1,745            2,087           -16%
Other Products Segment                                435              486           -10%
Adjustments & Eliminations                         (1,777)          (2,017)          -12%
  Segment Totals                           $       27,058 $         27,279            -1%
Motorola, Inc. and Subsidiaries
                                 Segment Information
                                      (In millions)

Summarized below are the Company's operating earnings by reportable segment for the quarters
ended December 31, 2003 and December 31, 2002.

                                               For the Quarter Ended December 31, 2003
                                                  Segment Operating Earnings (Loss)

                                                               Special Items    Excluding
                                           GAAP Results          Inc (Exp)     Special Items

Personal Communications Segment            $          127     $          (52) $          179
Semiconductor Products Segment                         25                (26)             51
Global Telecom Solutions Segment                      138                 13             125
Commercial, Govt, and Industrial
  Solutions Segment                                   240                 (7)            247
Integrated Electronic Systems Segment                  66                 (2)             68
Broadband Communications Segment                      (40)               (75)             35
Other Products Segment                                (25)                (2)            (23)
Adjustments & Eliminations                             (9)                 -              (9)
  Segment Totals                                      522               (151)            673
General Corporate                                      (2)                63             (65)
Operating Earnings                         $          520     $          (88) $          608


                                               For the Quarter Ended December 31, 2002
                                                  Segment Operating Earnings (Loss)

                                                               Special Items    Excluding
                                           GAAP Results          Inc (Exp)     Special Items

Personal Communications Segment            $          294     $           (7) $          301
Semiconductor Products Segment                         18                 11               7
Global Telecom Solutions Segment                      (22)               (25)              3
Commercial, Govt, and Industrial
  Solutions Segment                                   189                 21             168
Integrated Electronic Systems Segment                  26                 (5)             31
Broadband Communications Segment                       33                (22)             55
Other Products Segment                                (39)                 -             (39)
Adjustments & Eliminations                             12                  -              12
  Segment Totals                                      511                (27)            538
General Corporate                                     (64)               (54)            (10)
Operating Earnings                         $          447     $          (81) $          528
Motorola, Inc. and Subsidiaries
                                 Segment Information
                                      (In millions)

Summarized below are the Company's operating earnings (loss) by reportable segment for the years
December 31, 2003 and December 31, 2002.

                                                For the Years Ended December 31, 2003
                                                  Segment Operating Earnings (Loss)

                                                               Special Items    Excluding
                                            GAAP Results         Inc (Exp)     Special Items

Personal Communications Segment             $         479      $          (51) $          530
Semiconductor Products Segment                       (297)                (85)           (212)
Global Telecom Solutions Segment                      247                  13             234
Commercial, Govt, and Industrial
  Solutions Segment                                   562                 (29)            591
Integrated Electronic Systems Segment                 161                   1             160
Broadband Communications Segment                       48                 (67)            115
Other Products Segment                               (130)                 (6)           (124)
Adjustments & Eliminations                            (19)                  -             (19)
  Segment Totals                                    1,051                (224)          1,275
General Corporate                                      33                 157            (124)
Operating Earnings                          $       1,084      $          (67) $        1,151


                                                For the Years Ended December 31, 2002
                                                  Segment Operating Earnings (Loss)

                                                               Special Items    Excluding
                                            GAAP Results         Inc (Exp)     Special Items

Personal Communications Segment             $         503      $         (301) $          804
Semiconductor Products Segment                     (1,515)             (1,226)           (289)
Global Telecom Solutions Segment                     (621)               (610)            (11)
Commercial, Govt, and Industrial
  Solutions Segment                                   313                 (43)            356
Integrated Electronic Systems Segment                  52                 (58)            110
Broadband Communications Segment                     (150)               (369)            219
Other Products Segment                               (280)                (11)           (269)
Adjustments & Eliminations                             24                   -              24
  Segment Totals                                   (1,674)             (2,618)            944
General Corporate                                    (139)                (23)           (116)
Operating Earnings (Loss)                   $      (1,813)     $       (2,641) $          828

More Related Content

What's hot

AES 2007 Fact Book Update FINAL
 AES 2007 Fact Book Update FINAL AES 2007 Fact Book Update FINAL
AES 2007 Fact Book Update FINALfinance19
 
CLX0202Earnings-963963
CLX0202Earnings-963963CLX0202Earnings-963963
CLX0202Earnings-963963finance48
 
danaher 08_4Q_Release
danaher 08_4Q_Releasedanaher 08_4Q_Release
danaher 08_4Q_Releasefinance24
 
el paso 22758BEF-CBE8-4368-BDC6-D02434EE5C13_EP_4Q08OpStatsFinal
el paso 22758BEF-CBE8-4368-BDC6-D02434EE5C13_EP_4Q08OpStatsFinalel paso 22758BEF-CBE8-4368-BDC6-D02434EE5C13_EP_4Q08OpStatsFinal
el paso 22758BEF-CBE8-4368-BDC6-D02434EE5C13_EP_4Q08OpStatsFinalfinance49
 
Maxim 2Q FISCAL 2009 RESULTS
Maxim 2Q FISCAL 2009 RESULTSMaxim 2Q FISCAL 2009 RESULTS
Maxim 2Q FISCAL 2009 RESULTSearningsreport
 
CLX0802BalSheet-159951
CLX0802BalSheet-159951CLX0802BalSheet-159951
CLX0802BalSheet-159951finance48
 
4Q06OpStats_FNAL_022307
4Q06OpStats_FNAL_0223074Q06OpStats_FNAL_022307
4Q06OpStats_FNAL_022307finance49
 
danaher 08_2Q_Release
danaher 08_2Q_Releasedanaher 08_2Q_Release
danaher 08_2Q_Releasefinance24
 
smurfit stone container 2003annual
smurfit stone container  2003annualsmurfit stone container  2003annual
smurfit stone container 2003annualfinance30
 
Q1 2006 Earnings Release Financial Tables
Q1 2006 Earnings Release Financial TablesQ1 2006 Earnings Release Financial Tables
Q1 2006 Earnings Release Financial Tablesfinance7
 
dover Q208_Supplement_r232g32g32g
dover Q208_Supplement_r232g32g32gdover Q208_Supplement_r232g32g32g
dover Q208_Supplement_r232g32g32gfinance30
 
CLX0503SegInfo-159159
CLX0503SegInfo-159159CLX0503SegInfo-159159
CLX0503SegInfo-159159finance48
 

What's hot (15)

AES 2007 Fact Book Update FINAL
 AES 2007 Fact Book Update FINAL AES 2007 Fact Book Update FINAL
AES 2007 Fact Book Update FINAL
 
hp 2004 /2003Financial Overview
hp 2004 /2003Financial Overviewhp 2004 /2003Financial Overview
hp 2004 /2003Financial Overview
 
CLX0202Earnings-963963
CLX0202Earnings-963963CLX0202Earnings-963963
CLX0202Earnings-963963
 
danaher 08_4Q_Release
danaher 08_4Q_Releasedanaher 08_4Q_Release
danaher 08_4Q_Release
 
First Quarter 2008 Earnings Presentation
First Quarter 2008 Earnings PresentationFirst Quarter 2008 Earnings Presentation
First Quarter 2008 Earnings Presentation
 
el paso 22758BEF-CBE8-4368-BDC6-D02434EE5C13_EP_4Q08OpStatsFinal
el paso 22758BEF-CBE8-4368-BDC6-D02434EE5C13_EP_4Q08OpStatsFinalel paso 22758BEF-CBE8-4368-BDC6-D02434EE5C13_EP_4Q08OpStatsFinal
el paso 22758BEF-CBE8-4368-BDC6-D02434EE5C13_EP_4Q08OpStatsFinal
 
Amd Q308 Financials
Amd Q308 FinancialsAmd Q308 Financials
Amd Q308 Financials
 
Maxim 2Q FISCAL 2009 RESULTS
Maxim 2Q FISCAL 2009 RESULTSMaxim 2Q FISCAL 2009 RESULTS
Maxim 2Q FISCAL 2009 RESULTS
 
CLX0802BalSheet-159951
CLX0802BalSheet-159951CLX0802BalSheet-159951
CLX0802BalSheet-159951
 
4Q06OpStats_FNAL_022307
4Q06OpStats_FNAL_0223074Q06OpStats_FNAL_022307
4Q06OpStats_FNAL_022307
 
danaher 08_2Q_Release
danaher 08_2Q_Releasedanaher 08_2Q_Release
danaher 08_2Q_Release
 
smurfit stone container 2003annual
smurfit stone container  2003annualsmurfit stone container  2003annual
smurfit stone container 2003annual
 
Q1 2006 Earnings Release Financial Tables
Q1 2006 Earnings Release Financial TablesQ1 2006 Earnings Release Financial Tables
Q1 2006 Earnings Release Financial Tables
 
dover Q208_Supplement_r232g32g32g
dover Q208_Supplement_r232g32g32gdover Q208_Supplement_r232g32g32g
dover Q208_Supplement_r232g32g32g
 
CLX0503SegInfo-159159
CLX0503SegInfo-159159CLX0503SegInfo-159159
CLX0503SegInfo-159159
 

Viewers also liked

June 10, 2008 Deutsche Bank 2008 Media and Telecom Conference
June 10, 2008  Deutsche Bank 2008 Media and Telecom ConferenceJune 10, 2008  Deutsche Bank 2008 Media and Telecom Conference
June 10, 2008 Deutsche Bank 2008 Media and Telecom Conferencefinance7
 
motorola 2007 Annual Report on Form 10-K
motorola 	2007 Annual Report on Form 10-Kmotorola 	2007 Annual Report on Form 10-K
motorola 2007 Annual Report on Form 10-Kfinance7
 
Q3 2002 Earnings Release Presentation
Q3 2002 Earnings Release PresentationQ3 2002 Earnings Release Presentation
Q3 2002 Earnings Release Presentationfinance7
 
Q2 2004 Motorola Inc. Earnings Conference Call Presentation
Q2 2004 Motorola Inc. Earnings Conference Call PresentationQ2 2004 Motorola Inc. Earnings Conference Call Presentation
Q2 2004 Motorola Inc. Earnings Conference Call Presentationfinance7
 
Keynote Presentation by Kathy Paladino, President, Enterprise Mobility busin...
	Keynote Presentation by Kathy Paladino, President, Enterprise Mobility busin...	Keynote Presentation by Kathy Paladino, President, Enterprise Mobility busin...
Keynote Presentation by Kathy Paladino, President, Enterprise Mobility busin...finance7
 
walt disney Quarter 2008 4th
walt disney   Quarter 2008 4thwalt disney   Quarter 2008 4th
walt disney Quarter 2008 4thfinance7
 
FedEx Corp. Reports Solid First Quarter Revenue Growth Sep 17, 2003
FedEx Corp. Reports Solid First Quarter Revenue Growth Sep 17, 2003 FedEx Corp. Reports Solid First Quarter Revenue Growth Sep 17, 2003
FedEx Corp. Reports Solid First Quarter Revenue Growth Sep 17, 2003 finance7
 
Q1 2005 Earnings Release Financial Tables
 	Q1 2005 Earnings Release Financial Tables 	Q1 2005 Earnings Release Financial Tables
Q1 2005 Earnings Release Financial Tablesfinance7
 
motorola 2002 Annual Report
motorola 	2002 Annual Reportmotorola 	2002 Annual Report
motorola 2002 Annual Reportfinance7
 
Q3 2005 Motorola Inc. Earnings Conference Call Presentation
Q3 2005 Motorola Inc. Earnings Conference Call PresentationQ3 2005 Motorola Inc. Earnings Conference Call Presentation
Q3 2005 Motorola Inc. Earnings Conference Call Presentationfinance7
 
Q2 2003 Earnings Release
Q2 2003 Earnings ReleaseQ2 2003 Earnings Release
Q2 2003 Earnings Releasefinance7
 
Q4 2001 Conference Call Opening Comments
Q4 2001 Conference Call Opening CommentsQ4 2001 Conference Call Opening Comments
Q4 2001 Conference Call Opening Commentsfinance7
 
View Summary FedEx Corp. Reports Higher Fourth Quarter Earnings, Record Yea...
View Summary  	FedEx Corp. Reports Higher Fourth Quarter Earnings, Record Yea...View Summary  	FedEx Corp. Reports Higher Fourth Quarter Earnings, Record Yea...
View Summary FedEx Corp. Reports Higher Fourth Quarter Earnings, Record Yea...finance7
 
ingram micro Proxy Statement 2004
ingram micro  Proxy Statement 2004ingram micro  Proxy Statement 2004
ingram micro Proxy Statement 2004finance7
 
walt disney Quarter 2004 3rd
walt disney  Quarter 2004 3rdwalt disney  Quarter 2004 3rd
walt disney Quarter 2004 3rdfinance7
 
ingram micro Annual Report 2006
ingram micro Annual Report 2006ingram micro Annual Report 2006
ingram micro Annual Report 2006finance7
 
walt disney Quarter 2005 2nd
walt disney  Quarter 2005 2ndwalt disney  Quarter 2005 2nd
walt disney Quarter 2005 2ndfinance7
 
sysco Annual Reports2002
sysco Annual Reports2002sysco Annual Reports2002
sysco Annual Reports2002finance7
 

Viewers also liked (18)

June 10, 2008 Deutsche Bank 2008 Media and Telecom Conference
June 10, 2008  Deutsche Bank 2008 Media and Telecom ConferenceJune 10, 2008  Deutsche Bank 2008 Media and Telecom Conference
June 10, 2008 Deutsche Bank 2008 Media and Telecom Conference
 
motorola 2007 Annual Report on Form 10-K
motorola 	2007 Annual Report on Form 10-Kmotorola 	2007 Annual Report on Form 10-K
motorola 2007 Annual Report on Form 10-K
 
Q3 2002 Earnings Release Presentation
Q3 2002 Earnings Release PresentationQ3 2002 Earnings Release Presentation
Q3 2002 Earnings Release Presentation
 
Q2 2004 Motorola Inc. Earnings Conference Call Presentation
Q2 2004 Motorola Inc. Earnings Conference Call PresentationQ2 2004 Motorola Inc. Earnings Conference Call Presentation
Q2 2004 Motorola Inc. Earnings Conference Call Presentation
 
Keynote Presentation by Kathy Paladino, President, Enterprise Mobility busin...
	Keynote Presentation by Kathy Paladino, President, Enterprise Mobility busin...	Keynote Presentation by Kathy Paladino, President, Enterprise Mobility busin...
Keynote Presentation by Kathy Paladino, President, Enterprise Mobility busin...
 
walt disney Quarter 2008 4th
walt disney   Quarter 2008 4thwalt disney   Quarter 2008 4th
walt disney Quarter 2008 4th
 
FedEx Corp. Reports Solid First Quarter Revenue Growth Sep 17, 2003
FedEx Corp. Reports Solid First Quarter Revenue Growth Sep 17, 2003 FedEx Corp. Reports Solid First Quarter Revenue Growth Sep 17, 2003
FedEx Corp. Reports Solid First Quarter Revenue Growth Sep 17, 2003
 
Q1 2005 Earnings Release Financial Tables
 	Q1 2005 Earnings Release Financial Tables 	Q1 2005 Earnings Release Financial Tables
Q1 2005 Earnings Release Financial Tables
 
motorola 2002 Annual Report
motorola 	2002 Annual Reportmotorola 	2002 Annual Report
motorola 2002 Annual Report
 
Q3 2005 Motorola Inc. Earnings Conference Call Presentation
Q3 2005 Motorola Inc. Earnings Conference Call PresentationQ3 2005 Motorola Inc. Earnings Conference Call Presentation
Q3 2005 Motorola Inc. Earnings Conference Call Presentation
 
Q2 2003 Earnings Release
Q2 2003 Earnings ReleaseQ2 2003 Earnings Release
Q2 2003 Earnings Release
 
Q4 2001 Conference Call Opening Comments
Q4 2001 Conference Call Opening CommentsQ4 2001 Conference Call Opening Comments
Q4 2001 Conference Call Opening Comments
 
View Summary FedEx Corp. Reports Higher Fourth Quarter Earnings, Record Yea...
View Summary  	FedEx Corp. Reports Higher Fourth Quarter Earnings, Record Yea...View Summary  	FedEx Corp. Reports Higher Fourth Quarter Earnings, Record Yea...
View Summary FedEx Corp. Reports Higher Fourth Quarter Earnings, Record Yea...
 
ingram micro Proxy Statement 2004
ingram micro  Proxy Statement 2004ingram micro  Proxy Statement 2004
ingram micro Proxy Statement 2004
 
walt disney Quarter 2004 3rd
walt disney  Quarter 2004 3rdwalt disney  Quarter 2004 3rd
walt disney Quarter 2004 3rd
 
ingram micro Annual Report 2006
ingram micro Annual Report 2006ingram micro Annual Report 2006
ingram micro Annual Report 2006
 
walt disney Quarter 2005 2nd
walt disney  Quarter 2005 2ndwalt disney  Quarter 2005 2nd
walt disney Quarter 2005 2nd
 
sysco Annual Reports2002
sysco Annual Reports2002sysco Annual Reports2002
sysco Annual Reports2002
 

Similar to Q4 2003 Earnings Release Financial Tables

el paso 22758BEF-CBE8-4368-BDC6-D02434EE5C13_EP_4Q08OpStatsFinal
el paso 22758BEF-CBE8-4368-BDC6-D02434EE5C13_EP_4Q08OpStatsFinalel paso 22758BEF-CBE8-4368-BDC6-D02434EE5C13_EP_4Q08OpStatsFinal
el paso 22758BEF-CBE8-4368-BDC6-D02434EE5C13_EP_4Q08OpStatsFinalfinance49
 
22758BEF-CBE8-4368-BDC6-D02434EE5C13_EP_4Q08OpStatsFinal
22758BEF-CBE8-4368-BDC6-D02434EE5C13_EP_4Q08OpStatsFinal22758BEF-CBE8-4368-BDC6-D02434EE5C13_EP_4Q08OpStatsFinal
22758BEF-CBE8-4368-BDC6-D02434EE5C13_EP_4Q08OpStatsFinalfinance49
 
fy04_q2_henkel
fy04_q2_henkelfy04_q2_henkel
fy04_q2_henkelfinance48
 
AES 2007 Fact Book Update FINAL
 AES 2007 Fact Book Update FINAL AES 2007 Fact Book Update FINAL
AES 2007 Fact Book Update FINALfinance19
 
AES 2007Fact Book Update fINAL
 AES 2007Fact Book Update fINAL AES 2007Fact Book Update fINAL
AES 2007Fact Book Update fINALfinance19
 
Q1 2007 Earnings Release Financial Tables
 	Q1 2007 Earnings Release Financial Tables 	Q1 2007 Earnings Release Financial Tables
Q1 2007 Earnings Release Financial Tablesfinance7
 
4Q06OpStats_FNAL_022307
4Q06OpStats_FNAL_0223074Q06OpStats_FNAL_022307
4Q06OpStats_FNAL_022307finance49
 
EP4Q07OpStats_Final
EP4Q07OpStats_FinalEP4Q07OpStats_Final
EP4Q07OpStats_Finalfinance49
 
EP4Q07OpStats_Final
EP4Q07OpStats_FinalEP4Q07OpStats_Final
EP4Q07OpStats_Finalfinance49
 
advanced micro devices Q308Financials
advanced micro devices Q308Financialsadvanced micro devices Q308Financials
advanced micro devices Q308Financialsfinance34
 
advanced micro devices Q307Financials
advanced micro devices Q307Financialsadvanced micro devices Q307Financials
advanced micro devices Q307Financialsfinance34
 
CLOrox q4_fy05_supplemental
CLOrox   q4_fy05_supplementalCLOrox   q4_fy05_supplemental
CLOrox q4_fy05_supplementalfinance48
 
advanced micro devices Q408Financials
advanced micro devices Q408Financialsadvanced micro devices Q408Financials
advanced micro devices Q408Financialsfinance34
 
AMD Q408Financials
AMD Q408FinancialsAMD Q408Financials
AMD Q408Financialsfinance34
 
AMD-Q408Financials
AMD-Q408FinancialsAMD-Q408Financials
AMD-Q408Financialsfinance34
 
AMD Q408Financials
AMD Q408FinancialsAMD Q408Financials
AMD Q408Financialsfinance34
 

Similar to Q4 2003 Earnings Release Financial Tables (20)

el paso 22758BEF-CBE8-4368-BDC6-D02434EE5C13_EP_4Q08OpStatsFinal
el paso 22758BEF-CBE8-4368-BDC6-D02434EE5C13_EP_4Q08OpStatsFinalel paso 22758BEF-CBE8-4368-BDC6-D02434EE5C13_EP_4Q08OpStatsFinal
el paso 22758BEF-CBE8-4368-BDC6-D02434EE5C13_EP_4Q08OpStatsFinal
 
22758BEF-CBE8-4368-BDC6-D02434EE5C13_EP_4Q08OpStatsFinal
22758BEF-CBE8-4368-BDC6-D02434EE5C13_EP_4Q08OpStatsFinal22758BEF-CBE8-4368-BDC6-D02434EE5C13_EP_4Q08OpStatsFinal
22758BEF-CBE8-4368-BDC6-D02434EE5C13_EP_4Q08OpStatsFinal
 
fy04_q2_henkel
fy04_q2_henkelfy04_q2_henkel
fy04_q2_henkel
 
AES 2007 Fact Book Update FINAL
 AES 2007 Fact Book Update FINAL AES 2007 Fact Book Update FINAL
AES 2007 Fact Book Update FINAL
 
AES 2007Fact Book Update fINAL
 AES 2007Fact Book Update fINAL AES 2007Fact Book Update fINAL
AES 2007Fact Book Update fINAL
 
Q1 2007 Earnings Release Financial Tables
 	Q1 2007 Earnings Release Financial Tables 	Q1 2007 Earnings Release Financial Tables
Q1 2007 Earnings Release Financial Tables
 
4Q06OpStats_FNAL_022307
4Q06OpStats_FNAL_0223074Q06OpStats_FNAL_022307
4Q06OpStats_FNAL_022307
 
EP4Q07OpStats_Final
EP4Q07OpStats_FinalEP4Q07OpStats_Final
EP4Q07OpStats_Final
 
EP4Q07OpStats_Final
EP4Q07OpStats_FinalEP4Q07OpStats_Final
EP4Q07OpStats_Final
 
4Q05OpStats
4Q05OpStats4Q05OpStats
4Q05OpStats
 
4Q05OpStats
4Q05OpStats4Q05OpStats
4Q05OpStats
 
clx_q2fy04
clx_q2fy04clx_q2fy04
clx_q2fy04
 
advanced micro devices Q308Financials
advanced micro devices Q308Financialsadvanced micro devices Q308Financials
advanced micro devices Q308Financials
 
advanced micro devices Q307Financials
advanced micro devices Q307Financialsadvanced micro devices Q307Financials
advanced micro devices Q307Financials
 
Amd Q307 Financials
Amd Q307 FinancialsAmd Q307 Financials
Amd Q307 Financials
 
CLOrox q4_fy05_supplemental
CLOrox   q4_fy05_supplementalCLOrox   q4_fy05_supplemental
CLOrox q4_fy05_supplemental
 
advanced micro devices Q408Financials
advanced micro devices Q408Financialsadvanced micro devices Q408Financials
advanced micro devices Q408Financials
 
AMD Q408Financials
AMD Q408FinancialsAMD Q408Financials
AMD Q408Financials
 
AMD-Q408Financials
AMD-Q408FinancialsAMD-Q408Financials
AMD-Q408Financials
 
AMD Q408Financials
AMD Q408FinancialsAMD Q408Financials
AMD Q408Financials
 

More from finance7

sysco Return on Total Capital
sysco Return on Total Capitalsysco Return on Total Capital
sysco Return on Total Capitalfinance7
 
sysco Annual Reports2001
sysco Annual Reports2001sysco Annual Reports2001
sysco Annual Reports2001finance7
 
sysco Annual Reports2002
sysco Annual Reports2002sysco Annual Reports2002
sysco Annual Reports2002finance7
 
sysco Annual Reports2003
sysco Annual Reports2003sysco Annual Reports2003
sysco Annual Reports2003finance7
 
sysco Annual Reports2004
sysco Annual Reports2004sysco Annual Reports2004
sysco Annual Reports2004finance7
 
sysco Annual Reports2005
sysco Annual Reports2005sysco Annual Reports2005
sysco Annual Reports2005finance7
 
sysco Annual Reports2006
sysco Annual Reports2006sysco Annual Reports2006
sysco Annual Reports2006finance7
 
sysco Annual Reports2008
sysco Annual Reports2008sysco Annual Reports2008
sysco Annual Reports2008finance7
 
Summary of Reconciling Items 2001
Summary of Reconciling Items 2001Summary of Reconciling Items 2001
Summary of Reconciling Items 2001finance7
 
Regional Operating Income Bridge 2001
Regional Operating Income Bridge 2001Regional Operating Income Bridge 2001
Regional Operating Income Bridge 2001finance7
 
Net Income and EPS Bridge 2001
Net Income and EPS Bridge 2001Net Income and EPS Bridge 2001
Net Income and EPS Bridge 2001finance7
 
Summary of Reconciling Items 2002
Summary of Reconciling Items 2002Summary of Reconciling Items 2002
Summary of Reconciling Items 2002finance7
 
Regional Operating Income Bridge 2002
Regional Operating Income Bridge 2002Regional Operating Income Bridge 2002
Regional Operating Income Bridge 2002finance7
 
Net Income and EPS Bridge 2002
Net Income and EPS Bridge 2002Net Income and EPS Bridge 2002
Net Income and EPS Bridge 2002finance7
 
Summary of Reconciling Items 2003
Summary of Reconciling Items 2003Summary of Reconciling Items 2003
Summary of Reconciling Items 2003finance7
 
Regional Operating Income Bridge 2003
Regional Operating Income Bridge 2003Regional Operating Income Bridge 2003
Regional Operating Income Bridge 2003finance7
 
Net Income and EPS Bridge 2003
Net Income and EPS Bridge 2003Net Income and EPS Bridge 2003
Net Income and EPS Bridge 2003finance7
 
Summary of Reconciling Items 2004
Summary of Reconciling Items 2004Summary of Reconciling Items 2004
Summary of Reconciling Items 2004finance7
 
Regional Operating Income Bridge 2004
Regional Operating Income Bridge 2004Regional Operating Income Bridge 2004
Regional Operating Income Bridge 2004finance7
 
Net Income and EPS Bridge 2004
Net Income and EPS Bridge 2004Net Income and EPS Bridge 2004
Net Income and EPS Bridge 2004finance7
 

More from finance7 (20)

sysco Return on Total Capital
sysco Return on Total Capitalsysco Return on Total Capital
sysco Return on Total Capital
 
sysco Annual Reports2001
sysco Annual Reports2001sysco Annual Reports2001
sysco Annual Reports2001
 
sysco Annual Reports2002
sysco Annual Reports2002sysco Annual Reports2002
sysco Annual Reports2002
 
sysco Annual Reports2003
sysco Annual Reports2003sysco Annual Reports2003
sysco Annual Reports2003
 
sysco Annual Reports2004
sysco Annual Reports2004sysco Annual Reports2004
sysco Annual Reports2004
 
sysco Annual Reports2005
sysco Annual Reports2005sysco Annual Reports2005
sysco Annual Reports2005
 
sysco Annual Reports2006
sysco Annual Reports2006sysco Annual Reports2006
sysco Annual Reports2006
 
sysco Annual Reports2008
sysco Annual Reports2008sysco Annual Reports2008
sysco Annual Reports2008
 
Summary of Reconciling Items 2001
Summary of Reconciling Items 2001Summary of Reconciling Items 2001
Summary of Reconciling Items 2001
 
Regional Operating Income Bridge 2001
Regional Operating Income Bridge 2001Regional Operating Income Bridge 2001
Regional Operating Income Bridge 2001
 
Net Income and EPS Bridge 2001
Net Income and EPS Bridge 2001Net Income and EPS Bridge 2001
Net Income and EPS Bridge 2001
 
Summary of Reconciling Items 2002
Summary of Reconciling Items 2002Summary of Reconciling Items 2002
Summary of Reconciling Items 2002
 
Regional Operating Income Bridge 2002
Regional Operating Income Bridge 2002Regional Operating Income Bridge 2002
Regional Operating Income Bridge 2002
 
Net Income and EPS Bridge 2002
Net Income and EPS Bridge 2002Net Income and EPS Bridge 2002
Net Income and EPS Bridge 2002
 
Summary of Reconciling Items 2003
Summary of Reconciling Items 2003Summary of Reconciling Items 2003
Summary of Reconciling Items 2003
 
Regional Operating Income Bridge 2003
Regional Operating Income Bridge 2003Regional Operating Income Bridge 2003
Regional Operating Income Bridge 2003
 
Net Income and EPS Bridge 2003
Net Income and EPS Bridge 2003Net Income and EPS Bridge 2003
Net Income and EPS Bridge 2003
 
Summary of Reconciling Items 2004
Summary of Reconciling Items 2004Summary of Reconciling Items 2004
Summary of Reconciling Items 2004
 
Regional Operating Income Bridge 2004
Regional Operating Income Bridge 2004Regional Operating Income Bridge 2004
Regional Operating Income Bridge 2004
 
Net Income and EPS Bridge 2004
Net Income and EPS Bridge 2004Net Income and EPS Bridge 2004
Net Income and EPS Bridge 2004
 

Recently uploaded

Stock Market Brief Deck for "this does not happen often".pdf
Stock Market Brief Deck for "this does not happen often".pdfStock Market Brief Deck for "this does not happen often".pdf
Stock Market Brief Deck for "this does not happen often".pdfMichael Silva
 
Call Girls Service Nagpur Maya Call 7001035870 Meet With Nagpur Escorts
Call Girls Service Nagpur Maya Call 7001035870 Meet With Nagpur EscortsCall Girls Service Nagpur Maya Call 7001035870 Meet With Nagpur Escorts
Call Girls Service Nagpur Maya Call 7001035870 Meet With Nagpur Escortsranjana rawat
 
Instant Issue Debit Cards - High School Spirit
Instant Issue Debit Cards - High School SpiritInstant Issue Debit Cards - High School Spirit
Instant Issue Debit Cards - High School Spiritegoetzinger
 
VIP Call Girls LB Nagar ( Hyderabad ) Phone 8250192130 | ₹5k To 25k With Room...
VIP Call Girls LB Nagar ( Hyderabad ) Phone 8250192130 | ₹5k To 25k With Room...VIP Call Girls LB Nagar ( Hyderabad ) Phone 8250192130 | ₹5k To 25k With Room...
VIP Call Girls LB Nagar ( Hyderabad ) Phone 8250192130 | ₹5k To 25k With Room...Suhani Kapoor
 
Independent Lucknow Call Girls 8923113531WhatsApp Lucknow Call Girls make you...
Independent Lucknow Call Girls 8923113531WhatsApp Lucknow Call Girls make you...Independent Lucknow Call Girls 8923113531WhatsApp Lucknow Call Girls make you...
Independent Lucknow Call Girls 8923113531WhatsApp Lucknow Call Girls make you...makika9823
 
Log your LOA pain with Pension Lab's brilliant campaign
Log your LOA pain with Pension Lab's brilliant campaignLog your LOA pain with Pension Lab's brilliant campaign
Log your LOA pain with Pension Lab's brilliant campaignHenry Tapper
 
Quantitative Analysis of Retail Sector Companies
Quantitative Analysis of Retail Sector CompaniesQuantitative Analysis of Retail Sector Companies
Quantitative Analysis of Retail Sector Companiesprashantbhati354
 
Interimreport1 January–31 March2024 Elo Mutual Pension Insurance Company
Interimreport1 January–31 March2024 Elo Mutual Pension Insurance CompanyInterimreport1 January–31 March2024 Elo Mutual Pension Insurance Company
Interimreport1 January–31 March2024 Elo Mutual Pension Insurance CompanyTyöeläkeyhtiö Elo
 
Andheri Call Girls In 9825968104 Mumbai Hot Models
Andheri Call Girls In 9825968104 Mumbai Hot ModelsAndheri Call Girls In 9825968104 Mumbai Hot Models
Andheri Call Girls In 9825968104 Mumbai Hot Modelshematsharma006
 
Q3 2024 Earnings Conference Call and Webcast Slides
Q3 2024 Earnings Conference Call and Webcast SlidesQ3 2024 Earnings Conference Call and Webcast Slides
Q3 2024 Earnings Conference Call and Webcast SlidesMarketing847413
 
Financial institutions facilitate financing, economic transactions, issue fun...
Financial institutions facilitate financing, economic transactions, issue fun...Financial institutions facilitate financing, economic transactions, issue fun...
Financial institutions facilitate financing, economic transactions, issue fun...Avanish Goel
 
BPPG response - Options for Defined Benefit schemes - 19Apr24.pdf
BPPG response - Options for Defined Benefit schemes - 19Apr24.pdfBPPG response - Options for Defined Benefit schemes - 19Apr24.pdf
BPPG response - Options for Defined Benefit schemes - 19Apr24.pdfHenry Tapper
 
magnetic-pensions-a-new-blueprint-for-the-dc-landscape.pdf
magnetic-pensions-a-new-blueprint-for-the-dc-landscape.pdfmagnetic-pensions-a-new-blueprint-for-the-dc-landscape.pdf
magnetic-pensions-a-new-blueprint-for-the-dc-landscape.pdfHenry Tapper
 
Russian Call Girls In Gtb Nagar (Delhi) 9711199012 💋✔💕😘 Naughty Call Girls Se...
Russian Call Girls In Gtb Nagar (Delhi) 9711199012 💋✔💕😘 Naughty Call Girls Se...Russian Call Girls In Gtb Nagar (Delhi) 9711199012 💋✔💕😘 Naughty Call Girls Se...
Russian Call Girls In Gtb Nagar (Delhi) 9711199012 💋✔💕😘 Naughty Call Girls Se...shivangimorya083
 
Bladex Earnings Call Presentation 1Q2024
Bladex Earnings Call Presentation 1Q2024Bladex Earnings Call Presentation 1Q2024
Bladex Earnings Call Presentation 1Q2024Bladex
 
Monthly Market Risk Update: April 2024 [SlideShare]
Monthly Market Risk Update: April 2024 [SlideShare]Monthly Market Risk Update: April 2024 [SlideShare]
Monthly Market Risk Update: April 2024 [SlideShare]Commonwealth
 
VIP High Class Call Girls Saharanpur Anushka 8250192130 Independent Escort Se...
VIP High Class Call Girls Saharanpur Anushka 8250192130 Independent Escort Se...VIP High Class Call Girls Saharanpur Anushka 8250192130 Independent Escort Se...
VIP High Class Call Girls Saharanpur Anushka 8250192130 Independent Escort Se...Suhani Kapoor
 
Mulki Call Girls 7001305949 WhatsApp Number 24x7 Best Services
Mulki Call Girls 7001305949 WhatsApp Number 24x7 Best ServicesMulki Call Girls 7001305949 WhatsApp Number 24x7 Best Services
Mulki Call Girls 7001305949 WhatsApp Number 24x7 Best Servicesnajka9823
 
原版1:1复刻堪萨斯大学毕业证KU毕业证留信学历认证
原版1:1复刻堪萨斯大学毕业证KU毕业证留信学历认证原版1:1复刻堪萨斯大学毕业证KU毕业证留信学历认证
原版1:1复刻堪萨斯大学毕业证KU毕业证留信学历认证jdkhjh
 

Recently uploaded (20)

Stock Market Brief Deck for "this does not happen often".pdf
Stock Market Brief Deck for "this does not happen often".pdfStock Market Brief Deck for "this does not happen often".pdf
Stock Market Brief Deck for "this does not happen often".pdf
 
Call Girls Service Nagpur Maya Call 7001035870 Meet With Nagpur Escorts
Call Girls Service Nagpur Maya Call 7001035870 Meet With Nagpur EscortsCall Girls Service Nagpur Maya Call 7001035870 Meet With Nagpur Escorts
Call Girls Service Nagpur Maya Call 7001035870 Meet With Nagpur Escorts
 
Instant Issue Debit Cards - High School Spirit
Instant Issue Debit Cards - High School SpiritInstant Issue Debit Cards - High School Spirit
Instant Issue Debit Cards - High School Spirit
 
VIP Call Girls LB Nagar ( Hyderabad ) Phone 8250192130 | ₹5k To 25k With Room...
VIP Call Girls LB Nagar ( Hyderabad ) Phone 8250192130 | ₹5k To 25k With Room...VIP Call Girls LB Nagar ( Hyderabad ) Phone 8250192130 | ₹5k To 25k With Room...
VIP Call Girls LB Nagar ( Hyderabad ) Phone 8250192130 | ₹5k To 25k With Room...
 
Independent Lucknow Call Girls 8923113531WhatsApp Lucknow Call Girls make you...
Independent Lucknow Call Girls 8923113531WhatsApp Lucknow Call Girls make you...Independent Lucknow Call Girls 8923113531WhatsApp Lucknow Call Girls make you...
Independent Lucknow Call Girls 8923113531WhatsApp Lucknow Call Girls make you...
 
Commercial Bank Economic Capsule - April 2024
Commercial Bank Economic Capsule - April 2024Commercial Bank Economic Capsule - April 2024
Commercial Bank Economic Capsule - April 2024
 
Log your LOA pain with Pension Lab's brilliant campaign
Log your LOA pain with Pension Lab's brilliant campaignLog your LOA pain with Pension Lab's brilliant campaign
Log your LOA pain with Pension Lab's brilliant campaign
 
Quantitative Analysis of Retail Sector Companies
Quantitative Analysis of Retail Sector CompaniesQuantitative Analysis of Retail Sector Companies
Quantitative Analysis of Retail Sector Companies
 
Interimreport1 January–31 March2024 Elo Mutual Pension Insurance Company
Interimreport1 January–31 March2024 Elo Mutual Pension Insurance CompanyInterimreport1 January–31 March2024 Elo Mutual Pension Insurance Company
Interimreport1 January–31 March2024 Elo Mutual Pension Insurance Company
 
Andheri Call Girls In 9825968104 Mumbai Hot Models
Andheri Call Girls In 9825968104 Mumbai Hot ModelsAndheri Call Girls In 9825968104 Mumbai Hot Models
Andheri Call Girls In 9825968104 Mumbai Hot Models
 
Q3 2024 Earnings Conference Call and Webcast Slides
Q3 2024 Earnings Conference Call and Webcast SlidesQ3 2024 Earnings Conference Call and Webcast Slides
Q3 2024 Earnings Conference Call and Webcast Slides
 
Financial institutions facilitate financing, economic transactions, issue fun...
Financial institutions facilitate financing, economic transactions, issue fun...Financial institutions facilitate financing, economic transactions, issue fun...
Financial institutions facilitate financing, economic transactions, issue fun...
 
BPPG response - Options for Defined Benefit schemes - 19Apr24.pdf
BPPG response - Options for Defined Benefit schemes - 19Apr24.pdfBPPG response - Options for Defined Benefit schemes - 19Apr24.pdf
BPPG response - Options for Defined Benefit schemes - 19Apr24.pdf
 
magnetic-pensions-a-new-blueprint-for-the-dc-landscape.pdf
magnetic-pensions-a-new-blueprint-for-the-dc-landscape.pdfmagnetic-pensions-a-new-blueprint-for-the-dc-landscape.pdf
magnetic-pensions-a-new-blueprint-for-the-dc-landscape.pdf
 
Russian Call Girls In Gtb Nagar (Delhi) 9711199012 💋✔💕😘 Naughty Call Girls Se...
Russian Call Girls In Gtb Nagar (Delhi) 9711199012 💋✔💕😘 Naughty Call Girls Se...Russian Call Girls In Gtb Nagar (Delhi) 9711199012 💋✔💕😘 Naughty Call Girls Se...
Russian Call Girls In Gtb Nagar (Delhi) 9711199012 💋✔💕😘 Naughty Call Girls Se...
 
Bladex Earnings Call Presentation 1Q2024
Bladex Earnings Call Presentation 1Q2024Bladex Earnings Call Presentation 1Q2024
Bladex Earnings Call Presentation 1Q2024
 
Monthly Market Risk Update: April 2024 [SlideShare]
Monthly Market Risk Update: April 2024 [SlideShare]Monthly Market Risk Update: April 2024 [SlideShare]
Monthly Market Risk Update: April 2024 [SlideShare]
 
VIP High Class Call Girls Saharanpur Anushka 8250192130 Independent Escort Se...
VIP High Class Call Girls Saharanpur Anushka 8250192130 Independent Escort Se...VIP High Class Call Girls Saharanpur Anushka 8250192130 Independent Escort Se...
VIP High Class Call Girls Saharanpur Anushka 8250192130 Independent Escort Se...
 
Mulki Call Girls 7001305949 WhatsApp Number 24x7 Best Services
Mulki Call Girls 7001305949 WhatsApp Number 24x7 Best ServicesMulki Call Girls 7001305949 WhatsApp Number 24x7 Best Services
Mulki Call Girls 7001305949 WhatsApp Number 24x7 Best Services
 
原版1:1复刻堪萨斯大学毕业证KU毕业证留信学历认证
原版1:1复刻堪萨斯大学毕业证KU毕业证留信学历认证原版1:1复刻堪萨斯大学毕业证KU毕业证留信学历认证
原版1:1复刻堪萨斯大学毕业证KU毕业证留信学历认证
 

Q4 2003 Earnings Release Financial Tables

  • 1. Motorola, Inc. and Subsidiaries Consolidated Statements of Operations (In millions, except per share amounts) For the Quarter Ended December 31, 2003 Special Items Excluding Special GAAP Results Inc (Exp) Items Net sales $ 8,023 $ - $ 8,023 Costs of sales 5,372 (50) 5,322 Gross margin 2,651 (50) 2,701 Selling, general and administrative expenses 1,161 - 1,161 Research and development expenditures 932 - 932 Reorganization of businesses 21 (21) - Other charges (income) 17 (17) - Operating earnings 520 (88) 608 Other income(expense): Interest expense, net (59) - (59) Gains on sales of investments and businesses, net 306 306 - Other (21) (20) (1) Total other income (expense) 226 286 (60) Earnings before income taxes 746 198 548 Income tax expense 257 (118) 139 Net earnings $ 489 $ 80 $ 409 Earnings per common share Basic $ 0.21 $ 0.18 Diluted $ 0.20 $ 0.17 Weighted average common shares outstanding Basic 2,331.5 2,331.5 Diluted 2,457.4 2,457.4 Dividends paid per share $ 0.04 $ 0.04 For the Quarter Ended December 31, 2002 Special Items Excluding Special GAAP Results Inc(Exp) Items Net sales $ 7,697 $ - $ 7,697 Costs of sales 5,138 12 5,150 Gross margin 2,559 12 2,547 Selling, general and administrative expenses 1,082 - 1,082 Research and development expenditures 937 - 937 Reorganization of businesses 87 (87) - Other charges 6 (6) - Operating earnings 447 (81) 528 Other income (expense): Interest expense, net (56) - (56) Gains on sales of investments and businesses, net 24 24 - Other (135) (131) (4) Total other income (expense) (167) (107) (60) Earnings before income taxes 280 (188) 468 Income tax expense (benefit) 106 71 177 Net earnings (loss) $ 174 $ (117) $ 291 Earnings per common share Basic $ 0.08 $ 0.13 Diluted $ 0.08 $ 0.13 Weighted average common shares outstanding Basic 2,305.5 2,305.5 Diluted 2,322.0 2,322.0 Dividends paid per share $ 0.04 $ 0.04
  • 2. Motorola, Inc. and Subsidiaries Consolidated Statements of Operations (In millions, except per share amounts) For the Year Ended December 31, 2003 Special Items Excluding Special GAAP Results Inc (Exp) Items Net sales $ 27,058 $ - $ 27,058 Costs of sales 18,101 (38) 18,063 Gross margin 8,957 (38) 8,995 Selling, general and administrative expenses 4,073 - 4,073 Research and development expenditures 3,771 - 3,771 Reorganization of businesses 86 (86) - Other charges (income) (57) 57 - Operating earnings 1,084 (67) 1,151 Other income (expense): Interest expense, net (295) - (295) Gains on sales of investments and businesses, net 644 644 - Other (140) (100) (40) Total other income (expense) 209 544 (335) Earnings before income taxes 1,293 477 816 Income tax expense (benefit) 400 (165) 235 Net earnings $ 893 $ 312 $ 581 Earnings per common share Basic $ 0.38 $ 0.25 Diluted $ 0.38 $ 0.25 Weighted average common shares outstanding Basic 2,321.9 2,321.9 Diluted 2,351.2 2,351.2 Dividends paid per share $ 0.16 $ 0.16 For the Year Ended December 31, 2002 Special Items Excluding Special GAAP Results Inc (Exp) Items Net sales $ 27,279 $ - $ 27,279 Costs of sales 18,307 (56) 18,251 Gross margin 8,972 (56) 9,028 Selling, general and administrative expenses 4,472 12 4,484 Research and development expenditures 3,716 - 3,716 Reorganization of businesses 1,764 (1,764) - Other charges 833 (833) - Operating earnings (loss) (1,813) (2,641) 828 Other income (expense): Interest expense, net (356) - (356) Gains on sales of investments and businesses, net 96 96 - Other (1,373) (1,351) (22) Total other income (expense) (1,633) (1,255) (378) Loss before income taxes (3,446) (3,896) 450 Income tax expense (benefit) (961) 1,132 171 Net earnings (loss) $ (2,485) $ (2,764) $ 279 Earnings (loss) per common share Basic $ (1.09) $ 0.12 Diluted $ (1.09) $ 0.12 Weighted average common shares outstanding Basic 2,282.3 2,282.3 Diluted 2,282.3 2,282.3 Dividends paid per share $ 0.16 $ 0.16
  • 3. Motorola, Inc. and Subsidiaries Condensed Consolidated Balance Sheets (In millions) ASSETS December 31, December 31, 2003 2002 Cash and cash equivalents $ 7,877 $ 6,507 Short-term investments 139 59 Accounts receivable, net 4,436 4,437 Inventories, net 2,792 2,869 Deferred income taxes 1,678 2,358 Other current assets 985 904 Total current assets 17,907 17,134 Property, plant and equipment, net 5,164 6,104 Investments 3,335 2,053 Deferred income taxes 3,349 3,112 Other assets 2,343 2,749 Total assets $ 32,098 $ 31,152 LIABILITIES AND STOCKHOLDERS' EQUITY Notes payable and current portion of long-term debt $ 896 $ 1,629 Accounts payable 2,789 2,268 Accrued liabilities 5,748 5,913 Total current liabilities 9,433 9,810 Long-term debt 6,675 7,189 Other liabilities 2,815 2,429 Company-obligated mandatorily redeemable preferred securities of subsidiary trust holding solely company- guaranteed debentures (quot;TOPrSquot;) 486 485 Stockholders' equity 12,689 11,239 Total liabilities and stockholders' equity $ 32,098 $ 31,152
  • 4. Motorola, Inc. and Subsidiaries Segment Information (In millions) Summarized below are the Company's net sales by reportable segment for the quarters and years ended December 31, 2003 and December 31, 2002. Segment Net Sales GAAP Results Quarter Ended Quarter Ended December 31, December 31, % Change 2003 2002 from 2002 Personal Communications Segment $ 3,276 $ 3,369 -3% Semiconductor Products Segment 1,373 1,342 2% Global Telecom Solutions Segment 1,365 1,235 11% Commercial, Govt, and Industrial Solutions Segment 1,237 1,174 5% Integrated Electronic Systems Segment 669 570 17% Broadband Communications Segment 510 489 4% Other Products Segment 132 130 2% Adjustments & Eliminations (539) (612) -12% Segment Totals $ 8,023 $ 7,697 4% Segment Net Sales GAAP Results Year Ended Year Ended December 31, December 31, % Change 2003 2002 from 2002 Personal Communications Segment $ 10,978 $ 11,174 -2% Semiconductor Products Segment 4,864 5,000 -3% Global Telecom Solutions Segment 4,417 4,611 -4% Commercial, Govt, and Industrial Solutions Segment 4,131 3,749 10% Integrated Electronic Systems Segment 2,265 2,189 3% Broadband Communications Segment 1,745 2,087 -16% Other Products Segment 435 486 -10% Adjustments & Eliminations (1,777) (2,017) -12% Segment Totals $ 27,058 $ 27,279 -1%
  • 5. Motorola, Inc. and Subsidiaries Segment Information (In millions) Summarized below are the Company's operating earnings by reportable segment for the quarters ended December 31, 2003 and December 31, 2002. For the Quarter Ended December 31, 2003 Segment Operating Earnings (Loss) Special Items Excluding GAAP Results Inc (Exp) Special Items Personal Communications Segment $ 127 $ (52) $ 179 Semiconductor Products Segment 25 (26) 51 Global Telecom Solutions Segment 138 13 125 Commercial, Govt, and Industrial Solutions Segment 240 (7) 247 Integrated Electronic Systems Segment 66 (2) 68 Broadband Communications Segment (40) (75) 35 Other Products Segment (25) (2) (23) Adjustments & Eliminations (9) - (9) Segment Totals 522 (151) 673 General Corporate (2) 63 (65) Operating Earnings $ 520 $ (88) $ 608 For the Quarter Ended December 31, 2002 Segment Operating Earnings (Loss) Special Items Excluding GAAP Results Inc (Exp) Special Items Personal Communications Segment $ 294 $ (7) $ 301 Semiconductor Products Segment 18 11 7 Global Telecom Solutions Segment (22) (25) 3 Commercial, Govt, and Industrial Solutions Segment 189 21 168 Integrated Electronic Systems Segment 26 (5) 31 Broadband Communications Segment 33 (22) 55 Other Products Segment (39) - (39) Adjustments & Eliminations 12 - 12 Segment Totals 511 (27) 538 General Corporate (64) (54) (10) Operating Earnings $ 447 $ (81) $ 528
  • 6. Motorola, Inc. and Subsidiaries Segment Information (In millions) Summarized below are the Company's operating earnings (loss) by reportable segment for the years December 31, 2003 and December 31, 2002. For the Years Ended December 31, 2003 Segment Operating Earnings (Loss) Special Items Excluding GAAP Results Inc (Exp) Special Items Personal Communications Segment $ 479 $ (51) $ 530 Semiconductor Products Segment (297) (85) (212) Global Telecom Solutions Segment 247 13 234 Commercial, Govt, and Industrial Solutions Segment 562 (29) 591 Integrated Electronic Systems Segment 161 1 160 Broadband Communications Segment 48 (67) 115 Other Products Segment (130) (6) (124) Adjustments & Eliminations (19) - (19) Segment Totals 1,051 (224) 1,275 General Corporate 33 157 (124) Operating Earnings $ 1,084 $ (67) $ 1,151 For the Years Ended December 31, 2002 Segment Operating Earnings (Loss) Special Items Excluding GAAP Results Inc (Exp) Special Items Personal Communications Segment $ 503 $ (301) $ 804 Semiconductor Products Segment (1,515) (1,226) (289) Global Telecom Solutions Segment (621) (610) (11) Commercial, Govt, and Industrial Solutions Segment 313 (43) 356 Integrated Electronic Systems Segment 52 (58) 110 Broadband Communications Segment (150) (369) 219 Other Products Segment (280) (11) (269) Adjustments & Eliminations 24 - 24 Segment Totals (1,674) (2,618) 944 General Corporate (139) (23) (116) Operating Earnings (Loss) $ (1,813) $ (2,641) $ 828