How Automation is Driving Efficiency Through the Last Mile of Reporting
baxter international Q4/05PR
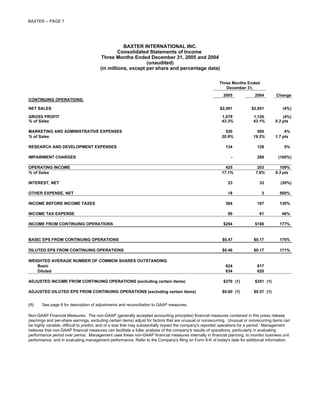
1. BAXTER -- PAGE 7
BAXTER INTERNATIONAL INC.
Consolidated Statements of Income
Three Months Ended December 31, 2005 and 2004
(unaudited)
(in millions, except per share and percentage data)
Three Months Ended
December 31,
2005 2004 Change
CONTINUING OPERATIONS:
NET SALES $2,491 $2,601 (4%)
GROSS PROFIT 1,079 1,120 (4%)
% of Sales 43.3% 43.1% 0.2 pts
MARKETING AND ADMINISTRATIVE EXPENSES 520 500 4%
% of Sales 20.9% 19.2% 1.7 pts
RESEARCH AND DEVELOPMENT EXPENSES 134 128 5%
IMPAIRMENT CHARGES - 289 (100%)
OPERATING INCOME 425 203 109%
% of Sales 17.1% 7.8% 9.3 pts
INTEREST, NET 23 33 (30%)
OTHER EXPENSE, NET 18 3 500%
INCOME BEFORE INCOME TAXES 384 167 130%
INCOME TAX EXPENSE 90 61 48%
INCOME FROM CONTINUING OPERATIONS $294 $106 177%
BASIC EPS FROM CONTINUING OPERATIONS $0.47 $0.17 176%
DILUTED EPS FROM CONTINUING OPERATIONS $0.46 $0.17 171%
WEIGHTED AVERAGE NUMBER OF COMMON SHARES OUTSTANDING
Basic 624 617
Diluted 634 620
ADJUSTED INCOME FROM CONTINUING OPERATIONS (excluding certain items) $379 (1) $351 (1)
ADJUSTED DILUTED EPS FROM CONTINUING OPERATIONS (excluding certain items) $0.60 (1) $0.57 (1)
(1) See page 8 for description of adjustments and reconciliation to GAAP measures.
Non-GAAP Financial Measures: The non-GAAP (generally accepted accounting principles) financial measures contained in this press release
(earnings and per-share earnings, excluding certain items) adjust for factors that are unusual or nonrecurring. Unusual or nonrecurring items can
be highly variable, difficult to predict, and of a size that may substantially impact the company's reported operations for a period. Management
believes that non-GAAP financial measures can facilitate a fuller analysis of the company's results of operations, particularly in evaluating
performance period over period. Management uses these non-GAAP financial measures internally in financial planning, to monitor business unit
performance, and in evaluating management performance. Refer to the Company's filing on Form 8-K of today's date for additional information.
2. BAXTER -- PAGE 8
BAXTER INTERNATIONAL, INC.
Consolidated Statements of Income
Three Months Ended December 31, 2005 and 2004
Description of Adjustments and Reconciliation of GAAP to Non-GAAP
(unaudited)
(in millions, except per share and percentage data)
2005 Description of adjustments and reconciliation of GAAP to Non-GAAP
As previously announced, the Company's 2005 GAAP results included certain charges related to infusion pumps, the exit of
hemodialysis instrument manufacturing, early debt retirement costs, and taxes on the repatriation of foreign earnings, which
impacted the GAAP results as follows:
Income Income Income from
before Tax Continuing
Income Taxes Expense Operations Diluted EPS
GAAP $384 $90 $294 $0.46
6060 infusion pump charge (A) 49 15 34 0.06
Hemodialysis instruments charge (A) 22 9 13 0.02
Early debt retirement costs (B) 17 7 10 0.02
Tax on repatriation of foreign earnings - (28) 28 0.04
Excluding specified items $472 $93 $379 $0.60
(A) Included in computing the Gross Profit line in the accompanying consolidated statement of income. Excluding
these items, which totaled $71 million, adjusted gross profit is $1.15 billion and the adjusted gross profit %
is 46.2%.
Included in Other Expense, Net line in the accompanying consolidated statement of income.
(B)
2004 Description of adjustments and reconciliation of GAAP to Non-GAAP
As previously announced, the Company's 2004 GAAP results included impairment charges which were recorded in the
Impairment Charges line and impacted the GAAP results as follows:
Income
Income Income from
before Tax Continuing
Income Taxes Expense Operations Diluted EPS
GAAP $167 $61 $106 $0.17
Impairment charges 289 44 245 0.40
Excluding specified items $456 $105 $351 $0.57
3. BAXTER -- PAGE 9
BAXTER INTERNATIONAL INC.
Consolidated Statements of Income
Twelve Months Ended December 31, 2005 and 2004
(unaudited)
(in millions, except per share and percentage data)
Twelve Months Ended
December 31,
2005 2004 Change
CONTINUING OPERATIONS:
NET SALES $9,849 $9,509 4%
GROSS PROFIT 4,093 3,915 5%
% of Sales 41.6% 41.2% 0.4 pts
MARKETING AND ADMINISTRATIVE EXPENSES 2,030 1,960 4%
% of Sales 20.6% 20.6% --
RESEARCH AND DEVELOPMENT EXPENSES 533 517 3%
RESTRUCTURING AND IMPAIRMENT CHARGES (109) 832 (113%)
OPERATING INCOME 1,639 606 170%
% of Sales 16.6% 6.4% 10.2 pts
INTEREST, NET 118 99 19%
OTHER EXPENSE, NET 77 77 -%
INCOME BEFORE INCOME TAXES 1,444 430 236%
INCOME TAX EXPENSE 486 47 934%
INCOME FROM CONTINUING OPERATIONS $958 $383 150%
BASIC EPS FROM CONTINUING OPERATIONS $1.54 $0.62 148%
DILUTED EPS FROM CONTINUING OPERATIONS $1.52 $0.62 145%
WEIGHTED AVERAGE NUMBER OF COMMON SHARES OUTSTANDING
Basic 622 614
Diluted 629 618
ADJUSTED INCOME FROM CONTINUING OPERATIONS (excluding certain items) $1,208 (1) $1,042 (1)
ADJUSTED DILUTED EPS FROM CONTINUING OPERATIONS (excluding certain items) $1.92 (1) $1.69 (1)
(1) See page 10 for description of adjustments and reconciliation to GAAP measures.
4. BAXTER -- PAGE 10
BAXTER INTERNATIONAL, INC.
Note to Consolidated Statements of Income
Twelve Months Ended December 31, 2005 and 2004
Description of Adjustments and Reconciliation of GAAP to Non-GAAP
(unaudited)
(in millions, except per share and percentage data)
2005 Description of adjustments and reconciliation of GAAP to Non-GAAP
As previously announced, the Company's 2005 GAAP results included certain charges related to infusion pumps, the exit of
hemodialysis instrument manufacturing, early debt retirement costs, taxes on the repatriation of foreign earnings, as well as
restructuring adjustments, which impacted the GAAP results as follows:
Income Income Income from
before Tax Continuing
Income Taxes Expense Operations Diluted EPS
GAAP $1,444 $486 $958 $1.52
6060 infusion pump charge (A) 49 15 34 0.06
COLLEAGUE infusion pump charge (A) 77 12 65 0.10
Hemodialysis instruments charge (A) 50 17 33 0.05
Early debt retirement costs (B) 17 7 10 0.02
Tax on repatriation of foreign earnings - (191) 191 0.30
Restructuring adjustments (C) (109) (26) (83) (0.13)
Excluding specified items $1,528 $320 $1,208 $1.92
(A) Included in computing the Gross Profit line in the accompanying consolidated statement of income. Excluding
these items, which totaled $176 million, adjusted gross profit is $4.27 billion and the adjusted gross profit %
is 43.3%.
Included in Other Expense, Net line in the accompanying consolidated statement of income.
(B)
Included in Restructuring and Impairment Charges line in the accompanying consolidated statement of income.
(C)
2004 Description of adjustments and reconciliation of GAAP to Non-GAAP
As previously announced, the Company's 2004 GAAP results included certain charges related to asset valuations, hedges,
restructuring and asset impairment charges, as well as tax audit adjustments, which impacted the GAAP results as follows:
Income Income Income from
before Tax Continuing
Income Taxes Expense Operations Diluted EPS
GAAP $430 $47 $383 $0.62
Inventory reserves (D ) 28 10 18 0.03
Loan and receivable reserves (E) 55 19 36 0.06
Excess cash flow hedges (D ) 17 6 11 0.02
Restructuring charge (F) 543 149 394 0.64
Impairment charges (F) 289 44 245 0.40
Pathogen Inactivation impairment charge 15 5 10 0.01
(G)
Tax audit adjustments - 55 (55) (0.09)
Excluding specified items $1,377 $335 $1,042 $1.69
Included in computing the Gross Profit line in the accompanying consolidated statement of income.
(D)
Included in Marketing and Administrative Expenses line in the accompanying consolidated statement of income.
(E)
Included in Restructuring and Impairment Charges line in the accompanying consolidated statement of income.
(F)
Included in Other Expense, Net line in the accompanying consolidated statement of income.
(G)
5. BAXTER -- PAGE 11
BAXTER INTERNATIONAL INC.
Cash Flows from Operations and Changes in Net Debt
(unaudited)
($ in millions)
Cash Flows from Operations
(Brackets denote cash outflows) Three Months Ended Twelve Months Ended
December 31, December 31,
2005 2004 2005 2004
Net income $292 $106 $956 $388
Adjustments
Depreciation and amortization 144 155 580 601
Deferred income taxes (17) 119 181 (141)
Restructuring and impairment charges - 289 (109) 832
Infusion pump and hemodialysis instrument charges 71 - 176 -
Other 4 (10) 57 149
Changes in balance sheet items
Receivables 45 14 178 (189)
Inventories 20 72 88 33
Accounts payable and accrued liabilities (18) 77 (305) (246)
Restructuring payments (22) (59) (117) (195)
Other (283) 80 (135) 148
Cash flows from operations $236 $843 $1,550 $1,380
Changes in Net Debt
Increase (decrease) Three Months Ended Twelve Months Ended
December 31, December 31,
2005 2004 2005 2004
Net debt, beginning of period $2,650 $3,767 $3,185 $3,649
Cash flows from operations (236) (843) (1,550) (1,380)
Capital expenditures 165 195 444 558
Dividends - - 359 361
Acquisitions, net 33 - 47 20
Purchases of treasury stock - - - 18
Other, including the effect of exchange rate changes (115) 66 12 (41)
Decrease in net debt (153) (582) (688) (464)
Net debt, December 31 $2,497 $3,185 $2,497 $3,185
Key statistics, December 31:
Days sales outstanding 55.1 55.3 55.1 55.3
Inventory turns 2.6 2.7 2.6 2.7
Net-debt-to-capital ratio (A) 36.7% 33.5% 36.7% 33.5%
(A) The 2004 net-debt-to-capital ratio was calculated in accordance with the company's primary credit agreements, which gave 70% equity credit to the company's
December 2002 $1.25 billion issuance of equity units. As originally scheduled, in November 2005, the $1.25 billion senior notes included in the equity units were
remarketed, and the company repurchased $1 billion of the remarketed notes. In February 2006, the purchase contracts included in the equity units will mature, and
the company will receive $1.25 billion in cash and issue between 35.0 to 43.4 million common shares, based on a specified exchange ratio (if the average price of the
company's stock over the 20-day trading period ending on February 13th exceeds $35.69, then 35 million shares will be issued). Management plans to use a portion
of the cash proceeds to pay down maturing debt. As a result of these cash proceeds, the company's net-debt-to-capital ratio will decrease significantly during the first
quarter of 2006. Holding all other variables constant, the February 2006 $1.25 billion cash proceeds would reduce the net-debt-to-capital ratio at December 31, 2005
by 18.4 percentage points, from 36.7% to 18.3%.
6. BAXTER -- PAGE 12
BAXTER INTERNATIONAL INC.
Condensed Consolidated Balance Sheets
(unaudited)
($ in millions)
December 31, December 31,
2005 2004
ASSETS
Cash and equivalents $841 $1,109
Receivables 1,766 2,091
Inventories 1,925 2,135
Other current assets (1) 584 684
Total current assets 5,116 6,019
Property, plant and equipment, net 4,144 4,369
Other long-term assets (1) 3,467 3,759
Total assets $12,727 $14,147
LIABILITIES AND SHAREHOLDERS' EQUITY
Short-term debt (2) $924 $361
Other current liabilities (1) 3,284 3,925
Long-term debt 2,414 3,933
Other long-term liabilities (1) 1,806 2,223
Shareholders' equity 4,299 3,705
Total liabilities and shareholders' equity $ 12,727 $ 14,147
(1) The following is a summary of the company's cross-currency swap assets (liabilities).
December 31, December 31,
2005 2004
Original swaps
$ - ($465)
Other current liabilities
(546) (831)
Other long-term liabilities
(546) (1,296)
Total
Mirror swaps
- 109
Other current assets
- 20
Other long-term assets
(99) (5)
Other long-term liabilities
(99) 124
Total
($645) ($1,172)
Net total of cross-currency swaps
Note: As further discussed in the company's SEC filings, during the fourth quarter of
2004 the company executed offsetting or mirror swaps. These mirror swaps fix the
net amount the company will ultimately pay to settle the swaps subject to this strategy.
After execution of the mirror swaps, as the market value of the fixed portion of the
original portfolio decreases, the market value of the mirror swaps increases, and
vice versa. At December 31, 2005, approximately 52% of the net swaps liability has been
fixed by the mirror swaps.
During the year ended December 31, 2005, the company settled certain swap
agreements (and related mirror swaps, as applicable), and made net payments totaling
$379 million. In accordance with GAAP, $432 million of outflows were classified in the financing
section of the statement of cash flows, and $53 million of inflows were classified in the
operating section of the statement of cash flows.
(2) The increase in short-term debt from December 31, 2004 to December 31, 2005 principally
related to the reclassification of approximately $800 million of notes due in 2006 from
long-term to short-term.
7. BAXTER -- PAGE 13
Baxter International Inc.
Net Sales from Continuing Operations
Period Ending December 31, 2005
(unaudited)
% Growth @ % Growth @ % Growth @ % Growth @
Q4 Q4 YTD YTD
Actual Rates Constant Rates Actual Rates Constant Rates
($ in millions) 2005 2004 2005 2004
BioScience
United States $479 $448 7% 7% $1,764 $1,644 7% 7%
International 531 504 5% 9% 2,088 1,860 12% 10%
Total $1,010 $952 6% 8% $3,852 $3,504 10% 9%
Medication Delivery
United States $532 $694 (23%) (23%) $2,234 $2,410 (7%) (7%)
International 440 435 1% 3% 1,756 1,637 7% 4%
Total $972 $1,129 (14%) (13%) $3,990 $4,047 (1%) (3%)
Renal
United States $96 $103 (7%) (7%) $385 $406 (5%) (5%)
International 413 417 (1%) -% 1,622 1,552 5% 1%
Total $509 $520 (2%) (2%) $2,007 $1,958 3% -%
Baxter International Inc.
United States $1,107 $1,245 (11%) (11%) $4,383 $4,460 (2%) (2%)
International 1,384 1,356 2% 4% 5,466 5,049 8% 5%
Total $2,491 $2,601 (4%) (3%) $9,849 $9,509 4% 2%
8. BAXTER -- PAGE 14
Baxter International Inc.
Key Product Line Sales
Period Ending December 31, 2005
(unaudited)
Q4 Q4 % Growth @ % Growth @ YTD YTD % Growth @ % Growth @
($ in millions) 2005 2004 Actual Rates Constant Rates 2005 2004 Actual Rates Constant Rates
BioScience
Recombinants $394 $376 5% 8% $1,527 $1,329 15% 14%
1
Plasma Proteins 256 278 (8%) (7%) 1,023 1,037 (1%) (3%)
Antibody Therapy 147 84 75% 79% 452 336 35% 34%
Transfusion Therapies 140 150 (7%) (5%) 547 550 (1%) (2%)
Other 2 73 64 14% 16% 303 252 20% 18%
Total BioScience $1,010 $952 6% 8% $3,852 $3,504 10% 9%
Medication Delivery
IV Therapies 3 $316 $309 2% 3% $1,225 $1,154 6% 4%
Drug Delivery 196 252 (22%) (22%) 818 840 (3%) (3%)
Infusion Systems 194 259 (25%) (25%) 853 928 (8%) (9%)
Anesthesia 249 288 (14%) (13%) 1,021 1,037 (2%) (2%)
4
Other 17 21 (19%) (19%) 73 88 (17%) (19%)
5
Total Medication Delivery $972 $1,129 (14%) (13%) $3,990 $4,047 (1%) (3%)
Renal
PD Therapy $394 $382 3% 4% $1,534 $1,445 6% 4%
HD Therapy 109 134 (19%) (19%) 454 499 (9%) (12%)
Other 6 4 50% 50% 19 14 36% 36%
Total Renal $509 $520 (2%) (2%) $2,007 $1,958 3% -%
TOTAL BAXTER $2,491 $2,601 (4%) (3%) $9,849 $9,509 4% 2%
1
Includes plasma-derived hemophilia (FVII, FVIII, FIX and FEIBA), albumin, biosurgery (Tisseel) and other plasma-based products.
2
Principally includes vaccines and non-plasma-based biosurgery products (FloSeal & CoSeal).
3
Principally includes intravenous solutions and nutritional products.
4
Principally includes other hospital-distributed products.
5
Sales of oncology products, which were previously included in Other, are now reported in Drug Delivery, Infusion
Systems or Anesthesia, depending on the product. All prior year sales data has been reclassified to reflect this change.
9. BAXTER -- PAGE 15
Baxter International Inc.
Key Product Line Sales -- US/International
Period Ending December 31, 2005
(unaudited)
Q4 2005 Q4 2004 % Growth
($ in millions) US International Total US International Total US International Total
BioScience
Recombinants $168 $226 $394 $173 $203 $376 (3%) 11% 5%
1
Plasma Proteins 113 143 $256 118 160 278 (4%) (11%) (8%)
Antibody Therapy 103 44 $147 46 38 84 124% 16% 75%
Transfusion Therapies 67 73 $140 76 74 150 (12%) (1%) (7%)
2
Other 28 45 $73 35 29 64 (20%) 55% 14%
Total BioScience $479 $531 $1,010 $448 $504 $952 7% 5% 6%
Medication Delivery
3
IV Therapies $109 $207 $316 $104 $205 $309 5% 1% 2%
Drug Delivery 128 68 196 186 66 252 (31%) 3% (22%)
Infusion Systems 123 71 194 184 75 259 (33%) (5%) (25%)
Anesthesia 166 83 249 214 74 288 (22%) 12% (14%)
4
Other 6 11 17 6 15 21 -% (27%) (19%)
5
Total Medication Delivery $532 $440 $972 $694 $435 $1,129 (23%) 1% (14%)
Renal
PD Therapy $62 $332 $394 $65 $317 $382 (5%) 5% 3%
HD Therapy 31 78 109 35 99 134 (11%) (21%) (19%)
Other 3 3 6 3 1 4 -% 200% 50%
Total Renal $96 $413 $509 $103 $417 $520 (7%) (1%) (2%)
TOTAL BAXTER $1,107 $1,384 $2,491 $1,245 $1,356 $2,601 (11%) 2% (4%)
1
Includes plasma-derived hemophilia (FVII, FVIII, FIX and FEIBA), albumin, biosurgery (Tisseel) and other plasma-based products.
2
Principally includes vaccines and non-plasma-based biosurgery products (FloSeal & CoSeal).
3
Principally includes intravenous solutions and nutritional products.
4
Principally includes other hospital-distributed products.
5
Sales of oncology products, which were previously included in Other, are now reported in Drug Delivery, Infusion
Systems or Anesthesia, depending on the product. All prior year sales data has been reclassified to reflect this change.