17
CPU Elapsd Old
BufferGets Executions Gets per Exec %Total Time (s) Time (s) Hash Value
--------------- ------------ -------------- ------ -------- --------- ----------
10,074 67 150.4 31.6 0.11 0.08 335360792
select file#, block#, blocks from seg$ where type# = 3 and ts# =
:1
3,808 685 5.6 12.0 0.02 0.01 2482976222
select intcol#,nvl(pos#,0),col#,nvl(spare1,0) from ccol$ where c
on#=:1
1,294 1 1,294.0 4.1 0.09 0.38 2522684317
Module: SQL*Plus
BEGIN statspack.snap; END;
少しクセのあるデータ
基本固定長データなのは同じ
だけど空行区切りの、複数行構成
数字行を開始ともみなせる
でもModule:の行があったりなかったり…
30
def parse_main(self):
:
for linein self.lines:
# ---- --- 的なのが出たら取得開始
if re.search(sep_str, line):
val_flg = True
# ---- --- を[0,4,8..]的に変換
sep_posit_list = self.get_splited_position(line)
continue
# ---- --- 的なのがでるまで無視
if not val_flg:
continue
# データ部分を[0,4,8..]的な位置で分割しながら格納
line_row_list.append(self.split_str_by_posit(line, sep_posit_list))
31.
31
CPU Elapsd Old
BufferGets Executions Gets per Exec %Total Time (s) Time (s) Hash Value
--------------- ------------ -------------- ------ -------- --------- ----------
10,074 67 150.4 31.6 0.11 0.08 335360792
select file#, block#, blocks from seg$ where type# = 3 and ts# =
:1
3,808 685 5.6 12.0 0.02 0.01 2482976222
select intcol#,nvl(pos#,0),col#,nvl(spare1,0) from ccol$ where c
on#=:1
1,294 1 1,294.0 4.1 0.09 0.38 2522684317
Module: SQL*Plus
BEGIN statspack.snap; END;
少しクセのあるデータ
基本固定長データなのは同じ
だけど空行区切りの、複数行構成
数字行を開始ともみなせる
でもModule:の行があったりなかったり…
41
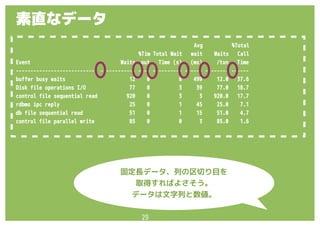
Foreground Wait EventsDB/Inst: ORCL/ORCL1 Snaps: 32987-32988
-> Only events with Total Wait Time (s) >= .001 are shown
-> ordered by Total Wait Time desc, Waits desc (idle events last)
Avg %Total
%Tim Total Wait wait Waits Call
Event Waits out Time (s) (ms) /txn Time
---------------------------- ------------ ---- ---------- ------ -------- ------
db file sequential read 281,434 0 5,788 21 0.4 37.5
direct path read 14,550 0 1,005 69 0.0 6.5
enq: TX - index contention 168 0 627 3735 0.0 4.1
:
:
Foreground Wait Events DB/Inst: ORCL/ORCL1 Snaps: 32987-32988
-> Only events with Total Wait Time (s) >= .001 are shown
-> ordered by Total Wait Time desc, Waits desc (idle events last)
Avg %Total
%Tim Total Wait wait Waits Call
Event Waits out Time (s) (ms) /txn Time
---------------------------- ------------ ---- ---------- ------ -------- ------
KJC: Wait for msg sends to c 776 0 0 0 0.0 .0
なんかヘッダが何回もでる


![30
def parse_main(self):
:
for line in self.lines:
# ---- --- 的なのが出たら取得開始
if re.search(sep_str, line):
val_flg = True
# ---- --- を[0,4,8..]的に変換
sep_posit_list = self.get_splited_position(line)
continue
# ---- --- 的なのがでるまで無視
if not val_flg:
continue
# データ部分を[0,4,8..]的な位置で分割しながら格納
line_row_list.append(self.split_str_by_posit(line, sep_posit_list))](https://image.slidesharecdn.com/20150912pyconshare-150912083311-lva1-app6892/85/Python-JSON-PyCon-mini-sapporo-2015-30-320.jpg)

![32
def parse_main(self):
:
for line in self.lines:
:
# カンマ、空白、小数点を除いた後、数値だけの行か
# データのブロックの開始判定
if self.is_only_int_line(line):
# SQL文の行ではないのでフラグを初期化
sql_l_flg = False
:
# 文字列バッファの初期化
sql_str = u""
buf_str = u""
# 数値データは、固定長なので通常通り区切って格納
row_list.append(self.split_str_by_posit(line, sep_posit_list))
# モジュール名の行を取得
elif re.search(u"Module:s.+", line):
row_list[-1].append(line.strip()[8:])
# 以降の行はSQL文
sql_l_flg = True
elif sql_l_flg:
sql_str += line.strip()
else:
buf_str += line.strip()](https://image.slidesharecdn.com/20150912pyconshare-150912083311-lva1-app6892/85/Python-JSON-PyCon-mini-sapporo-2015-32-320.jpg)


![37
import unittest
import StatspackParser
import sys
# とりあえず対象のレポートを渡したかった
FILE_NAME= sys.argv[1]
class LogicTest(unittest.TestCase):
def setUp(self):
self.file_name = FILE_NAME
def test_parse(self):
sp = StatspackParser(self.file_name)
parsed_data = sp.do_parse()
# テストファイルの該当セクション最後のSQLをチェック
self.assertEqual(parsed_data["SQL_ordered_by_Gets"][-1]["SQL_TEXT"], "select * from emp")
# その他もろもろ
:
if __name__ == '__main__':
# unittest自体の引数ではないので消す
del sys.argv[1]
unittest.main()](https://image.slidesharecdn.com/20150912pyconshare-150912083311-lva1-app6892/85/Python-JSON-PyCon-mini-sapporo-2015-37-320.jpg)


![44
def parse_date(self, date_string):
# 見つけたフォーマットを全部いれておく
formats = [
u"%d-%m月 %H:%M:%S",
u"%d-%m月 %H:%M",
u"%d-%m月-%y %H:%M", # like 24-12月-14 07:35
:
u"%d-%m? %H:%M", # like 24-12月-14 07:35
u"%d-%m? %H:%M:%S", # like 24-12月-14 07:35
]
# パース出来るまで頑張る
for format_pat in formats:
try:
# unicodeでできないのでstrにする
ret = datetime.datetime.strptime(date_string.encode(self.encode),
format_pat.encode(self.encode))
break
except ValueError:
pass
else:
# 全滅なら投げといて、後でフォーマットを追加する
raise NoMatchDateFormatException(date_string.encode(self.encode))
return ret
手当たりしだい試すことにした](https://image.slidesharecdn.com/20150912pyconshare-150912083311-lva1-app6892/85/Python-JSON-PyCon-mini-sapporo-2015-44-320.jpg)


![48
処理失敗時パーサを切り替える事にした
retry_flag = True
while retry_flag:
try:
# 解析したディクショナリを取得する
parser_inst.reformat()
result_dict = parser_inst.parse_main()
if result_dict:
if len(result_dict.values()[0]) > 0:
return_dict["PARSED_DATA"][result_dict.keys()[0]] = result_
# 処理は成功しているがデータがとれていない
else:
raise NoValidDataException(parser_inst)
# ここまできたらリトライしない
retry_flag = False
# バージョン差異でパースエラーになる可能性はある
except (IndexError, NoMatchDateFormatException, NoValidDataException):
try:
# 予備のパーサを取得してリトライ
parser_inst = parser_inst.get_sub_parser_inst()
except NoSubParserException as e:
# 予備のパーサが出尽くした
retry_flag = False](https://image.slidesharecdn.com/20150912pyconshare-150912083311-lva1-app6892/85/Python-JSON-PyCon-mini-sapporo-2015-48-320.jpg)


![[data analytics showcase] B12: サーバー1,000台を監視するということ by 株式会社インサイトテクノロジー 小幡 一郎](https://cdn.slidesharecdn.com/ss_thumbnails/zwxv3e5eq2onvtifzkda-signature-1379033641429794afbc9d6c48d9c7cc5945545725d7bf5772715883640ebcaa-poli-161011071522-thumbnail.jpg?width=640&height=640&fit=bounds)


![Introduction to Numpy (and Python) [JPN]](https://cdn.slidesharecdn.com/ss_thumbnails/numpy-190327123214-thumbnail.jpg?width=640&height=640&fit=bounds)