Copyright (C) 2013CO-Sol Inc. All Rights Reserved
このセッションの概要
Oracle Databaseは極めて品質の高いデータベースソフトウェアで
す。
しかし、極めて稀なことではありますが、OS/ハードウェアなどの外的な
要因やBugにより、ハングに類似した状況が発生することがあります。
Oracle Databaseには多くの優れた診断機能があるため、このよう
な状況においても問題の特定や絞り込みができます。また、OSの診
断機能も有効な場合があります。
本セッションでは、これらの診断機能を活用してハング事象を分析す
る方法について説明します。
あるハング事象を調査する流れに沿ったボトムアップアプローチでの説
明を試みます。
都度調査に必要な知識を説明
22
4.
Copyright (C) 2013CO-Sol Inc. All Rights Reserved
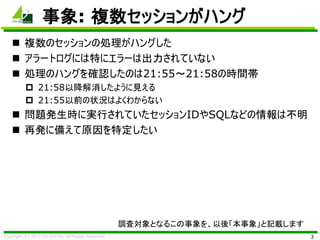
事象: 複数セッションがハング
複数のセッションの処理がハングした
アラートログには特にエラーは出力されていない
処理のハングを確認したのは21:55~21:58の時間帯
21:58以降解消したように見える
21:55以前の状況はよくわからない
問題発生時に実行されていたセッションIDやSQLなどの情報は不明
再発に備えて原因を特定したい
3
調査対象となるこの事象を、以後「本事象」と記載します
5.
Copyright (C) 2013CO-Sol Inc. All Rights Reserved
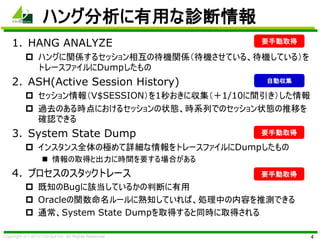
ハング分析に有用な診断情報
1. HANG ANALYZE
ハングに関係するセッション相互の待機関係(待機させている、待機している)を
トレースファイルにDumpしたもの
2. ASH(Active Session History)
セッション情報(V$SESSION)を1秒おきに収集(+1/10に間引き)した情報
過去のある時点におけるセッションの状態、時系列でのセッション状態の推移を
確認できる
3. System State Dump
インスタンス全体の極めて詳細な情報をトレースファイルにDumpしたもの
情報の取得と出力に時間を要する場合がある
4. プロセスのスタックトレース
既知のBugに該当しているかの判断に有用
Oracleの関数命名ルールに熟知していれば、処理中の内容を推測できる
通常、System State Dumpを取得すると同時に取得される
4
要手動取得
要手動取得
自動収集
要手動取得
6.
Copyright (C) 2013CO-Sol Inc. All Rights Reserved
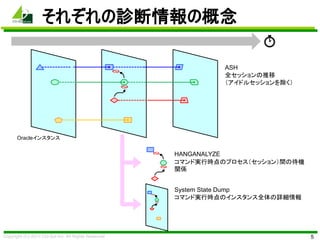
それぞれの診断情報の概念
55
HANGANALYZE
コマンド実行時点のプロセス(セッション)間の待機
関係
System State Dump
コマンド実行時点のインスタンス全体の詳細情報
ASH
全セッションの推移
(アイドルセッションを除く)
Oracleインスタンス
Copyright (C) 2013CO-Sol Inc. All Rights Reserved
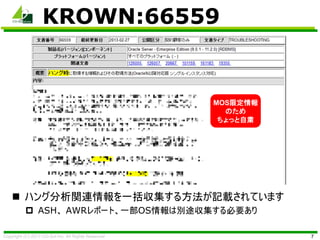
KROWN:66559
7
ハング分析関連情報を一括収集する方法が記載されています
ASH、 AWRレポート、一部OS情報は別途収集する必要あり
MOS限定情報
のため
ちょっと自粛
9.
Copyright (C) 2013CO-Sol Inc. All Rights Reserved
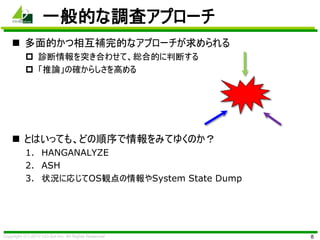
一般的な調査アプローチ
多面的かつ相互補完的なアプローチが求められる
診断情報を突き合わせて、総合的に判断する
「推論」の確からしさを高める
とはいっても、どの順序で情報をみてゆくのか?
1. HANGANALYZE
2. ASH
3. 状況に応じてOS観点の情報やSystem State Dump
8
10.
Copyright (C) 2013CO-Sol Inc. All Rights Reserved
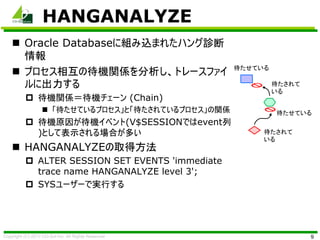
HANGANALYZE
Oracle Databaseに組み込まれたハング診断
情報
プロセス相互の待機関係を分析し、トレースファイ
ルに出力する
待機関係=待機チェーン (Chain)
「待たせているプロセス」と「待たされているプロセス」の関係
待機原因が待機イベント(V$SESSIONではevent列
)として表示される場合が多い
HANGANALYZEの取得方法
ALTER SESSION SET EVENTS 'immediate
trace name HANGANALYZE level 3';
SYSユーザーで実行する
9
待たせている
待たされて
いる
待たせている
待たされて
いる
11.
Copyright (C) 2013CO-Sol Inc. All Rights Reserved
HANGANALYZEの出力例
10
*** 2013-05-27 21:55:52.883
===============================================================================
HANG ANALYSIS:
(略)
===============================================================================
Chains most likely to have caused the hang:
[a] Chain 1 Signature: 'log file parallel write'<='log buffer space'<='buffer busy waits'
Chain 1 Signature Hash: 0xf27e57e2
[b] Chain 2 Signature: 'log file parallel write'<='log buffer space'
Chain 2 Signature Hash: 0x56c5cf5
[c] Chain 3 Signature: 'log file parallel write'<='log buffer space'<='latch: In memory undo latch'
Chain 3 Signature Hash: 0x1d6eb75b
===============================================================================
Non-intersecting chains:
-------------------------------------------------------------------------------
Chain 1:
-------------------------------------------------------------------------------
Oracle session identified by:
{
instance: 1 (b203.b203)
os id: 5860
process id: 15, oracle@l64rw3.domain (MMON)
session id: 15
session serial #: 1
}
is waiting for 'buffer busy waits' with wait info:
{
p1: 'file#'=0x3
p2: 'block#'=0x80
p3: 'class#'=0x11
time in wait: 52.137595 sec
インスタンス内の全待機
チェーンからの抜粋
1番目の待機チェーンの待機
関係を表示
12.
Copyright (C) 2013CO-Sol Inc. All Rights Reserved
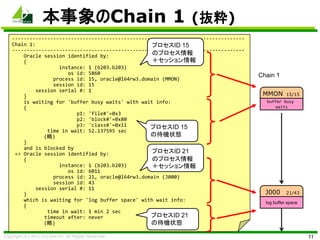
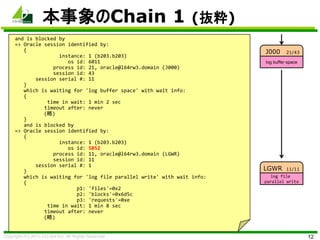
本事象のChain 1 (抜粋)
11
-------------------------------------------------------------------------------
Chain 1:
-------------------------------------------------------------------------------
Oracle session identified by:
{
instance: 1 (b203.b203)
os id: 5860
process id: 15, oracle@l64rw3.domain (MMON)
session id: 15
session serial #: 1
}
is waiting for 'buffer busy waits' with wait info:
{
p1: 'file#'=0x3
p2: 'block#'=0x80
p3: 'class#'=0x11
time in wait: 52.137595 sec
(略)
}
and is blocked by
=> Oracle session identified by:
{
instance: 1 (b203.b203)
os id: 6011
process id: 21, oracle@l64rw3.domain (J000)
session id: 43
session serial #: 11
}
which is waiting for 'log buffer space' with wait info:
{
time in wait: 1 min 2 sec
timeout after: never
(略)
J000 21/43
'enq: CF -
contention'
log buffer space
MMON 15/15
'enq: CF -
contention'
buffer busy
waits
プロセスID 15
のプロセス情報
+セッション情報
プロセスID 15
の待機状態
Chain 1
プロセスID 21
のプロセス情報
+セッション情報
プロセスID 21
の待機状態
13.
Copyright (C) 2013CO-Sol Inc. All Rights Reserved
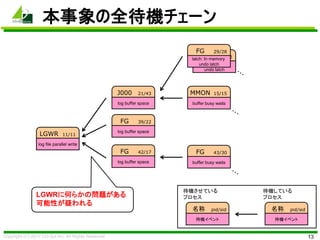
本事象のChain 1 (抜粋)
12
and is blocked by
=> Oracle session identified by:
{
instance: 1 (b203.b203)
os id: 6011
process id: 21, oracle@l64rw3.domain (J000)
session id: 43
session serial #: 11
}
which is waiting for 'log buffer space' with wait info:
{
time in wait: 1 min 2 sec
timeout after: never
(略)
}
and is blocked by
=> Oracle session identified by:
{
instance: 1 (b203.b203)
os id: 5852
process id: 11, oracle@l64rw3.domain (LGWR)
session id: 11
session serial #: 1
}
which is waiting for 'log file parallel write' with wait info:
{
p1: 'files'=0x2
p2: 'blocks'=0x6d5c
p3: 'requests'=0xe
time in wait: 1 min 8 sec
timeout after: never
(略)
J000 21/43
'enq: CF -
contention'
log buffer space
LGWR 11/11
'enq: CF -
contention'
log file
parallel write
Copyright (C) 2013CO-Sol Inc. All Rights Reserved
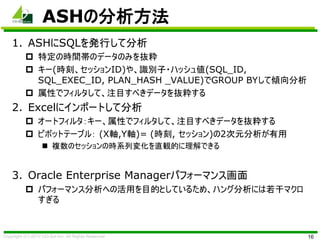
ASH分析用SQLの例
1. 事象発生時間帯を抽出
2. セッション数の推移をみる(1分単位)
17
SELECT … FROM DBA_HIST_ACTIVE_SESS_HISTORY
WHERE sample_time BETWEEN
to_timestamp('&start_time', 'yyyy-mm-dd HH24:mi:ss')
AND to_timestamp('&end_time', 'yyyy-mm-dd HH24:mi:ss')
SELECT to_char(sample_time, 'yyyy-mm-dd HH24:mi')
, count(distinct session_id)
FROM DBA_HIST_ACTIVE_SESS_HISTORY
WHERE sample_time between
to_timestamp('&start_time', 'yyyy-mm-dd HH24:mi:ss')
AND to_timestamp('&end_time', 'yyyy-mm-dd HH24:mi:ss')
GROUP BY to_char(sample_time, 'yyyy-mm-dd HH24:mi')
ORDER BY to_char(sample_time, 'yyyy-mm-dd HH24:mi');
19.
Copyright (C) 2013CO-Sol Inc. All Rights Reserved
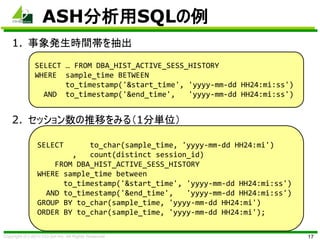
ASH分析用SQLの例
3. 長時間実行SQL上位30件を抽出
4. 3. で特定したSQLを実行していたセッションを抽出
18
SELECT * FROM (
SELECT sql_id, sql_exec_id
, min(sample_time) , max(sample_time)
, max(sample_time) - min(sample_time) exec_time
FROM DBA_HIST_ACTIVE_SESSION_HISTORY
GROUP BY sql_id, sql_exec_id
ORDER BY exec_time desc
) WHERE rownum <=30;
SELECT session_id, session_serial#
, min(sample_time),max(sample_time)
FROM DBA_HIST_ACTIVE_SESSION_HISTORY
WHERE sql_id='<sql_id>'
GROUP BY session_id, session_serial#;
参考) http://co-sol.jp/techdb/2013/05/oracle_database_11g_ash_enhancements_sql_exec_id.html
20.
Copyright (C) 2013CO-Sol Inc. All Rights Reserved
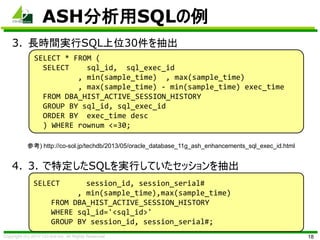
ピボットテーブルによるASH分析
19
ピボットテーブルの作成方法については
http://co-sol.jp/techdb/2013/05/analyze_ash_by_excel_db_tech_showcase_osaka_2013.html
21.
Copyright (C) 2013CO-Sol Inc. All Rights Reserved
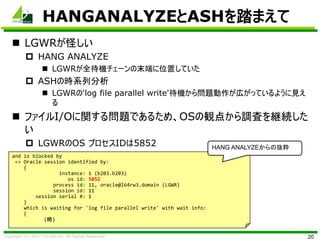
HANGANALYZEとASHを踏まえて
LGWRが怪しい
HANG ANALYZE
LGWRが全待機チェーンの末端に位置していた
ASHの時系列分析
LGWRの'log file parallel write'待機から問題動作が広がっているように見え
る
ファイルI/Oに関する問題であるため、OSの観点から調査を継続した
い
LGWRのOS プロセスIDは5852
20
and is blocked by
=> Oracle session identified by:
{
instance: 1 (b203.b203)
os id: 5852
process id: 11, oracle@l64rw3.domain (LGWR)
session id: 11
session serial #: 1
}
which is waiting for 'log file parallel write' with wait info:
{
(略)
HANG ANALYZEからの抜粋
22.
Copyright (C) 2013CO-Sol Inc. All Rights Reserved
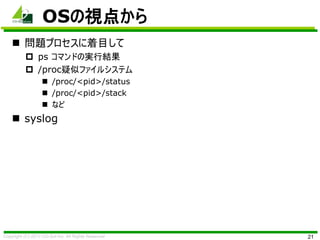
OSの視点から
問題プロセスに着目して
ps コマンドの実行結果
/proc疑似ファイルシステム
/proc/<pid>/status
/proc/<pid>/stack
など
syslog
21

![Copyright (C) 2013 CO-Sol Inc. All Rights Reserved
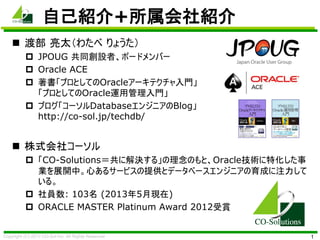
HANGANALYZEの出力例
10
*** 2013-05-27 21:55:52.883
===============================================================================
HANG ANALYSIS:
(略)
===============================================================================
Chains most likely to have caused the hang:
[a] Chain 1 Signature: 'log file parallel write'<='log buffer space'<='buffer busy waits'
Chain 1 Signature Hash: 0xf27e57e2
[b] Chain 2 Signature: 'log file parallel write'<='log buffer space'
Chain 2 Signature Hash: 0x56c5cf5
[c] Chain 3 Signature: 'log file parallel write'<='log buffer space'<='latch: In memory undo latch'
Chain 3 Signature Hash: 0x1d6eb75b
===============================================================================
Non-intersecting chains:
-------------------------------------------------------------------------------
Chain 1:
-------------------------------------------------------------------------------
Oracle session identified by:
{
instance: 1 (b203.b203)
os id: 5860
process id: 15, oracle@l64rw3.domain (MMON)
session id: 15
session serial #: 1
}
is waiting for 'buffer busy waits' with wait info:
{
p1: 'file#'=0x3
p2: 'block#'=0x80
p3: 'class#'=0x11
time in wait: 52.137595 sec
インスタンス内の全待機
チェーンからの抜粋
1番目の待機チェーンの待機
関係を表示](https://image.slidesharecdn.com/130530analyzingoracledatabasehangissuesusingdiagnosticspubic-130530082726-phpapp01/85/Analyzing-Oracle-Database-hang-issues-using-various-diagnostics-11-320.jpg)
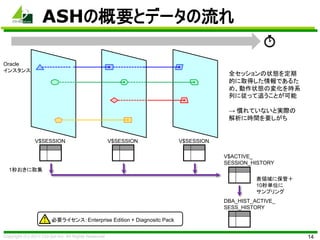
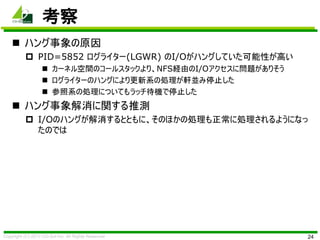
![Copyright (C) 2013 CO-Sol Inc. All Rights Reserved
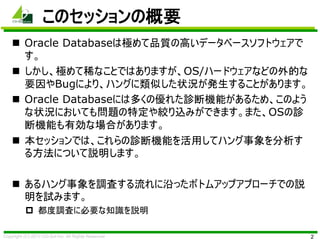
LGWRプロセスの動作状況を調査
22
[oracle@l64rw3 ~]$ pid=5852
[oracle@l64rw3 ~]$ ps auxwww |grep $pid |grep -v grep
oracle 5852 0.2 0.7 1808136 14880 ? Ds 21:51 0:00 ora_lgwr_b203
[oracle@l64rw3 ~]$ cat /proc/$pid/status
Name: oracle
State: D (disk sleep)
Tgid: 5852
Pid: 5852
PPid: 1
(略)
[oracle@l64rw3 ~]$ cat /proc/$pid/stack
[<ffffffff81119d0d>] sync_page+0x3d/0x50
[<ffffffff81119ca7>] __lock_page+0x67/0x70
[<ffffffff8111ad50>] find_lock_page+0x50/0x80
[<ffffffff8111adcd>] grab_cache_page_write_begin+0x4d/0xe0
[<ffffffffa0384277>] nfs_write_begin+0x77/0x220 [nfs]
[<ffffffff8111a673>] generic_file_buffered_write+0x123/0x2e0
[<ffffffff8111c0e0>] __generic_file_aio_write+0x260/0x490
[<ffffffff8111c398>] generic_file_aio_write+0x88/0x100
[<ffffffffa0384f9e>] nfs_file_write+0xde/0x1f0 [nfs]
[<ffffffff81180c9a>] do_sync_write+0xfa/0x140
[<ffffffff81180f98>] vfs_write+0xb8/0x1a0
[<ffffffff81181952>] sys_pwrite64+0x82/0xa0
[<ffffffff8100b072>] system_call_fastpath+0x16/0x1b
[<ffffffffffffffff>] 0xffffffffffffffff
D=Interrutible Sleep
割り込み不可状態
一般にI/O中であることを示す
pwrite()システムコール実行
中であることがわかる](https://image.slidesharecdn.com/130530analyzingoracledatabasehangissuesusingdiagnosticspubic-130530082726-phpapp01/85/Analyzing-Oracle-Database-hang-issues-using-various-diagnostics-23-320.jpg)
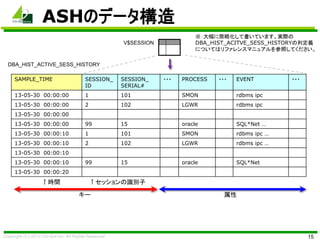
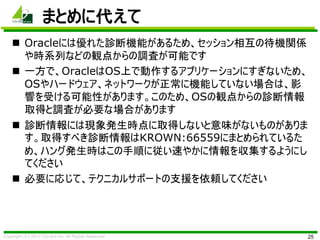
![Copyright (C) 2013 CO-Sol Inc. All Rights Reserved
khungtaskdのsyslog出力
23
May 27 21:57:33 l64rw3 kernel: INFO: task oracle:5852 blocked for more than 120 seconds.
May 27 21:57:33 l64rw3 kernel: "echo 0 > /proc/sys/kernel/hung_task_timeout_secs" disables this
message.
May 27 21:57:33 l64rw3 kernel: oracle D 0000000000000000 0 5852 1 0x00000084
May 27 21:57:33 l64rw3 kernel: ffff88000e6319c8 0000000000000082 ffff880037f09588 ffff880002216768
May 27 21:57:33 l64rw3 kernel: ffff88000e631948 ffffffff810572f0 ffff880037f09578 ffff88003533a040
May 27 21:57:33 l64rw3 kernel: ffff88003533a5f8 ffff88000e631fd8 000000000000fb88 ffff88003533a5f8
May 27 21:57:33 l64rw3 kernel: Call Trace:
May 27 21:57:33 l64rw3 kernel: [<ffffffff810572f0>] ? __dequeue_entity+0x30/0x50
May 27 21:57:33 l64rw3 kernel: [<ffffffff810a1aa9>] ? ktime_get_ts+0xa9/0xe0
May 27 21:57:33 l64rw3 kernel: [<ffffffff81119cd0>] ? sync_page+0x0/0x50
May 27 21:57:33 l64rw3 kernel: [<ffffffff8150de73>] io_schedule+0x73/0xc0
May 27 21:57:33 l64rw3 kernel: [<ffffffff81119d0d>] sync_page+0x3d/0x50
May 27 21:57:33 l64rw3 kernel: [<ffffffff8150e6da>] __wait_on_bit_lock+0x5a/0xc0
May 27 21:57:33 l64rw3 kernel: [<ffffffff81119ca7>] __lock_page+0x67/0x70
May 27 21:57:33 l64rw3 kernel: [<ffffffff81096cc0>] ? wake_bit_function+0x0/0x50
May 27 21:57:33 l64rw3 kernel: [<ffffffff8111ad50>] find_lock_page+0x50/0x80
May 27 21:57:33 l64rw3 kernel: [<ffffffff8111adcd>] grab_cache_page_write_begin+0x4d/0xe0
May 27 21:57:33 l64rw3 kernel: [<ffffffffa0384277>] nfs_write_begin+0x77/0x220 [nfs]
May 27 21:57:33 l64rw3 kernel: [<ffffffff8111a673>] generic_file_buffered_write+0x123/0x2e0
May 27 21:57:33 l64rw3 kernel: [<ffffffff8111c5c5>] ? mempool_free+0x95/0xa0
May 27 21:57:33 l64rw3 kernel: [<ffffffff8111c0e0>] __generic_file_aio_write+0x260/0x490
May 27 21:57:33 l64rw3 kernel: [<ffffffffa00ac2c1>] ? ext4_sync_file+0x191/0x260 [ext4]
May 27 21:57:33 l64rw3 kernel: [<ffffffff811b1a47>] ? vfs_fsync_range+0xb7/0xe0
May 27 21:57:33 l64rw3 kernel: [<ffffffff8111c398>] generic_file_aio_write+0x88/0x100
May 27 21:57:33 l64rw3 kernel: [<ffffffffa00abbf0>] ? ext4_file_open+0x0/0x130 [ext4]
May 27 21:57:33 l64rw3 kernel: [<ffffffffa0384f9e>] nfs_file_write+0xde/0x1f0 [nfs]
May 27 21:57:33 l64rw3 kernel: [<ffffffff81180c9a>] do_sync_write+0xfa/0x140
May 27 21:57:33 l64rw3 kernel: [<ffffffff81096c80>] ? autoremove_wake_function+0x0/0x40
May 27 21:57:33 l64rw3 kernel: [<ffffffff8121baf6>] ? security_file_permission+0x16/0x20
May 27 21:57:33 l64rw3 kernel: [<ffffffff81180f98>] vfs_write+0xb8/0x1a0
May 27 21:57:33 l64rw3 kernel: [<ffffffff81181952>] sys_pwrite64+0x82/0xa0
May 27 21:57:33 l64rw3 kernel: [<ffffffff8100b072>] system_call_fastpath+0x16/0x1b
カーネルスタック
NFSファイルに対するwrite中
である可能性が高い](https://image.slidesharecdn.com/130530analyzingoracledatabasehangissuesusingdiagnosticspubic-130530082726-phpapp01/85/Analyzing-Oracle-Database-hang-issues-using-various-diagnostics-24-320.jpg)

![【旧版】Oracle Exadata Cloud Service:サービス概要のご紹介 [2021年7月版]](https://cdn.slidesharecdn.com/ss_thumbnails/exadatacloudserviceoverview210709-210709124533-thumbnail.jpg?width=640&height=640&fit=bounds)

![Oracle Gen 2 Exadata Cloud@Customer:サービス概要のご紹介 [2021年7月版]](https://cdn.slidesharecdn.com/ss_thumbnails/exadatacloudatcustomer20210712-210907000957-thumbnail.jpg?width=640&height=640&fit=bounds)


![【旧版】Oracle Database Cloud Service:サービス概要のご紹介 [2021年7月版]](https://cdn.slidesharecdn.com/ss_thumbnails/ocidatabaseoverview210709-210709093949-thumbnail.jpg?width=640&height=640&fit=bounds)


![【旧版】Oracle Gen 2 Exadata Cloud@Customer:サービス概要のご紹介 [2021年12月版]](https://cdn.slidesharecdn.com/ss_thumbnails/exadatacloudatcustomer20211208-211210071313-thumbnail.jpg?width=640&height=640&fit=bounds)
![オラクルのデータベースセキュリティへの取り組み [2021年2月版]](https://cdn.slidesharecdn.com/ss_thumbnails/202102oracledbsecurityoverview-210215070200-thumbnail.jpg?width=640&height=640&fit=bounds)

![[B31] LOGMinerってレプリケーションソフトで使われているけどどうなってる? by Toshiya Morita](https://cdn.slidesharecdn.com/ss_thumbnails/b31iti-140624235903-phpapp02-thumbnail.jpg?width=640&height=640&fit=bounds)


![Oracle Cloud Infrastructure セキュリティの取り組み [2021年2月版]](https://cdn.slidesharecdn.com/ss_thumbnails/ocisecurityoverview202102-210219093947-thumbnail.jpg?width=640&height=640&fit=bounds)


![[A33] [特濃jpoug statspack on pdb oracle database 12c] 20131115 補足・続報付き](https://cdn.slidesharecdn.com/ss_thumbnails/a33jpougstatspackonpdboracledatabase12c20131115-131119005920-phpapp02-thumbnail.jpg?width=640&height=640&fit=bounds)


![[INSIGHT OUT 2011] A24 sql server wait events(mario broodbakker)](https://cdn.slidesharecdn.com/ss_thumbnails/insightout2011a24sqlserverwaiteventsmariobroodbakker-111114013301-phpapp01-thumbnail.jpg?width=640&height=640&fit=bounds)


