[INSIGHT OUT 2011] A24 sql server wait events(mario broodbakker)
1.
SQL Server WaitEvents
Mario Broodbakker
mario@insight-tec.co.jp
2.
経歴
• 1987 年よりDBAとして最初はメインフレームを経験しその後、OracleAIX
版とWindows版に携わる
• 1997年よりBaanでPerformance & Benchmark スペシャリストとして働きそ
の後、Compaq: Windows Oracle, SQL Server en Informix benchmarksを経
験
• Compaq と HP: Unix、Windows Oracle パフォーマンスコンサルタント
• 2006-2009 Windows Integrity Engineering: Windows Itanium (eh, Oracle)
benchmarks in Redmond, WA USA.
• 2002年からSQL Server 2000の解析調査を始め、ユーザセッションごとの
wait event情報の収集やwait event tracingに携わる。後に、SQL Server
2005についても調査 see: www.sqlinternals.com
• Wait event presentation: DBForum Lalandia 2004 (SQL Server 2000)
• SQL Server waitstuff について3つの記事を発表
– www.simple-talk.com/sql/performance
• PGGM (Pension fund)にてDatabaseスペシャリストとして2010年
Netherlandsに戻る: finally SQL Server DBA!
• 現在、インサイトテクノロジー在籍
3.
wait events とは?
•SQL Server が動いていなかったら: 待機状態
• wait event が発生したら: ‘何か’ が現状のタスク
を待ち状態にしている
• SQL Server では、待ちの発生場所を特定できる:
– Data file or transaction log IO
– Network IO
– Locks & Latches
– CPU
– 480 以上のwait の種類がある
4.
用途は?
• R =S +W : Response time = Service time +
Wait time
• Response time is key for the end user. ‘R’ はオ
ンライン response timeとなるが、‘batch’ time
を表すこともある
• Example: response time 4 seconds は、 0.2 s
CPU time と 3.8 seconds の IO time から構成
されている。 Does it make sense to optimize
CPU time? Buy faster CPUs? Build faster code?
5.
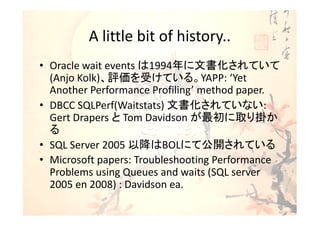
A little bitof history..
• Oracle wait events は1994年に文書化されていて
(Anjo Kolk)、評価を受けている。YAPP: ‘Yet
Another Performance Profiling’ method paper.
• DBCC SQLPerf(Waitstats) 文書化されていない:
Gert Drapers と Tom Davidson が最初に取り掛か
る
• SQL Server 2005 以降はBOLにて公開されている
• Microsoft papers: Troubleshooting Performance
Problems using Queues and waits (SQL server
2005 en 2008) : Davidson ea.
6.
Where do waitevents come from?
• SOS Scheduler
– ‘work request’ 処理中: SQL Batch または Parallel
Query -> task
– 1 task runs on 1 scheduler on 1 CPU until:
• blocking call 発生: disk IO, network IO -> wait event, start
time and type が登録される
• Time quantum has elapsed: 4ms (always?) (scheduler and
CPU の独占を防ぐために): SOS_SCHEDULER_WAIT (and
SLEEP_TASK?)
– worker thread によりtask 処理が発生: OS thread or
Fiber (light weight pooling)
7.
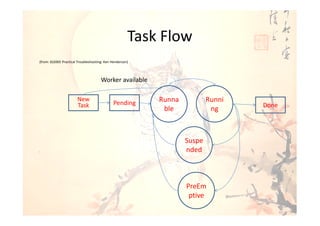
Task Flow
(from: SS2005Practical Troubleshooting: Ken Henderson)
Worker available
New
Pending Runna Runni
Task Done
ble ng
Suspe
nded
PreEm
ptive
8.
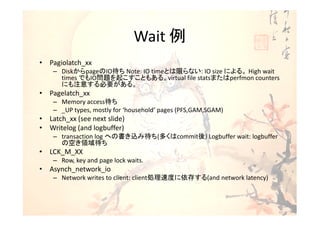
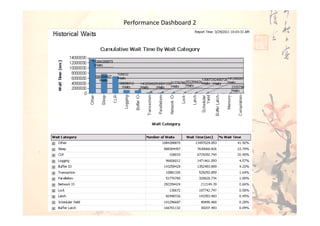
Wait time
• waittime の 2 つの要素:
– Resource wait time
• resource が利用可能になるまでの時間。‘suspended’ 状態
から ‘ runable’ になるまでの時間。
– Signal wait time
• resource が利用可能になるまでの時間とタスクの実継続時
間: ‘runnable’ から ‘running’ になるまでの時間。
– DMV(動的管理ビュー)のwait timeにはsignal wait
timeが含まれる.
• SQL Server バージョンによりタイミングは異なる。
SS2005 SP3 からは 1ms..ほど(詳細はこちらの link )
9.
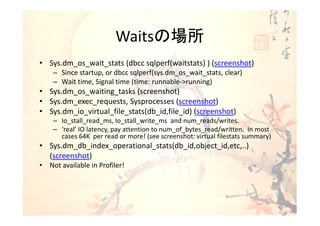
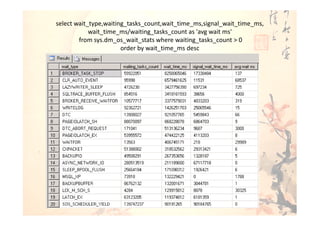
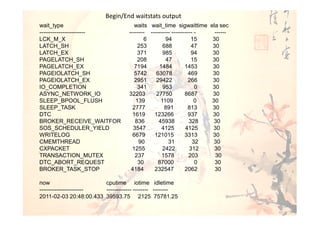
Waitsの場所
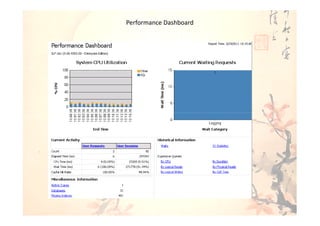
• Sys.dm_os_wait_stats (dbccsqlperf(waitstats) ) (screenshot)
– Since startup, or dbcc sqlperf(sys.dm_os_wait_stats, clear)
– Wait time, Signal time (time: runnable->running)
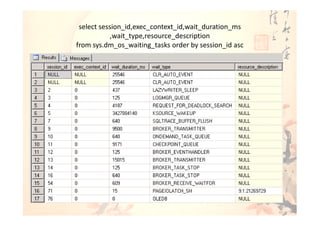
• Sys.dm_os_waiting_tasks (screenshot)
• Sys.dm_exec_requests, Sysprocesses (screenshot)
• Sys.dm_io_virtual_file_stats(db_id,file_id) (screenshot)
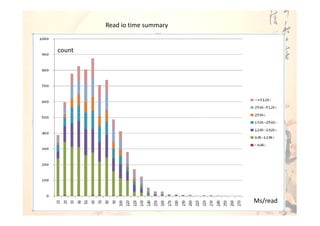
– Io_stall_read_ms, Io_stall_write_ms and num_reads/writes.
– ‘real’ IO latency, pay attention to num_of_bytes_read/written. In most
cases 64K per read or more! (see screenshot: virtual filestats summary)
• Sys.dm_db_index_operational_stats(db_id,object_id,etc,..)
(screenshot)
• Not available in Profiler!
10.
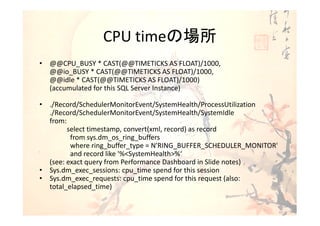
CPU timeの場所
• @@CPU_BUSY* CAST(@@TIMETICKS AS FLOAT)/1000,
@@io_BUSY * CAST(@@TIMETICKS AS FLOAT)/1000,
@@idle * CAST(@@TIMETICKS AS FLOAT)/1000)
(accumulated for this SQL Server Instance)
• ./Record/SchedulerMonitorEvent/SystemHealth/ProcessUtilization
./Record/SchedulerMonitorEvent/SystemHealth/SystemIdle
from:
select timestamp, convert(xml, record) as record
from sys.dm_os_ring_buffers
where ring_buffer_type = N'RING_BUFFER_SCHEDULER_MONITOR'
and record like '%<SystemHealth>%‘
(see: exact query from Performance Dashboard in Slide notes)
• Sys.dm_exec_sessions: cpu_time spend for this session
• Sys.dm_exec_requests: cpu_time spend for this request (also:
total_elapsed_time)
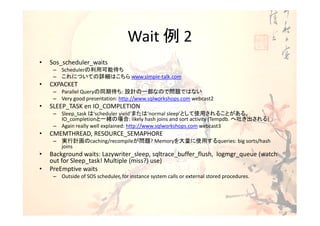
But…
• session, SQL文, Batchごとのwait event を見ることができない
• Sessionかbatchのどちらがwait eventの原因なのかは推測の域
• Unless you use ‘dangerous’ tools from sqlinternals.com (see
example)
• Or use SQL Server 2008: Xevents! (demo), unfortunately no DMVs
only clumsy XML
• 多くのSQL Server動作はOracleと比較すると非同期的に実行される
(pagiolatch waits vs filestats: Oracle: db file sequential read)
• Don’t forget about CPU time: it’s still part of response time!
• Despite the fact that wait events are extremely important, there is
more to measure. But not much more..
• ..The best optimization is elimination: Only do what you need to do:
keep questioning code and (business) processes
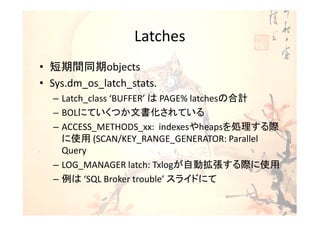
22.
実例
• insert loop,many commits
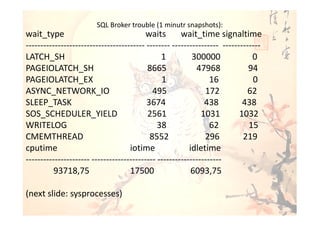
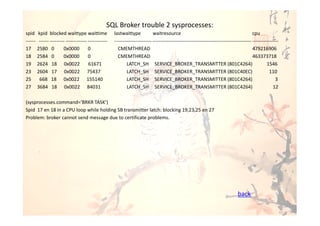
• Broker problems
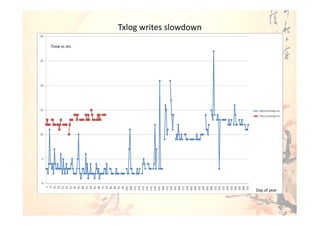
• SAN移行後、Writelog がスローダウン
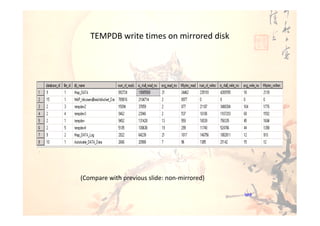
• ミラーディスクにTempdbを置いたとき
Tempdb
• Batch response time breakdown: DB timeを
appserver timeと比較して
• Demo SQL Server 2008 XEvents
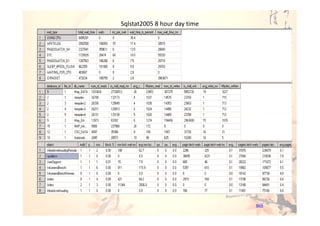
23.
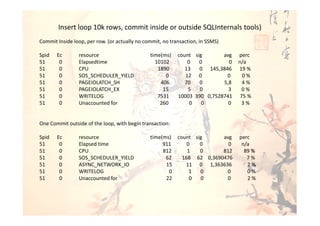
Insert loop 10krows, commit inside or outside SQLInternals tools)
Commit Inside loop, per row. (or actually no commit, no transaction, in SSMS)
Spid Ec resource time(ms) count sig avg perc
51 0 Elapsedtime 10102 0 0 0 n/a
51 0 CPU 1890 13 0 145,3846 19 %
51 0 SOS_SCHEDULER_YIELD 0 12 0 0 0%
51 0 PAGEIOLATCH_SH 406 70 0 5,8 4%
51 0 PAGEIOLATCH_EX 15 5 0 3 0%
51 0 WRITELOG 7531 10003 390 0,7528741 75 %
51 0 Unaccounted for 260 0 0 0 3%
One Commit outside of the loop, with begin transaction:
Spid Ec resource time(ms) count sig avg perc
51 0 Elapsed time 911 0 0 0 n/a
51 0 CPU 812 1 0 812 89 %
51 0 SOS_SCHEDULER_YIELD 62 168 62 0,3690476 7%
51 0 ASYNC_NETWORK_IO 15 11 0 1,363636 2%
51 0 WRITELOG 0 1 0 0 0%
51 0 Unaccounted for 22 0 0 0 2%


![[B24] Oracle から SQL Server システム移行の勘所 by Norio Nakamura](https://cdn.slidesharecdn.com/ss_thumbnails/b24iti-140627000636-phpapp01-thumbnail.jpg?width=640&height=640&fit=bounds)


![[INSIGHT OUT 2011] C12 50分で理解する SQL Serverでできることできないこと(uchiyama)](https://cdn.slidesharecdn.com/ss_thumbnails/insightout2011c1250sqlserveruchiyama-111206190505-phpapp01-thumbnail.jpg?width=640&height=640&fit=bounds)


![[db tech showcase Tokyo 2017] D21: ついに Red Hat Enterprise Linuxで SQL Serverが使...](https://cdn.slidesharecdn.com/ss_thumbnails/d21-170912022444-thumbnail.jpg?width=640&height=640&fit=bounds)


![レガシーに埋もれたデータをリアルタイムでクラウドへ [ATTUNITY & インサイトテクノロジー IoT / Big Data フォーラム 2018]](https://cdn.slidesharecdn.com/ss_thumbnails/attunityseminar20181206msnakagawa-181211014925-thumbnail.jpg?width=640&height=640&fit=bounds)


