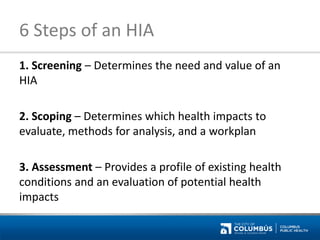
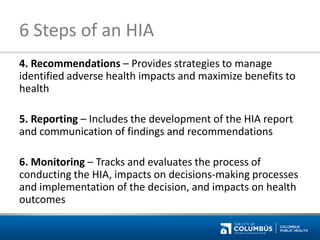
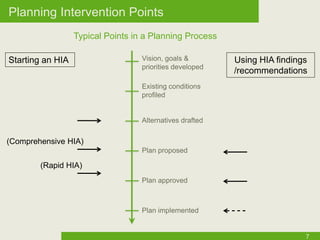
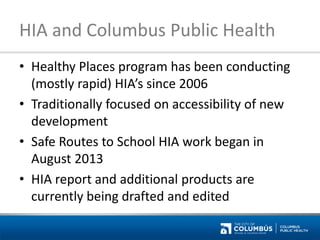
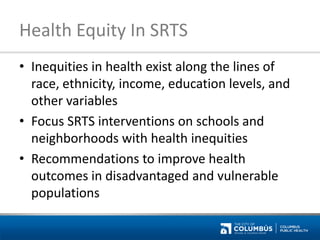
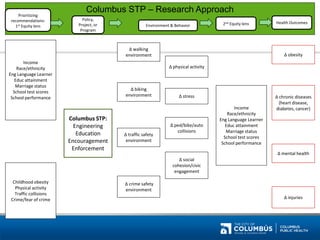
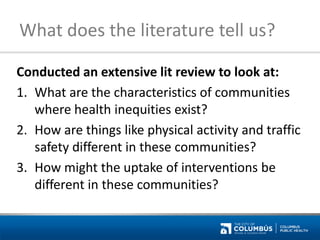
Health Impact Assessment and Safe Routes to School 
Brian Butler, MPH 
Epidemiologist
What is Health Impact Assessment? 
A systematic process that uses an array of data sources and analytic methods and considers input from stakeholders to determine the potential effects of a proposed policy, plan, program or project on the health of a population. HIA provides recommendations on monitoring and managing those effects. 
National Research Council of the National Academies, 2011
HIA Purpose 
Through HIA report and communications 
•Judge health effects of a proposed project, plan or policy 
•Highlight health disparities 
•Provide recommendations 
•Raise awareness among decision makers and the public 
•Make health impacts more explicit 
Human Impact Partners
HIA Purpose 
Through the HIA process 
•Engage & empower community 
•Recognize lived experience 
•Build relationships & collaborations 
•Improve the evidence 
•Improve transparency in decision making 
Human Impact Partners
6 Steps of an HIA 
1. Screening – Determines the need and value of an HIA 
2. Scoping – Determines which health impacts to evaluate, methods for analysis, and a workplan 
3. Assessment – Provides a profile of existing health conditions and an evaluation of potential health impacts
6 Steps of an HIA 
4. Recommendations – Provides strategies to manage identified adverse health impacts and maximize benefits to health 
5. Reporting – Includes the development of the HIA report and communication of findings and recommendations 
6. Monitoring – Tracks and evaluates the process of conducting the HIA, impacts on decisions-making processes and implementation of the decision, and impacts on health outcomes
7 
Planning Intervention Points 
Vision, goals & priorities developed 
Starting an HIA 
Typical Points in a Planning Process 
Existing conditions profiled 
Alternatives drafted 
Plan proposed 
Plan approved 
Plan implemented 
(Rapid HIA) 
(Comprehensive HIA) 
Using HIA findings /recommendations
HIA and Columbus Public Health 
•Healthy Places program has been conducting (mostly rapid) HIA’s since 2006 
•Traditionally focused on accessibility of new development 
•Safe Routes to School HIA work began in August 2013 
•HIA report and additional products are currently being drafted and edited
Health Equity In SRTS 
•Inequities in health exist along the lines of race, ethnicity, income, education levels, and other variables 
•Focus SRTS interventions on schools and neighborhoods with health inequities 
•Recommendations to improve health outcomes in disadvantaged and vulnerable populations
Δ obesity 
Income 
Race/ethnicity 
Eng Language Learner 
Educ attainment 
Marriage status 
School test scores 
School performance 
Columbus STP: 
Engineering 
Education 
Encouragement 
Enforcement 
Δ walking environment 
Δ social cohesion/civic engagement 
Δ traffic safety environment 
Δ chronic diseases (heart disease, diabetes, cancer) 
Δ mental health 
Δ crime safety environment 
Δ physical activity 
Δ ped/bike/auto collisions 
Childhood obesity 
Physical activity 
Traffic collisions 
Crime/fear of crime 
Δ stress 
Δ injuries 
Columbus STP – Research Approach 
Prioritizing recommendations: 
1st Equity lens 
Policy, Project, or Program 
Environment & Behavior 
Health Outcomes 
Δ biking environment 
Income 
Race/ethnicity 
Eng Language Learner 
Educ attainment 
Marriage status 
School test scores 
School performance 
2nd Equity lens
A Key Research Question 
How do you quantify or measure 
health inequity?
What does the literature tell us? 
Conducted an extensive lit review to look at: 
1.What are the characteristics of communities where health inequities exist? 
2.How are things like physical activity and traffic safety different in these communities? 
3.How might the uptake of interventions be different in these communities?
•Socioeconomic Status (SES) Index 
–Crowding 
–Home value 
–Income 
–High education 
–Low education 
–Unemployment 
–Poverty 
•Poverty 
•Race 
•Ethnicity 
•Language other than English 
•Single parent head of household 
Level 1 Analysis 
Analyzed and mapped indicators of Healthy Equity by Census Tract:
School building datasets 
•Free and reduced lunch rates 
•School Performance Indicators and Index 
•ELL/ESL rates 
•Overweight and obesity rates 
Additional factors mapped to inform the HIA 
•Crime and perception/fear of crime 
•Traffic collisions – pedestrians and bicycles 
•Elementary/Middle school aged population 
More Level 1 Analysis
Focus School Profiles 
List based on multiple indicators 
•SES Index 
•Race and Ethnicity 
•Single parent households 
•Language 
•Population of children 
•School Performance
School 
CT or S 
Sullivant 
Trevitt 
Windsor STEM 
Lincoln Park 
Highland 
Ohio Avenue 
East Columbus 
Eakin 
School Type 
Elem. 
Elem. 
Elem. 
Elem. 
Elem. 
Elem. 
Elem. 
Elem. 
Census Tract 
51 
29 
15 
60 
47 
53 
26 
75.11 
Neigh-borhood 
Franklinton 
Eastside 
Linden 
Southside 
Hilltop 
Old Town East 
Eastside 
Hilltop 
SES Index rank 
CT 
2 
3 
6 
11 
21 
21 
15 
46 
FARM rank 
S 
1 
12 
49 
5 
24 
30 
51 
8 
% non-white rank 
CT 
67 
5 
1 
97 
80 
38 
55 
89 
% non-white rank 
S 
66 
16 
9 
73 
65 
15 
34 
42 
Lang. other than English rank 
CT 
44 
249 
128 
270 
204 
211 
31 
9 
ESL rank 
S 
20 
70 
80 
42 
18 
68 
31 
3 
% single parent rank 
CT 
31 
16 
20 
43 
34 
4 
92 
90 
% pop. 5 to 14 years old rank 
CT 
12 
1 
28 
114 
16 
31 
67 
75 
% of students w/in 0.5 mi 
42.8 
64.6 
37.2 
41.5 
60.8 
27.9 
51.6 
76.1 
% of students w/in 1.0 mi 
69.2 
81.4 
65.1 
63.6 
71.4 
57.7 
57.3 
81.8 
% of students w/in 2.0 mi 
79.8 
86.7 
87.2 
71.5 
84.2 
78.1 
71.6 
87.5 
% of ODE standards met 
S 
14.3 
0 
0 
11.1 
0 
0 
14.3 
14.3 
ODE Perf. Index percent 
S 
54.5 
45.7 
49.9 
66.8 
51 
52.5 
54.4 
62.4
School 
Sullivant 
Eakin 
Type 
Elem 
Elem 
Census Tract 
51 
75.11 
Neighborhood 
Franklinton 
Hilltop 
SES Index Rank 
2 
46 
Free and Reduced Lunch Rank 
1 
8 
Percent non-White Rank (CT) 
67 
89 
Percent non-White Rank (Sch) 
66 
42 
Language other than English Rank (CT) 
44 
9 
English Language Leaner Rank (Sch) 
20 
3 
Percent Single Parent Rank 
31 
90 
Percent Population 5 to 14 Rank 
12 
75 
Percent of Students with 0.5 Miles 
42.8 
76.1 
Percent of Students with 1.0 Mile 
69.2 
81.8 
Percent of Students with 2.0 Miles 
79.8 
87.5 
Percent of ODE Standards Met 
14.3 
14.3 
ODE Performance Index 
54.5 
62.4
Questions?

Integrating a Health Impact Assessment into District-Wide School Travel Planning

  • 1.
    Health Impact Assessmentand Safe Routes to School Brian Butler, MPH Epidemiologist
  • 2.
    What is HealthImpact Assessment? A systematic process that uses an array of data sources and analytic methods and considers input from stakeholders to determine the potential effects of a proposed policy, plan, program or project on the health of a population. HIA provides recommendations on monitoring and managing those effects. National Research Council of the National Academies, 2011
  • 3.
    HIA Purpose ThroughHIA report and communications •Judge health effects of a proposed project, plan or policy •Highlight health disparities •Provide recommendations •Raise awareness among decision makers and the public •Make health impacts more explicit Human Impact Partners
  • 4.
    HIA Purpose Throughthe HIA process •Engage & empower community •Recognize lived experience •Build relationships & collaborations •Improve the evidence •Improve transparency in decision making Human Impact Partners
  • 5.
    6 Steps ofan HIA 1. Screening – Determines the need and value of an HIA 2. Scoping – Determines which health impacts to evaluate, methods for analysis, and a workplan 3. Assessment – Provides a profile of existing health conditions and an evaluation of potential health impacts
  • 6.
    6 Steps ofan HIA 4. Recommendations – Provides strategies to manage identified adverse health impacts and maximize benefits to health 5. Reporting – Includes the development of the HIA report and communication of findings and recommendations 6. Monitoring – Tracks and evaluates the process of conducting the HIA, impacts on decisions-making processes and implementation of the decision, and impacts on health outcomes
  • 7.
    7 Planning InterventionPoints Vision, goals & priorities developed Starting an HIA Typical Points in a Planning Process Existing conditions profiled Alternatives drafted Plan proposed Plan approved Plan implemented (Rapid HIA) (Comprehensive HIA) Using HIA findings /recommendations
  • 8.
    HIA and ColumbusPublic Health •Healthy Places program has been conducting (mostly rapid) HIA’s since 2006 •Traditionally focused on accessibility of new development •Safe Routes to School HIA work began in August 2013 •HIA report and additional products are currently being drafted and edited
  • 9.
    Health Equity InSRTS •Inequities in health exist along the lines of race, ethnicity, income, education levels, and other variables •Focus SRTS interventions on schools and neighborhoods with health inequities •Recommendations to improve health outcomes in disadvantaged and vulnerable populations
  • 10.
    Δ obesity Income Race/ethnicity Eng Language Learner Educ attainment Marriage status School test scores School performance Columbus STP: Engineering Education Encouragement Enforcement Δ walking environment Δ social cohesion/civic engagement Δ traffic safety environment Δ chronic diseases (heart disease, diabetes, cancer) Δ mental health Δ crime safety environment Δ physical activity Δ ped/bike/auto collisions Childhood obesity Physical activity Traffic collisions Crime/fear of crime Δ stress Δ injuries Columbus STP – Research Approach Prioritizing recommendations: 1st Equity lens Policy, Project, or Program Environment & Behavior Health Outcomes Δ biking environment Income Race/ethnicity Eng Language Learner Educ attainment Marriage status School test scores School performance 2nd Equity lens
  • 11.
    A Key ResearchQuestion How do you quantify or measure health inequity?
  • 12.
    What does theliterature tell us? Conducted an extensive lit review to look at: 1.What are the characteristics of communities where health inequities exist? 2.How are things like physical activity and traffic safety different in these communities? 3.How might the uptake of interventions be different in these communities?
  • 13.
    •Socioeconomic Status (SES)Index –Crowding –Home value –Income –High education –Low education –Unemployment –Poverty •Poverty •Race •Ethnicity •Language other than English •Single parent head of household Level 1 Analysis Analyzed and mapped indicators of Healthy Equity by Census Tract:
  • 14.
    School building datasets •Free and reduced lunch rates •School Performance Indicators and Index •ELL/ESL rates •Overweight and obesity rates Additional factors mapped to inform the HIA •Crime and perception/fear of crime •Traffic collisions – pedestrians and bicycles •Elementary/Middle school aged population More Level 1 Analysis
  • 15.
    Focus School Profiles List based on multiple indicators •SES Index •Race and Ethnicity •Single parent households •Language •Population of children •School Performance
  • 16.
    School CT orS Sullivant Trevitt Windsor STEM Lincoln Park Highland Ohio Avenue East Columbus Eakin School Type Elem. Elem. Elem. Elem. Elem. Elem. Elem. Elem. Census Tract 51 29 15 60 47 53 26 75.11 Neigh-borhood Franklinton Eastside Linden Southside Hilltop Old Town East Eastside Hilltop SES Index rank CT 2 3 6 11 21 21 15 46 FARM rank S 1 12 49 5 24 30 51 8 % non-white rank CT 67 5 1 97 80 38 55 89 % non-white rank S 66 16 9 73 65 15 34 42 Lang. other than English rank CT 44 249 128 270 204 211 31 9 ESL rank S 20 70 80 42 18 68 31 3 % single parent rank CT 31 16 20 43 34 4 92 90 % pop. 5 to 14 years old rank CT 12 1 28 114 16 31 67 75 % of students w/in 0.5 mi 42.8 64.6 37.2 41.5 60.8 27.9 51.6 76.1 % of students w/in 1.0 mi 69.2 81.4 65.1 63.6 71.4 57.7 57.3 81.8 % of students w/in 2.0 mi 79.8 86.7 87.2 71.5 84.2 78.1 71.6 87.5 % of ODE standards met S 14.3 0 0 11.1 0 0 14.3 14.3 ODE Perf. Index percent S 54.5 45.7 49.9 66.8 51 52.5 54.4 62.4
  • 17.
    School Sullivant Eakin Type Elem Elem Census Tract 51 75.11 Neighborhood Franklinton Hilltop SES Index Rank 2 46 Free and Reduced Lunch Rank 1 8 Percent non-White Rank (CT) 67 89 Percent non-White Rank (Sch) 66 42 Language other than English Rank (CT) 44 9 English Language Leaner Rank (Sch) 20 3 Percent Single Parent Rank 31 90 Percent Population 5 to 14 Rank 12 75 Percent of Students with 0.5 Miles 42.8 76.1 Percent of Students with 1.0 Mile 69.2 81.8 Percent of Students with 2.0 Miles 79.8 87.5 Percent of ODE Standards Met 14.3 14.3 ODE Performance Index 54.5 62.4
  • 18.