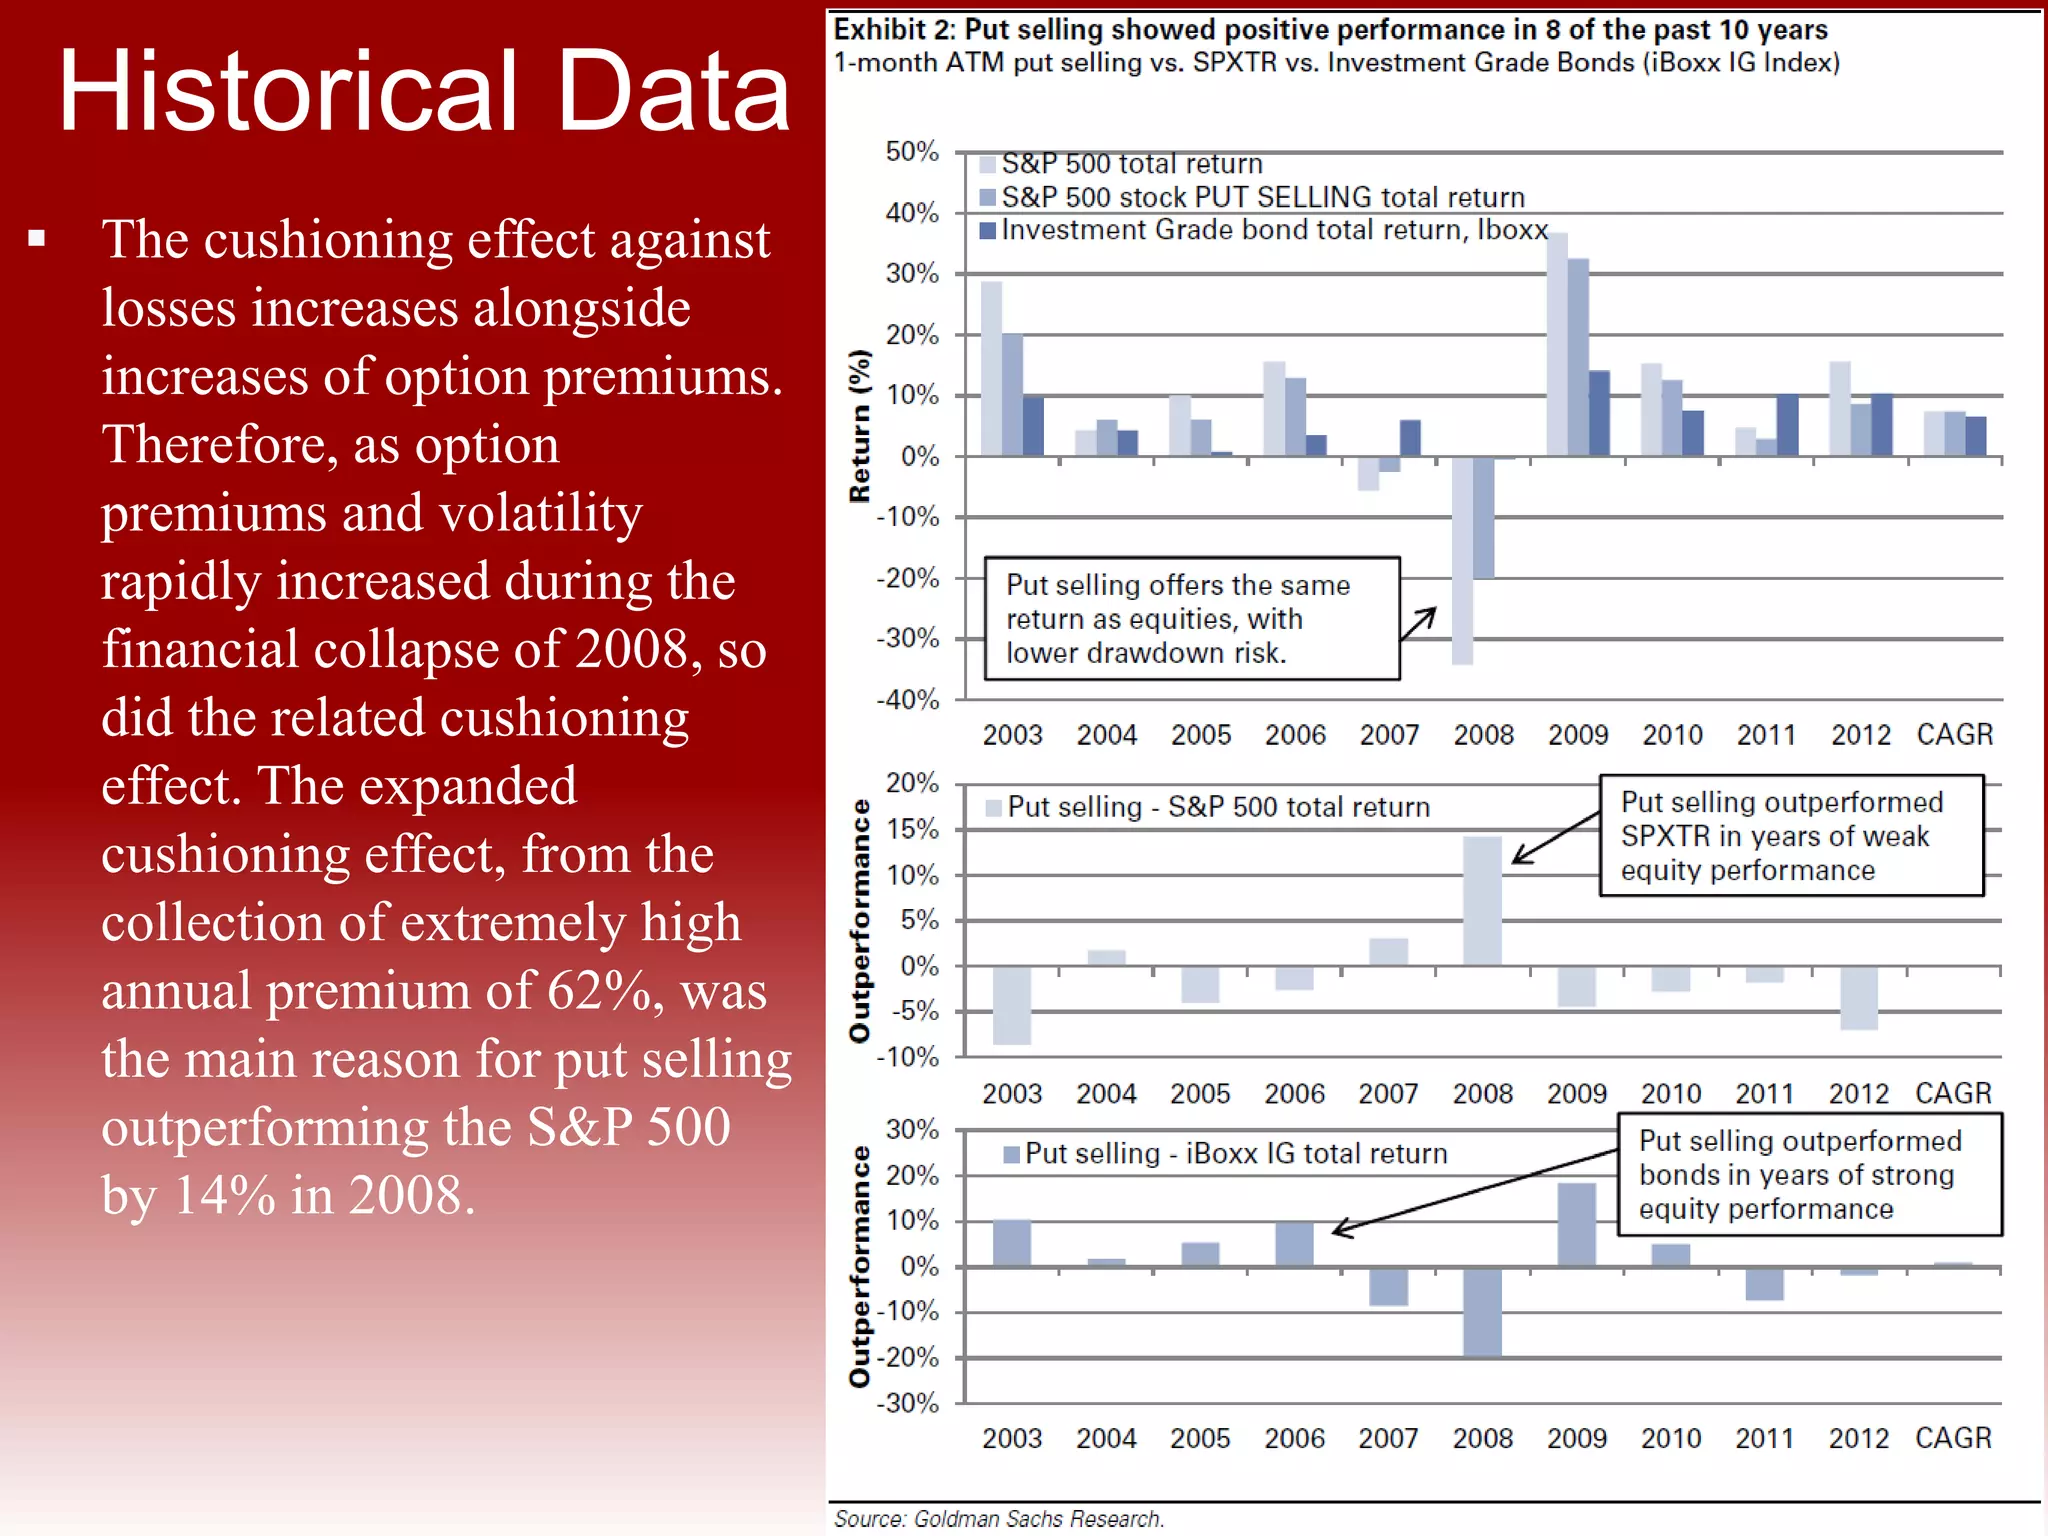
Put Writing Strategy
“Alternative to Long Only EquityAllocation”
Put Writing (Selling) Strategy Overview:
 Option Basics
 Strategy Goals
 What is Put Selling?
 Covered Calls/ Buywrites
 Historical Data
 Volatility Risk Premium & Directional Skew
 Across Market Conditions
 Variations
 Summary
What is an Option?
Option Basics
An option is a contract that gives the purchaser the right, but
not the obligation to buy or sell an underlying asset for a
specified price, at or before a designated date.
Buying
Puts vs. Calls
Option Basics
Option Basics
Selling
Puts vs. Calls
Profits for selling options
Option Basics
Buying options at different strike
prices
Option Basics
Selling options at different strike
prices
Option Basics
Goals
 Many investors seek
strategies that generate
high current yields, low
volatility, and strong
returns in markets that
are flat or slightly rising.
There is a strong desire
to find equity-like
returns with less
volatility than long only
allocation to stocks.
Strategy Goals
 Put writing strategies and
covered call strategies offer
the ability to fulfill these goals.
However, it will be shown that
put writing is a more effective
strategy than a covered call.
Put Writing
What is put selling?
A put writing strategy
involves selling a put
option on a stock in
order to collect a
premium for agreeing to
buy shares at a specific
strike price should it drop
below that level by
expiration. Treasuries
are usually held as
collateral in amounts
equal to the maximum
possible losses.
Covered Calls/ Buywrites
 A covered call, also
know as a buywrite,
involves selling a call
option while also
buying the underlying
security for which the
option was written.
 Put writing is the
synthetic equivalent of
a buywrite.
Growth of One Dollar
Historical Data
 The Chicago Board of Exchange has
created several option strategy
benchmarks that give reasonable
representations of put selling and
buywrite strategies.
 The S&P 500 PutWrite Index (PUT)
invests cash at one- and three-month
Treasury Bill rates and sells a
sequence of one-month at-the-money
S&P 500 puts. The treasury bills act
as collateral in an amount equal to
the maximum possible losses from
the put sales.
 The S&P 500 BuyWrite Index (BXM)
sells at-the-money (ATM) S&P 500
Index calls with one month to
expiration against a long position in
the S&P.
Historical Data
Compound Annual
Returns
Standard Deviation
Return and Volatility
 Over the last 10 years, selling
ATM puts earned 3.4% in income
per month, totaling to 40%
annually.
 And over the same 10 years, the
strategy showed a volatility of 12%
as compared to the S&P volatility
of 18%. The selling of at-the-
money 1-month puts realized
annual returns of 7.1%, slightly
below the annualized return of
7.3% for the S&P.
 The PUT index had the best return
on volatility with a Sharpe Ratio
that exceeded not only the S&P
500 but also the BXM.
Historical Data
More Recent Historical Data
Historical Data
Volatility Risk Premium
& Directional Skew
Writers of put options
effectively monetize the
volatility risk premium
(VRP) that leads to
systematically overpriced
options.
Volatility risk premium
results from the consistent
positive spread between
implied volatility and
realized volatility.
VRP & Directional Skew
Volatility Risk Premium
& Directional Skew
 The level of volatility
predicted regularly exceeds
the actual level of volatility
experienced.
 This higher predicted, or
implied, volatility adds to the
value of the option and
results in the calculation of an
option price greater than its
true value.
VRP & Directional Skew
Volatility Risk Premium
& Directional Skew
 In the prior ten years, the average one-month at-the-money volatility calculates to
20.1% while the actual realized volatility was 17.1%.
 This three point spread shows the overestimation for volatility due to option markets
pricing wider distribution of returns than is characteristically realized.
 Along with the excessive expectations of overall volatility, participants in the option
market have predicted greater probability of downward market moves than of upward
movements.
 This downside skew has typically been
overestimated, as the realized skew has
been less than what was expected.
Why VRP Exists?
Volatility Risk Premium
& Directional Skew
“One problem with buying equity puts
is that equity volatility tends to be very
expensive. Who is the natural seller
of equity puts? No one. Who is the
natural buyer of equity puts?
Everyone. The world is long equities,
and people like owning insurance, so
there is an excess of natural buyers
for equity puts. That is why equity
option prices are structurally
expensive.” – Colm O’Shea
Across Market
Conditions
The put selling strategy provides
steady returns in bullish market
environments and moderate
drawdowns in rapidly declining
market scenarios. Put selling
joined the S&P 500 66% of the
months the index finished up.
However, in down months, put
selling only saw 55% of the
downside of the S&P 500. During
up years of the S&P 500, put
selling lagged behind equities by
an average of 3.7%. In two recent
years that the S&P 500 was down,
the put selling strategy
outperformed the S&P 500 by 3%
and 14%.
Premiums Collected
Across Market Conditions
 The premiums collected on put writing vary with relation to the current market conditions. As
volatility increases, option prices increase as a result. This allows for put writers to collect
higher premiums on the puts they sell. And as a result, during the very volatile market
conditions of 2008, one-month at-the-money put writers were able to collect their highest
monthly premiums ever at 9.1%, as compared to the average monthly premium of 3.4%.
 Selling fully collateralized puts is less risky than buying equity outright. The reduction in
risk, as compared to outright stock purchases, is a result of the premium collection which
provides a cushion or buffer effect in the instance that share prices fall. This premium not
only reduces the maximum potential loss
that could be experienced, but also
provides a cushion from immediate
losses, as downside exposure to the
stock will not be incurred until the stock
price has already begun to fall.
 The cushioning effect against
losses increases alongside
increases of option premiums.
Therefore, as option
premiums and volatility
rapidly increased during the
financial collapse of 2008, so
did the related cushioning
effect. The expanded
cushioning effect, from the
collection of extremely high
annual premium of 62%, was
the main reason for put selling
outperforming the S&P 500
by 14% in 2008.
Historical Data
Strike Selection Variations
Variations
 One of the easiest aspects
to modify would be the
moneyness of the options
written.
 More risk-averse investors
would most likely desire to
sell puts that are far out of
the money.
 These writers would have a
lower likelihood of losses but
also collect lower premiums.
 The further the options are sold out-of-the-money,
the greater the Sharpe ratio and the greater the
reduction in annual returns.
Term Structure Variations
Variations
 Selling twelve-month puts instead of one-month puts allows for investors to
reduce annual transaction costs and operational costs.
 This method is not recommended though. Compared to selling 1-month puts, this
modification is less efficient at monetizing the VRP, collects lower premiums, and
has lower average returns and Sharpe ratio.
 In addition, there has been
a large decline in the
transaction costs for put
sellers as the bid-mid
spread has dropped from
14 bp to 6 bp. And thus,
this change results in more
efficiency for 1-month put
selling.
Term Structure: Anecdotal Reasoning
 “Often, the longer the duration of the option, the
lower the implied volatility, which makes
absolutely no sense….. Option-pricing models
assume that volatility increases with the square
root of time. This assumption may provide
reasonable approximations for shorter time
intervals, say one year or under, but if you have
a very low standard deviation, and you extend it
for a very long time, it doesn’t scale properly.
For example, if a one-year standard deviation is
5 percent, assuming that the nine-year standard
deviation will only be 15 percent is probably an
underestimate.” – Jamie Mai
Put Writing Summary
 Selling fully collateralized puts is less risky than buying
stocks.
 Put selling has similar returns to equities along with a
lower drawdown risk, which results in outperformance
during years of weak equity performance.
 Put selling has shown lower risk than buywrites when
both strategies focus on OTM options downside
directional skew that overestimates downward market
moves as compared to upward moves.
 Put writers are able to collect higher premiums as OTM
puts are overpriced compared to OTM calls.
Summary

Put Writing

  • 1.
    Put Writing Strategy “Alternativeto Long Only EquityAllocation”
  • 2.
    Put Writing (Selling)Strategy Overview:  Option Basics  Strategy Goals  What is Put Selling?  Covered Calls/ Buywrites  Historical Data  Volatility Risk Premium & Directional Skew  Across Market Conditions  Variations  Summary
  • 3.
    What is anOption? Option Basics An option is a contract that gives the purchaser the right, but not the obligation to buy or sell an underlying asset for a specified price, at or before a designated date.
  • 4.
  • 5.
  • 6.
    Profits for sellingoptions Option Basics
  • 7.
    Buying options atdifferent strike prices Option Basics
  • 8.
    Selling options atdifferent strike prices Option Basics
  • 9.
    Goals  Many investorsseek strategies that generate high current yields, low volatility, and strong returns in markets that are flat or slightly rising. There is a strong desire to find equity-like returns with less volatility than long only allocation to stocks. Strategy Goals  Put writing strategies and covered call strategies offer the ability to fulfill these goals. However, it will be shown that put writing is a more effective strategy than a covered call.
  • 10.
    Put Writing What isput selling? A put writing strategy involves selling a put option on a stock in order to collect a premium for agreeing to buy shares at a specific strike price should it drop below that level by expiration. Treasuries are usually held as collateral in amounts equal to the maximum possible losses.
  • 11.
    Covered Calls/ Buywrites CoveredCalls/ Buywrites  A covered call, also know as a buywrite, involves selling a call option while also buying the underlying security for which the option was written.  Put writing is the synthetic equivalent of a buywrite.
  • 12.
    Growth of OneDollar Historical Data  The Chicago Board of Exchange has created several option strategy benchmarks that give reasonable representations of put selling and buywrite strategies.  The S&P 500 PutWrite Index (PUT) invests cash at one- and three-month Treasury Bill rates and sells a sequence of one-month at-the-money S&P 500 puts. The treasury bills act as collateral in an amount equal to the maximum possible losses from the put sales.  The S&P 500 BuyWrite Index (BXM) sells at-the-money (ATM) S&P 500 Index calls with one month to expiration against a long position in the S&P.
  • 13.
  • 14.
    Return and Volatility Over the last 10 years, selling ATM puts earned 3.4% in income per month, totaling to 40% annually.  And over the same 10 years, the strategy showed a volatility of 12% as compared to the S&P volatility of 18%. The selling of at-the- money 1-month puts realized annual returns of 7.1%, slightly below the annualized return of 7.3% for the S&P.  The PUT index had the best return on volatility with a Sharpe Ratio that exceeded not only the S&P 500 but also the BXM. Historical Data
  • 15.
    More Recent HistoricalData Historical Data
  • 16.
    Volatility Risk Premium VolatilityRisk Premium & Directional Skew Writers of put options effectively monetize the volatility risk premium (VRP) that leads to systematically overpriced options. Volatility risk premium results from the consistent positive spread between implied volatility and realized volatility.
  • 17.
    VRP & DirectionalSkew Volatility Risk Premium & Directional Skew  The level of volatility predicted regularly exceeds the actual level of volatility experienced.  This higher predicted, or implied, volatility adds to the value of the option and results in the calculation of an option price greater than its true value.
  • 18.
    VRP & DirectionalSkew Volatility Risk Premium & Directional Skew  In the prior ten years, the average one-month at-the-money volatility calculates to 20.1% while the actual realized volatility was 17.1%.  This three point spread shows the overestimation for volatility due to option markets pricing wider distribution of returns than is characteristically realized.  Along with the excessive expectations of overall volatility, participants in the option market have predicted greater probability of downward market moves than of upward movements.  This downside skew has typically been overestimated, as the realized skew has been less than what was expected.
  • 19.
    Why VRP Exists? VolatilityRisk Premium & Directional Skew “One problem with buying equity puts is that equity volatility tends to be very expensive. Who is the natural seller of equity puts? No one. Who is the natural buyer of equity puts? Everyone. The world is long equities, and people like owning insurance, so there is an excess of natural buyers for equity puts. That is why equity option prices are structurally expensive.” – Colm O’Shea
  • 20.
    Across Market Conditions The putselling strategy provides steady returns in bullish market environments and moderate drawdowns in rapidly declining market scenarios. Put selling joined the S&P 500 66% of the months the index finished up. However, in down months, put selling only saw 55% of the downside of the S&P 500. During up years of the S&P 500, put selling lagged behind equities by an average of 3.7%. In two recent years that the S&P 500 was down, the put selling strategy outperformed the S&P 500 by 3% and 14%.
  • 21.
    Premiums Collected Across MarketConditions  The premiums collected on put writing vary with relation to the current market conditions. As volatility increases, option prices increase as a result. This allows for put writers to collect higher premiums on the puts they sell. And as a result, during the very volatile market conditions of 2008, one-month at-the-money put writers were able to collect their highest monthly premiums ever at 9.1%, as compared to the average monthly premium of 3.4%.  Selling fully collateralized puts is less risky than buying equity outright. The reduction in risk, as compared to outright stock purchases, is a result of the premium collection which provides a cushion or buffer effect in the instance that share prices fall. This premium not only reduces the maximum potential loss that could be experienced, but also provides a cushion from immediate losses, as downside exposure to the stock will not be incurred until the stock price has already begun to fall.
  • 22.
     The cushioningeffect against losses increases alongside increases of option premiums. Therefore, as option premiums and volatility rapidly increased during the financial collapse of 2008, so did the related cushioning effect. The expanded cushioning effect, from the collection of extremely high annual premium of 62%, was the main reason for put selling outperforming the S&P 500 by 14% in 2008. Historical Data
  • 23.
    Strike Selection Variations Variations One of the easiest aspects to modify would be the moneyness of the options written.  More risk-averse investors would most likely desire to sell puts that are far out of the money.  These writers would have a lower likelihood of losses but also collect lower premiums.  The further the options are sold out-of-the-money, the greater the Sharpe ratio and the greater the reduction in annual returns.
  • 24.
    Term Structure Variations Variations Selling twelve-month puts instead of one-month puts allows for investors to reduce annual transaction costs and operational costs.  This method is not recommended though. Compared to selling 1-month puts, this modification is less efficient at monetizing the VRP, collects lower premiums, and has lower average returns and Sharpe ratio.  In addition, there has been a large decline in the transaction costs for put sellers as the bid-mid spread has dropped from 14 bp to 6 bp. And thus, this change results in more efficiency for 1-month put selling.
  • 25.
    Term Structure: AnecdotalReasoning  “Often, the longer the duration of the option, the lower the implied volatility, which makes absolutely no sense….. Option-pricing models assume that volatility increases with the square root of time. This assumption may provide reasonable approximations for shorter time intervals, say one year or under, but if you have a very low standard deviation, and you extend it for a very long time, it doesn’t scale properly. For example, if a one-year standard deviation is 5 percent, assuming that the nine-year standard deviation will only be 15 percent is probably an underestimate.” – Jamie Mai
  • 26.
    Put Writing Summary Selling fully collateralized puts is less risky than buying stocks.  Put selling has similar returns to equities along with a lower drawdown risk, which results in outperformance during years of weak equity performance.  Put selling has shown lower risk than buywrites when both strategies focus on OTM options downside directional skew that overestimates downward market moves as compared to upward moves.  Put writers are able to collect higher premiums as OTM puts are overpriced compared to OTM calls. Summary

Editor's Notes

  • #5 With a call option, the buyer pays a premium for the right, but not the obligation to purchase the underlying asset for the strike price, at or before the expiration date. With a put option, the buyer pays a premium for the right, but not the obligation to sell the underlying asset for the strike price, at or before the expiration date. Therefore, the buyers of a call option will exercise their right when the underlying asset price is greater than the strike price.
  • #7 the seller or writer of option has profits limited to the premium but can have losses as great as the level the option reaches in the money.
  • #18 . This higher predicted, or implied, volatility adds to the value of the option and results in the calculation of an option price greater than its true value. Although the extent of this premium differs amongst indexes and single stock options, research has shown that the market has consistently overpriced put options for both. Through the last ten years, option markets have predicted higher than experienced overall volatility and directional skew. In contrast, the markets have moderately underestimated tail risk.
  • #20 Many investors want to hedge their short-term risk in equities and instead pay attention to the long term. The large amount of investors wanting this “insurance” results in there being a much greater amount of put buyers than sellers. This supply and demand situation creates the volatility risk premium as writers are able to demand premiums that greatly exceed the expected value of the protection provided by the put option. This premium is expected to continue and not diminish due to arbitrage. This is because short volatility traders are not expected to outsize the hedging market and the supply from arbitrageurs has been small in comparison to the hedging market.
  • #22 Many options traders will express a view that selling puts is the worst thing to do in a down market. However, in the 2008 financial crisis, put writing significantly outperformed the S&P 500. In reality, this is because selling fully collateralized puts is less risky than buying equity outright. The reduction in risk, as compared to outright stock purchases, is a result of the premium collection which provides a cushion or buffer effect in the instance that share prices fall. This premium not only reduces the maximum potential loss that could be experienced, but also provides a cushion from immediate losses, as downside exposure to the stock will not be incurred until the stock price has already begun to fall. This cushioning effect increases alongside increases of option premiums. Therefore, as option premiums and volatility rapidly increased during the financial collapse of 2008, so did the related cushioning effect. The expanded cushioning effect, from the collection of extremely high annual premium of 62%, was the main reason for put selling outperforming the S&P 500 by 14% in 2008.
  • #26 I guess the reason is that the longer the time period, the greater the potential for a trend, and hence the greater the chance that a longer-term price move will exceed the standard deviation implied probability, which increases only by the square root of time. Yes. Wouldn’t that in turn imply that any long-term option is likely to be priced too low? We love long-term options.