Interimreport1 January–31 March2024 Elo Mutual Pension Insurance Company
Jp morgan investment funds income opportunity fund
1. JPMorgan Investment Funds Income Opportunity Fund
August 2013
All performance data relates to the Share Class: JPM A (acc) - USD
Fund overview
Quarterly Comments
Investment objective A
Review
To achieve a return in excess of the benchmark by
exploiting investment opportunities in, amongst others,
the debt and currency markets, using financial derivative
instruments where appropriate.
US economic data continued to surprise to the upside in the second quarter, providing a strong foundation for the Federal
Reserve to reduce the current pace of its asset purchases.
Fund statistics
Morningstar CategoryTM
Fund manager(s)
Client portfolio manager(s)
Fund launch date
Fund size (as at 31/08/13)
NAV (as at 30/08/13)
12M NAV High (as at
10/05/13)
12M NAV Low (as at
30/08/12)
Share class launch date
Average duration
Yield to maturity
Average maturity
USD Flexible
Bond
William Eigen
Jason Straker
19/07/07
USD 9393.1m
177.93
178.96
173.11
14/10/08
1.1 yrs
2.7%
3.0 yrs
(as at 30/06/13)
The fund's duration ended the quarter at 1.1 years. Excluding high yield (HY) bonds, the portfolio has a slight negative
duration. HY bonds have maintained strong returns year to date. We are paring this position down due to tightening
spreads. The fundamental story for being long beta in credit remains intact. In the coming months, we will maintain our
focus on lower quality HY bonds as the compensation for risk in Brated and select CCCrated names remains attractive
B
CCC
amid low prospective defaults and solid fundamentals. Although alternative credit has been a valuable source of returns
within our strategy, we have been reducing positions in this area on strength in pricing. Most of this capital is allocated to
shortdated HY credit default swaps. At the end of the quarter, we closed out of select positions while adding to a relative
short
value trade in the insurance industry given attractive levels. The fund's total short exposure represents 19% of long
exposure. Cash remains our largest hedge, ending the month with an allocation of 55%.
Outlook
Overall, we continue to adhere to the key tenets of the strategy, which is to target inefficiently priced areas of the market
while protecting against interest rate risk and general market volatility. We will deploy our free capital in line with the
opportunity set presented to us over time.
Benchmark
BBA Overnight USD LIBOR
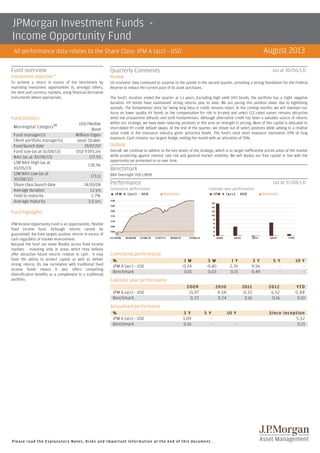
Performance
(as at 31/08/13)
Cumulative performance
s
J P M A ( a c c ) USD
Calendar year performance
s
Benchmark
s
J P M A ( a c c ) USD
s
Benchmark
Fund highlights
JPM Income Opportunity Fund is an opportunistic, flexible
fixed income fund. Although returns cannot be
guaranteed, the fund targets positive returns in excess of
cash regardless of market environment.
Because the fund can move flexibly across fixed income
markets investing only in areas which they believe
offer attractive future returns relative to cash it may
have the ability to protect capital as well as deliver
strong returns. Its low correlation with traditional fixed
income funds means it also offers compelling
diversification benefits as a complement to a traditional
portfolio.
Cumulative performance
%
JPM A (acc) USD
Benchmark
1 M
0.24
0.01
3 M
0.40
0.03
1 Y
2.76
0.15
3 Y
9.56
0.49
5 Y
10 Y
2012
6.52
0.16
YTD
0.88
0.10
Calendar year performance
JPM A (acc) USD
Benchmark
2009
15.97
0.23
2010
4.58
0.24
2011
0.33
0.16
Annualised performance
%
JPM A (acc) USD
Benchmark
3 Y
3.09
0.16
5 Y
Please read the Explanatory Notes, Risks and Important Information at the end of this document.
10 Y
Since inception
5.52
0.21
2. JPMorgan Investment Funds - Income Opportunity Fund
Fund facts
Investor suitability
Fund codes
ISIN
Bloomberg
Reuters
Investor profile
JPM A (acc)
USD
LU0323456466
JPHIOUA LX
LU0323456466.LUF
JPM C (acc)
USD
LU0323456896
JPMIOUH LX
LU0323456896.LUF
Fund charges
Initial charge (max.)
Redemption charge (max.)
Annual charges
Expenses
TER (Total Expense Ratio)
Performance fee
Key risks
JPM A (acc)
USD
3.00%
0.50%
1.00%
0.20%
1.20%
20.00%
JPM C (acc)
USD
0.00%
0.00%
0.55%
0.15%
0.70%
20.00%
Performance fee is 20% when the fund return exceeds the benchmark return. Please refer to the Fund's Prospectus for
conditions on the application of the performance fees.
(as at 31/08/13)
Statistical analysis review
Correlation
Alpha
Beta
Annualised volatility
Sharpe ratio
Tracking error
Information ratio
Value at Risk (VaR)
VaR
This is a total return bond SubFund aimed at investors looking for a return that exceeds
Sub
the benchmark while reducing the likelihood of capital losses on a medium term basis
through a flexible, diversified multisector approach, focusing on absolute returns and
multi
value generation from multiple sources. Since the SubFund isfocused on a bond universe
Sub
rather than on cash volatility, investors should have an investment horizon of at least
three to five years.
3 years
0.27
2.92
69.85
2.67
1.05
2.67
1.09
5 years
The value of your investment may fall as well as rise and you may get back less than you
originally invested.
The value of debt securities may change significantly depending on economic and interest
rate conditions as well as the credit worthiness of the issuer. Issuers of debt securitiesmay
fail to meet payment obligations or the credit rating of debt securities may be
downgraded. These risks are typically increased for below investment grade debt
securities which may also be subject to higher volatility and lower liquidity than
investment grade debt securities.
The credit worthiness of unrated debt securities is not measured by reference to an
independent credit rating agency.
The value of financial derivative instruments can be volatile. This is because a small
movement in the value of the underlying asset can cause a large movement in the value
of the financial derivative instrument and therefore, investment in such instruments may
result in losses in excess of the amount invested by the SubFund.
Sub
Movements in currency exchange rates can adversely affect the return of your investment.
The currency hedging that may be used to minimise the effect of currency fluctuations may
not always be successful.
(as at 31/08/13)
Fund
0.86%
Value at Risk (VaR) provides a measure of the potential loss that could arise over a given time interval under normal market
conditions, and at a given confidence level. The VaR approach is measured at a 99% confidence level and based on a time
horizon of one month. The holding period relating to the financial derivative instruments, for the purpose of calculating global
exposure, is one month.
Please read the Explanatory Notes, Risks and Important Information at the end of this document.
3. JPMorgan Investment Funds - Income Opportunity Fund
Holdings
Bond quality breakdown B
AAA
AA
A
BBB
< BBB
Non Rated
Cash
Percentage of Corporate
Bonds
Non Investment Grade
(as at
31/08/13)
3.7%
0.9%
0.6%
2.2%
33.0%
3.0%
56.6%
36.5%
33.0%
(as at 31/08/13)
10 largest holdings
Bond holding
Federal Farm Credit Banks (United States)
Toronto Dominion Bank (United States)
US Treasury (United States)
US Treasury (United States)
Mont Blanc Capital (United States)
Westpac Bank (Australia)
FNMA (United States)
DNB (Norway)
Mitsubishi UFJ (United States)
World Bank (International)
Coupon rate
0.000%
0.300%
0.000%
0.250%
0.000%
0.274%
2.750%
0.235%
0.330%
0.000%
Strategy Split
Sector
Corporate Credit and High Yiel
Credit: ABS/MBS
Others
Global Sovereign/EMD
Cash
Total
Geographical breakdown
Country
United States
Australia
United Kingdom
Canada
Sweden
Netherlands
Japan
Luxembourg
Chile
Others
Total
Please read the Explanatory Notes, Risks and Important Information at the end of this document.
Maturity date C
11/09/13
14/05/14
19/09/13
31/01/14
10/12/13
28/05/14
13/03/14
16/12/13
20/12/13
16/09/13
Weight
1.1%
1.1%
1.1%
1.1%
0.9%
0.8%
0.8%
0.8%
0.8%
0.8%
(as at 31/08/13)
Fund
36.5%
5.7%
1.2%
0.1%
56.5%
100.0%
(as at 31/08/13)
Fund
72.4%
3.2%
3.1%
2.8%
2.8%
2.3%
2.0%
1.7%
1.6%
8.1%
100.0%