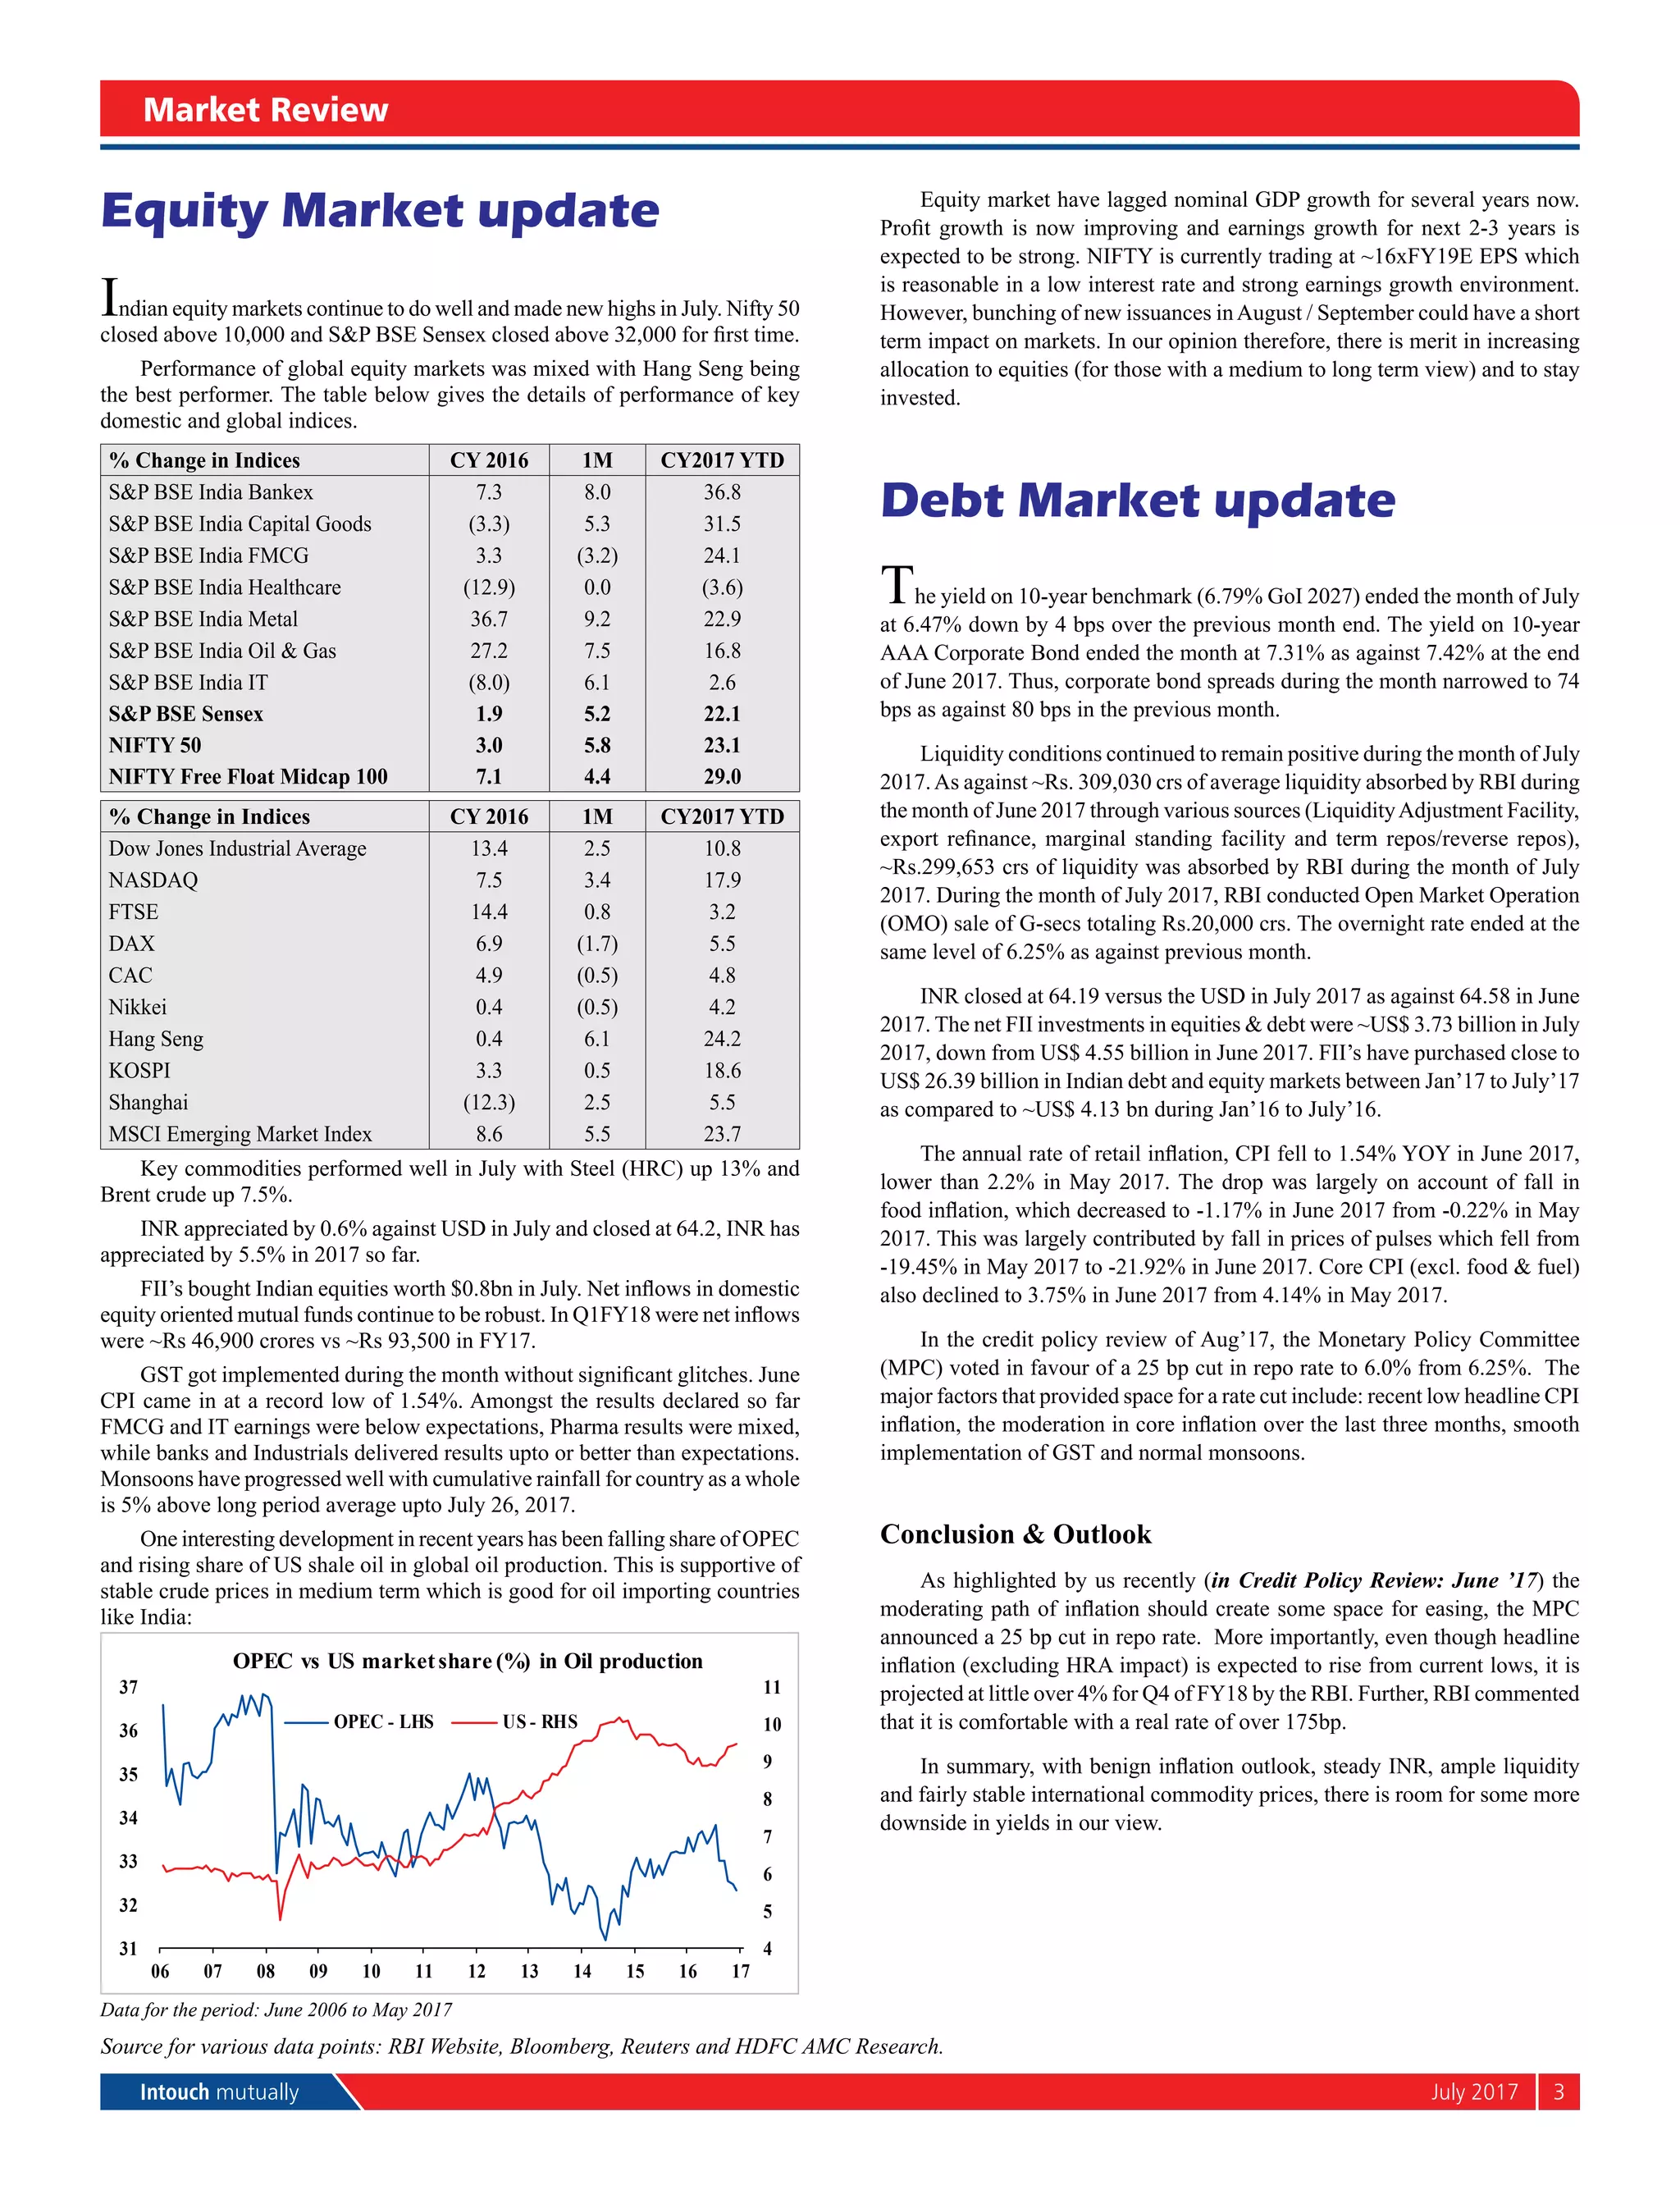
SlideShare a Scribd company logo
July 2017
2	 July 2017	 Intouch mutually
	 Fund Manager
An employee of the asset management company such as a mutual fund or life insurer,
who manages investments of the scheme. He is usually part of a larger team of fund
managers and research analysts.
	 Application Amount for Fresh Subscription
This is the minimum investment amount for a new investor in a mutual fund scheme.
	 Minimum Additional Amount
This is the minimum investment amount for an existing investor in a mutual fund scheme.
	 Yield to Maturity
The Yield to Maturity or the YTM is the rate of return anticipated on a bond if held until
maturity. YTM is expressed as an annual rate. The YTM factors in the bond’s current
market price, par value, coupon interest rate and time to maturity.
	 SIP
SIP or systematic investment plan works on the principle of making periodic investments
of a fixed sum. It works similar to a recurring bank deposit. For instance, an investor
may opt for an SIP that invests Rs 500 every 15th of the month in an equity fund for a
period of three years.
	 NAV
The NAV or the net asset value is the total asset value per unit of the mutual fund after
deducting all related and permissible expenses. The NAV is calculated at the end of
every business day. It is the value at which the investor enters or exits the mutual fund.
	 Benchmark
A group of securities, usually a market index, whose performance is used as a standard
or benchmark to measure investment performance of mutual funds, among other
investments. Some typical benchmarks include the NIFTY, Sensex, BSE200, BSE500,
10-Year Gsec.
	 Entry Load
A mutual fund may have a sales charge or load at the time of entry and/or exit to
compensate the distributor/agent. Entry load is charged at the time an investor
purchases the units of a mutual fund.
The entry load is added to the prevailing NAV at the time of investment. For instance, if
the NAV is Rs. 100 and the entry load is 1 %, the investor will enter the fund at Rs. 101.
(Note: SEBI, vide circular dated June 30, 2009 has abolished entry load and mandated
that the upfront commission to distributors will be paid by the investor directly to the
distributor, based on his assessment of various factors including the service rendered
by the distributor).
	 Exit Load
Exit load is charged at the time an investor redeems the units of a mutual fund. The exit
load is reduced from the prevailing NAV at the time of redemption. The investor will
receive redemption proceed at net value of NAV less Exit Load. For instance if the NAV is
Rs. 100 and the exit load is 1%, the investor will receive Rs. 99.
	 Modified Duration
Modified duration is the price sensitivity and the percentage change in price for a unit
change in yield.
	 Standard Deviation
Standard deviation is a statistical measure of the range of an investment’s performance.
When a mutual fund has a high standard deviation, its means its range of performance
is wide, implying greater volatility.
	 Sharpe Ratio
The Sharpe Ratio, named after its founder, the Nobel Laureate William Sharpe, is a
measure of risk-adjusted returns. It is calculated using standard deviation and excess
return to determine reward per unit of risk.
	 Beta Ratio (Portfolio Beta)
Beta is a measure of an investment’s volatility vis-a-vis the market. Beta of less than 1
means that the security will be less volatile than the market. A beta of greater than 1
implies that the security’s price will be more volatile than the market.
	 Average portfolio PE (Average P/E)
It is price to earnings ratio of the stocks calculated for the entire portfolio on a weighted
average basis.
	 Average portfolio price to book ratio (Average P/BV)
It is price to book value of the stocks calculated for the entire portfolio on a weighted
average basis.
	 Average portfolio dividend yield (Average Dividend Yield)
It is dividend yield of the stocks calculated for the entire portfolio on a weighted average
basis.
	 Net Equity
Net equity level is the net equity exposure percentage adjusted for any derivative
positions in stocks or index for hedging or rebalancing purpose.
	 R Squared
It is a statistical measure of how closely the portfolio returns are correlated with its
benchmark.
	 AUM
AUM or assets under management refers to the recent / updated cumulative market
value of investments managed by a mutual fund or any investment firm.
	 Holdings
The holdings or the portfolio is a mutual fund’s latest or updated reported statement of
investments/securities. These are usually displayed in terms of percentage to net assets
or the rupee value or both. The objective is to give investors an idea of where their
money is being invested by the fund manager.
	 Nature of Scheme
The investment objective and underlying investments determine the nature of the mutual
fund scheme. For instance, a mutual fund that aims at generating capital appreciation by
investing in stock markets is an equity fund or growth fund. Likewise, a mutual fund that
aims at capital preservation by investing in debt markets is a debt fund or income fund.
Each of these categories may have sub-categories.
	 Rating Profile
Mutual funds invest in securities after evaluating their creditworthiness as disclosed by
the ratings. A depiction of the mutual fund in various investments based on their ratings
becomes the rating profile of the fund. Typically, this is a feature of debt funds.
HOW TO READ FACTSHEET
	 Sharpe Ratio
Sharpe Ratio is a risk to reward ratio, it measures portfolio returns generated in excess
to the investment in risk-free asset, for per unit of total risk taken. While, positive Sharpe
ratio indicates, portfolio compensating investors with excess returns (over risk-free rate)
for the commensurate risk taken; negative Sharpe ratio indicates, investors are better off
investing in risk-free assets.
	 Beta
Beta (ß) of a portfolio is a number indicating the relation between portfolio returns with
that of the market index i.e. it measure the volatility, or systematic risk, of a portfolio in
comparison to the market as a whole.
	 Modified Duration
A formula that expresses the measurable change in the value of a security in response
to a change in interest rates. Modified duration of portfolio can be used to anticipate the
change in market value of portfolio for every change in portfolio yield.
	 Standard Deviation
A statistical measure that defines expected volatility/risk associated with a portfolio.
This explains the variation/deviation from the average returns delivered by the portfolio.
A higher standard deviation means higher volatility (risk) and a lower standard deviation
means lower volatility.
	 Risk Free Return
The theoretical rate of return of an investment with safest (zero risk) investment in a country.
	 Tracking Error
Tracking error indicates how closely the portfolio return is tracking the benchmark Index
return. It measures the deviation between portfolio return and benchmark index return. A
lower tracking error indicates portfolio closely tracking benchmark index and higher tracking
error indicates portfolio returns with higher deviation from benchmark index returns.
	 Total Expense Ratio
Total expenses charged to scheme for the month expressed as a percentage to average
monthly net assets.
	 Average Maturity
Weighted average maturity of the securities in scheme.
	 Portfolio Yield (Yield To Maturity)
Weighted average yield of the securities in scheme portfolio.
	 Portfolio Turnover Ratio
Portfolio Turnover Ratio is the percentage of a fund’s holdings that have changed in a
given year. This ratio measures the fund’s trading activity, which is computed by taking
the lesser of purchases or sales and dividing by average monthly net assets.
GLOSSARY
Intouch mutually	 July 2017	3
Market Review
Source for various data points: RBI Website, Bloomberg, Reuters and HDFC AMC Research.
Equity Market update
Indian equity markets continue to do well and made new highs in July. Nifty 50
closed above 10,000 and S&P BSE Sensex closed above 32,000 for first time.
Performance of global equity markets was mixed with Hang Seng being
the best performer. The table below gives the details of performance of key
domestic and global indices.
% Change in Indices CY 2016 1M CY2017 YTD
S&P BSE India Bankex 7.3 8.0 36.8
S&P BSE India Capital Goods (3.3) 5.3 31.5
S&P BSE India FMCG 3.3 (3.2) 24.1
S&P BSE India Healthcare (12.9) 0.0 (3.6)
S&P BSE India Metal 36.7 9.2 22.9
S&P BSE India Oil & Gas 27.2 7.5 16.8
S&P BSE India IT (8.0) 6.1 2.6
S&P BSE Sensex 1.9 5.2 22.1
NIFTY 50 3.0 5.8 23.1
NIFTY Free Float Midcap 100 7.1 4.4 29.0
% Change in Indices CY 2016 1M CY2017 YTD
Dow Jones Industrial Average 13.4 2.5 10.8
NASDAQ 7.5 3.4 17.9
FTSE 14.4 0.8 3.2
DAX 6.9 (1.7) 5.5
CAC 4.9 (0.5) 4.8
Nikkei 0.4 (0.5) 4.2
Hang Seng 0.4 6.1 24.2
KOSPI 3.3 0.5 18.6
Shanghai (12.3) 2.5 5.5
MSCI Emerging Market Index 8.6 5.5 23.7
Key commodities performed well in July with Steel (HRC) up 13% and
Brent crude up 7.5%.
INR appreciated by 0.6% against USD in July and closed at 64.2, INR has
appreciated by 5.5% in 2017 so far.
FII’s bought Indian equities worth $0.8bn in July. Net inflows in domestic
equity oriented mutual funds continue to be robust. In Q1FY18 were net inflows
were ~Rs 46,900 crores vs ~Rs 93,500 in FY17.
GST got implemented during the month without significant glitches. June
CPI came in at a record low of 1.54%. Amongst the results declared so far
FMCG and IT earnings were below expectations, Pharma results were mixed,
while banks and Industrials delivered results upto or better than expectations.
Monsoons have progressed well with cumulative rainfall for country as a whole
is 5% above long period average upto July 26, 2017.
One interesting development in recent years has been falling share of OPEC
and rising share of US shale oil in global oil production. This is supportive of
stable crude prices in medium term which is good for oil importing countries
like India:
OPEC vs US marketshare (%) in Oil production
4
5
6
7
8
9
10
11
31
32
33
34
35
36
37
06 07 08 09 10 11 12 13 14 15 16 17
OPEC - LHS US - RHS
Data for the period: June 2006 to May 2017
Equity market have lagged nominal GDP growth for several years now.
Profit growth is now improving and earnings growth for next 2-3 years is
expected to be strong. NIFTY is currently trading at ~16xFY19E EPS which
is reasonable in a low interest rate and strong earnings growth environment.
However, bunching of new issuances inAugust / September could have a short
term impact on markets. In our opinion therefore, there is merit in increasing
allocation to equities (for those with a medium to long term view) and to stay
invested.
Debt Market update
The yield on 10-year benchmark (6.79% GoI 2027) ended the month of July
at 6.47% down by 4 bps over the previous month end. The yield on 10-year
AAA Corporate Bond ended the month at 7.31% as against 7.42% at the end
of June 2017. Thus, corporate bond spreads during the month narrowed to 74
bps as against 80 bps in the previous month.
Liquidity conditions continued to remain positive during the month of July
2017.As against ~Rs. 309,030 crs of average liquidity absorbed by RBI during
the month of June 2017 through various sources (LiquidityAdjustment Facility,
export refinance, marginal standing facility and term repos/reverse repos),
~Rs.299,653 crs of liquidity was absorbed by RBI during the month of July
2017. During the month of July 2017, RBI conducted Open Market Operation
(OMO) sale of G-secs totaling Rs.20,000 crs. The overnight rate ended at the
same level of 6.25% as against previous month.
INR closed at 64.19 versus the USD in July 2017 as against 64.58 in June
2017. The net FII investments in equities & debt were ~US$ 3.73 billion in July
2017, down from US$ 4.55 billion in June 2017. FII’s have purchased close to
US$ 26.39 billion in Indian debt and equity markets between Jan’17 to July’17
as compared to ~US$ 4.13 bn during Jan’16 to July’16.
The annual rate of retail inflation, CPI fell to 1.54% YOY in June 2017,
lower than 2.2% in May 2017. The drop was largely on account of fall in
food inflation, which decreased to -1.17% in June 2017 from -0.22% in May
2017. This was largely contributed by fall in prices of pulses which fell from
-19.45% in May 2017 to -21.92% in June 2017. Core CPI (excl. food & fuel)
also declined to 3.75% in June 2017 from 4.14% in May 2017.
In the credit policy review of Aug’17, the Monetary Policy Committee
(MPC) voted in favour of a 25 bp cut in repo rate to 6.0% from 6.25%. The
major factors that provided space for a rate cut include: recent low headline CPI
inflation, the moderation in core inflation over the last three months, smooth
implementation of GST and normal monsoons.
Conclusion & Outlook
As highlighted by us recently (in Credit Policy Review: June ’17) the
moderating path of inflation should create some space for easing, the MPC
announced a 25 bp cut in repo rate. More importantly, even though headline
inflation (excluding HRA impact) is expected to rise from current lows, it is
projected at little over 4% for Q4 of FY18 by the RBI. Further, RBI commented
that it is comfortable with a real rate of over 175bp.
In summary, with benign inflation outlook, steady INR, ample liquidity
and fairly stable international commodity prices, there is room for some more
downside in yields in our view.
4	 July 2017	 Intouch mutually
CONTENTS
Page No.
Wealth Creation Solutions
Actively Managed Funds
Hdfc Growth Fund............................................................................... 5
Hdfc Equity Fund................................................................................. 6
Hdfc Top 200 Fund.............................................................................. 7
Hdfc Capital Builder Fund.................................................................... 8
Hdfc Core & Satellite Fund................................................................... 9
Hdfc Premier Multi-Cap Fund............................................................... 10
Hdfc Large Cap Fund........................................................................... 11
Hdfc Mid-Cap Opportunities Fund....................................................... 12
Hdfc Small Cap Fund........................................................................... 13
Hdfc Infrastructure Fund...................................................................... 14
Hdfc Balanced Fund............................................................................. 15-16
Hdfc Prudence Fund............................................................................ 18-19
Hdfc Equity Savings Fund.................................................................... 16-17
Passively Managed Funds
Hdfc Index Fund - Sensex Plan........................................................... 21
Hdfc Index Fund - Nifty Plan.............................................................. 22
Hdfc Index Fund - Sensex Plus Plan.................................................... 23
Hdfc Sensex Etf................................................................................. 24
Hdfc Nifty Etf.................................................................................... 25
Tax Savings Solutions
Hdfc Long Term Advantage Fund......................................................... 26
Hdfc Taxsaver...................................................................................... 27
Goal Oriented Solutions
Hdfc Children’s Gift Fund - Investment Plan......................................... 28
Hdfc Children’s Gift Fund - Savings Plan.............................................. 29
Hdfc Retirement Savings Fund - Equity Plan......................................... 30
Hdfc Retirement Savings Fund - Hybrid Equity Plan............................. 31
Hdfc Retirement Savings Fund - Hybrid Debt Plan................................ 32
Page No.
Regular Income Solutions
Hdfc MF Monthly Income Plan - Short Term Plan................................. 33
Hdfc MF Monthly Income Plan - Long Term Plan.................................. 34
Hdfc Multiple Yield Fund - Plan 2005.................................................. 35
Savings Solutions
Hdfc Arbitrage Fund............................................................................ 19-20
Hdfc Income Fund............................................................................... 36
Hdfc High Interest Fund - Dynamic Plan............................................... 37
Hdfc High Interest Fund - Short Term Plan........................................... 38
Hdfc Regular Savings Fund.................................................................. 39
Hdfc Short Term Opportunities Fund.................................................... 40
Hdfc Medium Term Opportunities Fund............................................... 41
Hdfc Gilt Fund - Short Term Plan.......................................................... 42
Hdfc Gilt Fund - Long Term Plan.......................................................... 43
Hdfc Floating Rate Income Fund - Short Term Plan............................... 44
Hdfc Floating Rate Income Fund - Long Term Plan............................... 45
Hdfc Liquid Fund................................................................................. 46
Hdfc Cash Management Fund - Savings Plan....................................... 47
Hdfc Cash Management Fund - Treasury Advantage Plan.................... 48
Hdfc Corporate Debt Opportunities Fund............................................. 49
Hdfc Banking and Psu Debt Fund........................................................ 50
Performance details of schemes
managed by respective fund managers .................................... 51
Scheme performance summary - Regular Plans ........................ 52-58
Scheme performance summary - Direct Plans ........................... 59-69
Performance of Category I - FPI Portfolio .................................. 69
Dividend History ...................................................................... 70-72
Disclaimer ................................................................................ 72
Our range of offerings
Wealth Creation
Solutions
These schemes aim to increase your wealth over the long term by investing predominantly in equity instruments and it is suitable for
investors with high risk appetite and relatively higher investment horizon.
Tax Savings
Solutions
These schemes are eligible to provide tax deduction under Sec 80C and also aim to increase your wealth over the long term. This is an
ideal solution for investors who would like to create wealth and save tax.
Goal Oriented
Solutions
These schemes aim to help you achieve your specific financial goals. It is ideal for investors planning for their retirement, future expenses
like higher education of children, etc. Investors can choose from aggressive to conservative options based on their risk profile and time
horizon.
Regular Income
Solutions
These schemes aim to provide you with regular income. It is ideal for investors with medium risk appetite who wish to receive regular
cash flows to meet specific needs like post retirement expenses, EMI, etc. at a fixed time horizon, e.g. monthly, quarterly, etc. These
schemes have relatively lower equity exposure.
Savings Solutions These schemes aim to preserve your capital and provide you with ready liquidity by investing in debt and money market instruments. It
is suitable for investors with low to medium risk appetite across time horizons (Short, Medium and Long term)
Disclaimer: Investors are requested to note that the above investment solution(s) should not be construed as financial planning solution/recommendation by the Fund/
AMC. It does not in any manner, indicate or imply either the quality of any particular Scheme or guarantee any specific performance/returns. Such solutions must be tailored
to investor’s individual situation and objectives and therefore, investors should consult their financial advisors to ascertain whether the product is suitable for them.
Intouch mutually	 July 2017	5
	 investment objective
To generate long term capital appreciation from a portfolio
that is invested predominantly in equity and equity related
instruments.
	 Fund Manager ¥
Srinivas Rao Ravuri (since April 3, 06)
Total Experience: Over 22 years
	 Inception Date (Date of Allotment)
September 11, 2000
	 NAV (as on July 31, 2017)	 NAV per Unit (`)
Regular Plan - Growth Option	 175.778
Regular Plan - Dividend Option	 32.613
Direct Plan - Growth Option	 180.122
Direct Plan - Dividend Option	 33.622
	 aSSETS UNDER MANAGEMENT	 (`) IN CRORE
As on July 31, 2017	 1,146.91
Average for Month of July, 2017	 1,123.28
	 quantitative data
Portfolio Turnover Ratio (Last 1 year)	 35.98%
Risk Ratio
n	 Standard Deviation	 4.277%
n	 Beta	 1.037
n	 Sharpe Ratio*	 0.147
Computed for the 3-yr period ended July 31, 2017.
Based on month-end NAV.
* Risk free rate: 6.25% (Source: FIMMDA MIBOR)
	 Total Expense Ratio (Weighted Average for the month)
Excluding Goods and Service Tax on Management Fees
Regular	 2.30%
Direct	1.65%
l	 #BENCHMARK INDEX: S&P BSE SENSEX
l	 ##addl. BENCHMARK INDEX: NIFTY 50 Index
	 Exit Load
l	 In respect of each purchase / switch-in of Units, an Exit
Load of 1.00% is payable if Units are redeemed / switched-
out within 1 year from the date of allotment.
l	 No Exit Load is payable if Units are redeemed / switched-
out after 1 year from the date of allotment.
For further details, please refer to para ‘Exit Load’ on Pg 51.
l	 PlanS & Options
Regular Plan, Direct Plan. Under Each Plan : Growth &
Dividend. The Dividend Option offers Dividend Payout and
Reinvestment facility.
	 Minimum Application Amount
Purchase : ` 5,000 and any amount thereafter.
Additional Purchase : ` 1,000 and any amount thereafter.
	 Redemption Proceeds
Normally despatched within 3-4 Business Days.
¥ Dedicated Fund Manager for Overseas Investments:
Mr Rakesh Vyas (Total Experience: Over 10 years).
HDFC Growth Fund (An open-ended growth scheme)
Face Value per Unit: ` 10 unless otherwise specified, + Industry Classification as recommended by AMFI, Data is as of July 31, 2017 unless otherwise specified.
SIP Performance^ - Regular Plan - Growth Option
Since Inception
SIP
15 year
SIP
10 year
SIP
5 year
SIP
3 year
SIP
1 year
SIP
Total Amount Invested (` ‘000) 2,030.00 1,800.00 1,200.00 600.00 360.00 120.00
Mkt Value as on July 31, 2017 (` ‘000) 13,347.35 8,317.08 2,506.18 926.60 463.47 138.50
Returns (Annualised) (%) 19.65 18.42 14.10 17.43 17.13 29.93
Benchmark Returns (Annualised) (%) # 14.01 13.51 10.47 12.30 11.43 25.85
Addl. Benchmark Ret. (Annualised) (%) ## 13.94 13.57 11.01 13.26 12.60 26.58
Assuming ` 10,000 invested systematically on the first Business Day of every month over a period of time. CAGR returns are computed
after accounting for the cash flow by using XIRR method (investment internal rate of return) for Regular Plan - Growth Option. The above
investmentsimulationisforillustrativepurposesonlyandshouldnotbeconstruedasapromiseonminimumreturnsandsafeguardofcapital.
Performance^ - Regular Plan - Growth Option
Date Period Scheme
Returns
(%)
Benchmark
Returns
(%)#
Additional
Benchmark
Returns
(%) ##
Value of ` 10,000 invested
Scheme (`) Benchmark
(`)#
Additional
Benchmark
(`)##
Jul 29, 16 Last 1 Year 22.27 15.82 16.56 12,240 11,591 11,665
Jul 31, 14 Last 3 Years 13.51 7.88 9.27 14,630 12,556 13,051
Jul 31, 12 Last 5 Years 16.22 13.53 14.01 21,215 18,864 19,272
Sep 11, 00 Since Inception 18.49 12.13 12.13 175,778 69,231 69,194
Returns greater than 1 year period are compounded annualized (CAGR). For performance of other schemes managed by Srinivas
Rao Ravuri, please refer page 51. Different plans viz. Regular Plan and Direct Plan have a different expense structure. The expenses
of the Direct Plan under the Scheme will be lower to the extent of the distribution expenses / commission charged in the Regular
Plan. For Performance of Direct Plan, refer page no. 59.
This product is suitable for investors who are seeking ~
l	 Capital appreciation over long term.
l	 Investment predominantly in equity and equity related
instruments.
Riskometer
Investors understand that their principal will be at
moderately high risk
~ Investors should consult their financial advisers if in doubt
about whether the product is suitable for them.
Portfolio
Company Industry+ % to NAV
Equity & Equity Related
•	HDFC Bank Ltd. Banks 9.97
•	State Bank of India Banks 8.37
•	ICICI Bank Ltd. Banks 6.68
•	ITC Ltd. Consumer Non Durables 6.22
•	Larsen & Toubro Ltd. Construction Project 5.45
•	Infosys Ltd. Software 5.24
•	Reliance Industries Ltd. Petroleum Products 4.36
•	Housing Development
Finance Corporation Ltd.£ Finance 3.83
•	Maruti Suzuki India Ltd. Auto 3.38
•	Vedanta Ltd. Non - Ferrous Metals 3.25
Oil&NaturalGasCorporationLtd. Oil 2.66
Power Grid Corporation of
India Ltd. Power 2.63
Adani Ports and Special
Economic Zone Ltd. Transportation 2.44
GAIL (India) Ltd. Gas 2.38
Axis Bank Ltd. Banks 2.22
Tata Motors Ltd. DVR Auto 2.06
Dilip Buildcon Ltd. Construction 1.92
Coal India Ltd. Minerals/Mining 1.77
Cipla Ltd. Pharmaceuticals 1.74
Solar Industries India Ltd. Chemicals 1.72
DLF Ltd. Construction 1.60
Kalpataru Power
Transmission Ltd. Power 1.48
NTPC Ltd. Power 1.47
Eimco Elecon (India) Ltd. Industrial Capital Goods 1.46
Aurobindo Pharma Ltd. Pharmaceuticals 1.41
Tata Steel Ltd. Ferrous Metals 1.24
Tata Communications Ltd. Telecom - Services 1.22
Hindalco Industries Ltd. Non - Ferrous Metals 1.22
KCP Ltd. Cement 1.22
Bank of Baroda Banks 1.17
Tata Consultancy Services Ltd. Software 1.00
JMC Projects (India) Ltd. Construction 0.99
HPL Electric and Power Ltd. Consumer Durables 0.84
Company Industry+ % to NAV
Mahindra & Mahindra Ltd. Auto 0.76
Sun Pharmaceuticals
Industries Ltd. Pharmaceuticals 0.57
Jaiprakash Power Ventures Ltd. Power 0.50
C & C Constructions Ltd. Construction 0.48
Pennar Engineered Bldg
Systems Ltd Ferrous Metals 0.29
KSK Energy Ventures Ltd. Power 0.12
Sub Total 97.33
Preference Shares
Vedanta Ltd. Non - Ferrous Metals 0.34
Sub Total 0.34
Total 97.67
Cash, Cash Equivalents and Net Current Assets 2.33
Grand Total 100.00
•	Top Ten Holdings, £ Co-sponsor
0.84
1.22
1.22
1.46
1.53
1.72
1.77
2.38
2.44
2.66
3.72
3.83
4.36
4.81
4.99
5.45
6.20
6.20
6.22
6.24
28.41
0 5 10 15 20 25 30
Consumer Durables
Cement
Telecom - Services
Industrial Capital Goods
Ferrous Metals
Chemicals
Minerals/Mining
Gas
Transportation
Oil
Pharmaceuticals
Finance
Petroleum Products
Non - Ferrous Metals
Construction
Construction Project
Power
Auto
Consumer Non Durables
Software
Banks
Industry Allocation of Equity Holding (% of Net Assets)
^Past performance may or may not be sustained in the future. Load is not taken into consideration for computation of performance.
6	 July 2017	 Intouch mutually
l	 investment objective
To achieve capital appreciation.
l	 Fund Manager § ¥
Prashant Jain (since June 19, 03)
Total Experience: Over 26 years
l	 Inception Date (Date of Allotment)
January 1, 1995
	 NAV (as on July 31, 2017)	 NAV per Unit (`)
Regular Plan - Growth Option	 608.029
Regular Plan - Dividend Option	 57.088
Direct Plan - Growth Option	 629.819
Direct Plan - Dividend Option	 59.664
	 aSSETS UNDER MANAGEMENT	 (`) IN CRORE
As on July 31, 2017	 20,350.41
Average for Month of July, 2017	 19,879.43
l	 quantitative data
Portfolio Turnover Ratio (Last 1 year)	 24.10%
Risk Ratio
n	 Standard Deviation	 4.784%
n	 Beta	 1.142
n	 Sharpe Ratio*	 0.133
Computed for the 3-yr period ended July 31, 2017. Based on
month-endNAV.*Riskfreerate:6.25%(Source:FIMMDAMIBOR)
	 Total Expense Ratio (Weighted Average for the month)
Excluding Goods and Service Tax on Management Fees
Regular: 2.05%	 Direct: 1.15%
l	 #BENCHMARK INDEX: NIFTY 500 Index
l	 ##addl. BENCHMARK INDEX: NIFTY 50 Index
l	 Exit Load
l	 In respect of each purchase / switch-in of Units, an Exit Load
of 1.00% is payable if Units are redeemed / switched-out
within 1 year from the date of allotment.
l	 No Exit Load is payable if Units are redeemed / switched-out
after 1 year from the date of allotment.
For further details, please refer to para ‘Exit Load’ on Pg 51.
l	 PlanS & Options
Regular Plan, Direct Plan. Under Each Plan : Growth &
Dividend. The Dividend Option offers Dividend Payout and
Reinvestment facility.
l	 Minimum Application Amount
Purchase : ` 5,000 and any amount thereafter.
Additional Purchase : ` 1,000 and any amount thereafter.
l	 Redemption Proceeds
Normally despatched within 3-4 Business Days.
§ DateofmigrationfromZurichIndiaMutualFund(Closeofbusiness
hours - June 19, 03. ¥ Dedicated Fund Manager for Overseas
Investments: Mr Rakesh Vyas (Total Experience: Over 10 years).
HDFC Equity Fund (An open-ended growth scheme)
SIP Performance^ - Regular Plan - Growth Option
Since Inception
SIP
15 year
SIP
10 year
SIP
5 year
SIP
3 year
SIP
1 year
SIP
Total Amount Invested (` ‘000) 2,710.00 1,800.00 1,200.00 600.00 360.00 120.00
Mkt Value as on July 31, 2017 (` ‘000) 65,996.29 10,070.26 2,836.11 970.37 465.03 140.23
Returns (Annualised) (%) 23.40 20.59 16.40 19.32 17.37 32.85
Benchmark Returns (Annualised) (%) # 13.90 14.57 12.48 16.26 15.41 28.75
Addl. Benchmark Ret. (Annualised) (%) ## 12.66 13.57 11.01 13.26 12.60 26.58
Assuming ` 10,000 invested systematically on the first Business Day of every month over a period of time. CAGR returns are computed
after accounting for the cash flow by using XIRR method (investment internal rate of return) for Regular Plan - Growth Option. The above
investment simulation is for illustrative purposes only and should not be construed as a promise on minimum returns and safeguard of capital.
Face Value per Unit: ` 10 unless otherwise specified, + Industry Classification as recommended by AMFI, Data is as of July 31, 2017 unless otherwise specified.
Performance^ - Regular Plan - Growth Option
Date Period Scheme
Returns
(%)
Benchmark
Returns
(%)#
Additional
Benchmark
Returns
(%) ##
Value of ` 10,000 invested
Scheme (`) Benchmark
(`)#
Additional
Benchmark
(`)##
Jul 29, 16 Last 1 Year 25.23 19.84 16.56 12,538 11,996 11,665
Jul 31, 14 Last 3 Years 13.32 12.38 9.27 14,557 14,195 13,051
Jul 31, 12 Last 5 Years 18.96 16.33 14.01 23,832 21,310 19,272
Jan 01, 95 Since Inception 19.94 10.10 N.A. 608,029 87,933 N.A.
Returns greater than 1 year period are compounded annualized (CAGR). N.A. Not Available. For performance of other schemes managed
by Prashant Jain, please refer page 51. Different plans viz. Regular Plan and Direct Plan have a different expense structure. The expenses
of the Direct Plan under the Scheme will be lower to the extent of the distribution expenses / commission charged in the Regular Plan. For
Performance of Direct Plan, refer page no. 59.
This product is suitable for investors who are seeking ~
l	 Capital appreciation over long term.
l	 Investment predominantly in equity and equity related
instruments of medium to large sized companies.
Riskometer
Investors understand that their principal will be at
moderately high risk
~ Investors should consult their financial advisers if in doubt
about whether the product is suitable for them.
Portfolio
Company Industry+ % to NAV
Equity & Equity Related
•	ICICI Bank Ltd. Banks 9.56
•	State Bank of India Banks 9.40
•	Larsen & Toubro Ltd. Construction Project 7.78
•	Infosys Ltd. Software 6.41
•	HDFC Bank Ltd. Banks 5.31
•	Maruti Suzuki India Ltd. Auto 4.50
•	Reliance Industries Ltd. Petroleum Products 4.00
•	Tata Steel Ltd. Ferrous Metals 3.09
•	Balkrishna Industries Ltd. Auto Ancillaries 3.07
•	CESC Ltd. Power 2.80
Power Grid Corporation of
India Ltd. Power 2.66
Bank of Baroda Banks 2.39
Aurobindo Pharma Ltd. Pharmaceuticals 2.21
Housing Development
Finance Corporation Ltd.£ Finance 1.87
Siemens Ltd. Industrial Capital Goods 1.81
UPL Ltd. Pesticides 1.75
Adani Ports and Special
Economic Zone Ltd. Transportation 1.73
Canara Bank Banks 1.71
Tata Motors Ltd. Auto 1.67
Avenue Supermarts Ltd. Retailing 1.56
BEML Ltd. Industrial Capital Goods 1.55
Info Edge (India) Ltd. Software 1.43
Crompton Greaves Ltd. Industrial Capital Goods 1.42
Tata Consultancy Services Ltd. Software 1.34
Vedanta Ltd. Non - Ferrous Metals 1.32
Prism Cement Ltd. Cement 1.31
Kalpataru Power
Transmission Ltd. Power 1.19
Punjab National Bank Banks 1.18
Rural Electrification
Corporation Ltd. Finance 1.08
GAIL (India) Ltd. Gas 1.01
Tata Motors Ltd. DVR Auto 0.98
Simplex Infrastructures Ltd. Construction 0.76
Dish TV India Ltd. Media & Entertainment 0.76
Time Technoplast Ltd. Industrial Products 0.75
Century Textiles &
Industries Ltd. Cement 0.71
Container Corporation of
India Ltd. Transportation 0.64
Tata Chemicals Ltd. Chemicals 0.61
Praj Industries Limited Industrial Capital Goods 0.60
Oriental Bank of Commerce Banks 0.60
Cipla Ltd. Pharmaceuticals 0.60
Hindustan Construction
Company Ltd. Construction Project 0.51
NTPC Ltd. Power 0.51
Siti Network Ltd. Media & Entertainment 0.41
Company Industry+ % to NAV
Oracle Financial Services
Software Ltd. Software 0.40
Sadbhav Infrastructure
Project Ltd Construction Project 0.33
Ramco Systems Ltd. Software 0.29
Crompton Greaves
Consumer Elec. Ltd Consumer Durables 0.28
Jaiprakash Power Ventures Ltd. Power 0.20
Gammon Infrastructure
Projects Ltd. Construction Project 0.12
KSK Energy Ventures Ltd. Power 0.09
Sub Total 98.26
Preference Shares
Vedanta Ltd. Non - Ferrous Metals 0.11
Zee Entertainment
Enterprises Ltd. Media & Entertainment 0.02
Sub Total 0.13
Total 98.39
Cash, Cash Equivalents and Net Current Assets 1.61
Grand Total 100.00
•	Top Ten Holdings, £ Co-sponsor
0.28
0.61
0.75
0.76
1.01
1.19
1.43
1.56
1.75
2.02
2.37
2.81
2.95
3.07
3.09
4.00
5.38
7.15
7.45
8.74
9.87
30.15
0 5 10 15 20 25 30 35
Consumer Durables
Chemicals
Industrial Products
Construction
Gas
Media And Entertainment
Non - Ferrous Metals
Retailing
Pesticides
Cement
Transportation
Pharmaceuticals
Finance
Auto Ancillaries
Ferrous Metals
Petroleum Products
Industrial Capital Goods
Auto
Power
Construction Project
Software
Banks
Industry Allocation of Equity Holding (% of Net Assets)
^Past performance may or may not be sustained in the future. Load is not taken into consideration for computation of performance.
Intouch mutually	 July 2017	7
HDFC Top 200 Fund (An open-ended growth scheme)
Face Value per Unit: ` 10 unless otherwise specified, + Industry Classification as recommended by AMFI, Data is as of July 31, 2017 unless otherwise specified.
l	 investment objective
To generate long term capital appreciation from a portfolio
of equity and equity linked instruments. The investment
portfolio for equity and equity linked instruments will be
primarily drawn from the companies in the BSE 200 Index.
Further, the Scheme may also invest in listed companies that
would qualify to be in the top 200 by market capitalisation
on the BSE even though they may not be listed on the BSE.
This includes participation in large IPOs where in the market
capitalisation of the company based on issue price would
make the company a part of the top 200 companies listed
on the BSE based on market capitalisation.
l	 Fund Manager § ¥
Prashant Jain (since June 19, 03)
Total Experience: Over 26 years
l	 Inception Date (Date of Allotment)
October 11, 1996
	 NAV (as on July 31, 2017)	 NAV per Unit (`)
Regular Plan - Growth Option	 443.760
Regular Plan - Dividend Option	 55.218
Direct Plan - Growth Option	 456.895
Direct Plan - Dividend Option	 57.243
	 aSSETS UNDER MANAGEMENT	 (`) IN CRORE
As on July 31, 2017	 15,360.67
Average for Month of July, 2017	 14,942.87
l	 quantitative data
Portfolio Turnover Ratio (Last 1 year)	 30.60%
Risk Ratio
n	 Standard Deviation	 4.570%
n	 Beta	 1.116
n	 Sharpe Ratio*	 0.131
Computed for the 3-yr period ended July 31, 2017. Based on
month-endNAV.*Riskfreerate:6.25%(Source:FIMMDAMIBOR)
	 Total Expense Ratio (Weighted Average for the month)
Excluding Goods and Service Tax on Management Fees
Regular: 2.10%	 Direct: 1.35%
l	 #BENCHMARK INDEX: S&P BSE 200
l	 ##addl. BENCHMARK INDEX: S&P BSE SENSEX
l	 Exit Load
l	 In respect of each purchase / switch-in of Units, an Exit
Load of 1.00% is payable if Units are redeemed / switched-
out within 1 year from the date of allotment.
l	 No Exit Load is payable if Units are redeemed / switched-
out after 1 year from the date of allotment.
For further details, please refer to para ‘Exit Load’ on Pg 51.
l	 PlanS & Options
Regular Plan, Direct Plan. Under Each Plan : Growth &
Dividend. The Dividend Option offers Dividend Payout and
Reinvestment facility.
l	 Minimum Application Amount
Purchase : ` 5,000 and any amount thereafter.
Additional Purchase : ` 1,000 and any amount thereafter.
l	 Redemption Proceeds
Normally despatched within 3-4 Business Days.
§ Date of migration from Zurich India Mutual Fund (Close of
business hours - June 19, 03
¥ Dedicated Fund Manager for Overseas Investments:
Mr Rakesh Vyas (Total Experience: Over 10 years).
This product is suitable for investors who are seeking ~
l	 Capital appreciation over long term.
l	 Investment in equity and equity linked instruments including
equity derivatives primarily drawn from the companies in the
S&P BSE 200 Index.
Riskometer
Investors understand that their principal will be at
moderately high risk
~ Investors should consult their financial advisers if in doubt
about whether the product is suitable for them.
SIP Performance^ - Regular Plan - Growth Option
Since Inception
SIP
15 year
SIP
10 year
SIP
5 year
SIP
3 year
SIP
1 year
SIP
Total Amount Invested (` ‘000) 2,500.00 1,800.00 1,200.00 600.00 360.00 120.00
Mkt Value as on July 31, 2017 (` ‘000) $$ 34,447.46 9,579.15 2,655.81 938.15 462.35 139.23
Returns (Annualised) (%) $$ 21.31 20.02 15.18 17.93 16.96 31.15
Benchmark Returns (Annualised) (%) # 14.41 14.44 12.11 15.39 14.59 27.56
Addl. Benchmark Ret. (Annualised) (%) ## 13.00 13.51 10.47 12.30 11.43 25.85
Assuming ` 10,000 invested systematically on the first Business Day of every month over a period of time. CAGR returns are computed
after accounting for the cash flow by using XIRR method (investment internal rate of return) for Regular Plan - Growth Option. The above
investment simulation is for illustrative purposes only and should not be construed as a promise on minimum returns and safeguard of capital.
Performance^ - Regular Plan - Growth Option
Date Period Scheme
Returns
(%) $$
Benchmark
Returns
(%)#
Additional
Benchmark
Returns
(%) ##
Value of ` 10,000 invested
Scheme (`)
$$
Benchmark
(`)#
Additional
Benchmark
(`)##
Jul 29, 16 Last 1 Year 23.63 18.56 15.82 12,377 11,867 11,591
Jul 31, 14 Last 3 Years 12.91 11.68 7.88 14,398 13,933 12,556
Jul 31, 12 Last 5 Years 17.63 15.68 13.53 22,535 20,722 18,864
Oct 11, 96 Since Inception 21.13 13.51 11.85 541,080 139,739 102,878
Returns greater than 1 year period are compounded annualized (CAGR). $$ All dividends declared prior to the splitting of the Scheme into
Dividend & Growth Options are assumed to be reinvested in the units of the Scheme at the then prevailing NAV (ex-dividend NAV). For
performance of other schemes managed by Prashant Jain, please refer page 51. Different plans viz. Regular Plan and Direct Plan have a
different expense structure. The expenses of the Direct Plan under the Scheme will be lower to the extent of the distribution expenses /
commission charged in the Regular Plan. For Performance of Direct Plan, refer page no. 59.
Portfolio
Company Industry+ % to NAV
Equity & Equity Related
•	HDFC Bank Ltd. Banks 8.27
•	ICICI Bank Ltd. Banks 6.48
•	State Bank of India Banks 6.19
•	Larsen & Toubro Ltd. Construction Project 6.16
•	Infosys Ltd. Software 5.08
•	Reliance Industries Ltd. Petroleum Products 4.81
•	Housing Development
Finance Corporation Ltd.£ Finance 3.59
•	ITC Ltd. Consumer Non Durables 3.16
•	Maruti Suzuki India Ltd. Auto 2.89
•	Tata Consultancy Services Ltd. Software 2.42
Tata Steel Ltd. Ferrous Metals 2.22
Power Grid Corporation of
India Ltd. Power 2.22
Tata Motors Ltd. Auto 2.05
Aurobindo Pharma Ltd. Pharmaceuticals 1.88
Axis Bank Ltd. Banks 1.84
Adani Ports and Special
Economic Zone Ltd. Transportation 1.75
CESC Ltd. Power 1.73
Canara Bank Banks 1.57
Bank of Baroda Banks 1.54
ABB India Ltd. Industrial Capital
Goods 1.44
Kotak Mahindra Bank Ltd. Banks 1.42
Indusind Bank Ltd. Banks 1.42
SunPharmaceuticalsIndustriesLtd. Pharmaceuticals 1.36
NTPC Ltd. Power 1.35
UPL Ltd. Pesticides 1.34
Bank of India Banks 1.27
Vedanta Ltd. Non - Ferrous Metals 1.26
Siemens Ltd. Industrial Capital Goods 1.22
GAIL (India) Ltd. Gas 1.16
Avenue Supermarts Ltd. RETAILING 1.15
Yes Bank Ltd. Banks 1.13
Punjab National Bank Banks 0.99
Union Bank of India Banks 0.99
Cipla Ltd. Pharmaceuticals 0.93
Century Textiles & Industries Ltd. Cement 0.93
Mahindra & Mahindra Ltd. Auto 0.91
Power Finance Corporation Ltd. Finance 0.91
HCL Technologies Ltd. Software 0.89
Oil&NaturalGasCorporationLtd. Oil 0.85
Rural Electrification
Corporation Ltd. Finance 0.80
Ambuja Cements Ltd. Cement 0.76
Oracle Financial Services
Software Ltd. Software 0.68
Wipro Ltd. Software 0.65
Zee Entertainment Enterprises Ltd. Media & Entertainment 0.59
Tata Motors Ltd. DVR Auto 0.58
Bharti Airtel Ltd. Telecom - Services 0.58
Tech Mahindra Ltd. Software 0.57
Hindalco Industries Ltd. Non - Ferrous Metals 0.54
Dish TV India Ltd. Media & Entertainment 0.52
Company Industry+ % to NAV
Steel Authority of India Ltd. Ferrous Metals 0.45
Divi's Laboratories Ltd. Pharmaceuticals 0.44
Tata Chemicals Ltd. Chemicals 0.43
Hindustan Petroleum
Corporation Ltd. Petroleum Products 0.42
Info Edge (India) Ltd. Software 0.41
Tata Communications Ltd. Telecom - Services 0.41
Bharat Petroleum Corporation Ltd. Petroleum Products 0.37
Federal Bank Ltd. Banks 0.31
Bharat Electronics Ltd. Industrial Capital Goods 0.24
Container Corporation of
India Ltd. Transportation 0.15
NHPC Ltd. Power 0.11
Sub Total 98.78
Preference Shares
Vedanta Ltd. Non - Ferrous Metals 0.15
Zee Entertainment
Enterprises Ltd. Media & Entertainment 0.02
Sub Total 0.17
Total 98.95
Cash, Cash Equivalents and Net Current Assets 1.05
Grand Total 100.00
•	Top Ten Holdings, £ Co-sponsor
0.43
0.85
0.99
1.13
1.15
1.16
1.34
1.69
1.90
1.95
2.67
2.90
3.16
4.61
5.30
5.41
5.60
6.16
6.43
10.70
33.42
0 5 10 15 20 25 30 35 40
Chemicals
Oil
Telecom - Services
Media And Entertainment
Retailing
Gas
Pesticides
Cement
Transportation
Non - Ferrous Metals
Ferrous Metals
Industrial Capital Goods
Consumer Non Durables
Pharmaceuticals
Finance
Power
Petroleum Products
Construction Project
Auto
Software
Banks
Industry Allocation of Equity Holding (% of Net Assets)
^Past performance may or may not be sustained in the future. Load is not taken into consideration for computation of performance.
8	 July 2017	 Intouch mutually
This is a simple and performing scheme which is eligible for
distribution by new cadre of distributors.
l	 investment objective
To achieve capital appreciation in the long term.
l	 Fund Manager ¥
Miten Lathia (since Mar 20, 17)
Total Experience: Over 17 years
(The scheme was co-managed by Chirag Setalvad & Miten
Lathia till March 19, 17)
l	 Inception Date (Date of Allotment)
February 1, 1994
	 NAV (as on July 31, 2017)	 NAV per Unit (`)
Regular Plan - Growth Option	 267.088
Regular Plan - Dividend Option	 29.126
Direct Plan - Growth Option	 276.231
Direct Plan - Dividend Option	 30.425
	 aSSETS UNDER MANAGEMENT	 (`) IN CRORE
As on July 31, 2017	 1,722.94
Average for Month of July, 2017	 1,668.02
l	 quantitative data
Portfolio Turnover Ratio (Last 1 year)	 40.13%
Risk Ratio
n	 Standard Deviation	 4.501%
n	 Beta	 1.045
n	 Sharpe Ratio*	 0.192
Computed for the 3-yr period ended July 31, 2017. Based on
month-endNAV.*Riskfreerate:6.25%(Source:FIMMDAMIBOR)
	 Total Expense Ratio (Weighted Average for the month)
Excluding Goods and Service Tax on Management Fees
Regular: 2.40%	 Direct: 1.33%
l	 #BENCHMARK INDEX: NIFTY 500 Index
l	 ##addl. BENCHMARK INDEX: NIFTY 50 Index
l	 Exit Load
l	 In respect of each purchase / switch-in of Units, an Exit
Load of 1.00% is payable if Units are redeemed / switched-
out within 1 year from the date of allotment.
l	 No Exit Load is payable if Units are redeemed / switched-
out after 1 year from the date of allotment.
For further details, please refer to para ‘Exit Load’ on Pg 51.
l	 PlanS & Options
Regular Plan, Direct Plan. Under Each Plan : Growth &
Dividend. The Dividend Option offers Dividend Payout and
Reinvestment facility.
l	 Minimum Application Amount
Purchase : ` 5,000 and any amount thereafter.
Additional Purchase : ` 1,000 and any amount thereafter.
l	 Redemption Proceeds
Normally despatched within 3-4 Business Days.
¥ Dedicated Fund Manager for Overseas Investments:
Mr Rakesh Vyas (Total Experience: Over 10 years).
HDFC Capital Builder Fund (An open-ended growth scheme)
SIP Performance^ - Regular Plan - Growth Option
Since Inception
SIP
15 year
SIP
10 year
SIP
5 year
SIP
3 year
SIP
1 year
SIP
Total Amount Invested (` ‘000) 2,820.00 1,800.00 1,200.00 600.00 360.00 120.00
Mkt Value as on July 31, 2017 (` ‘000) 39,660.00 9,641.55 2,941.97 997.81 466.00 137.96
Returns (Annualised) (%) 18.82 20.10 17.08 20.47 17.51 29.02
Benchmark Returns (Annualised) (%) # 13.42 14.57 12.48 16.26 15.41 28.75
Addl. Benchmark Ret. (Annualised) (%) ## 12.29 13.57 11.01 13.26 12.60 26.58
Assuming ` 10,000 invested systematically on the first Business Day of every month over a period of time. CAGR returns are
computed after accounting for the cash flow by using XIRR method (investment internal rate of return). The above investment
simulation is for illustrative purposes only and should not be construed as a promise on minimum returns and safeguard of capital.
Performance^ - Regular Plan - Growth Option
Date Period Scheme
Returns
(%)
Benchmark
Returns
(%)#
Additional
Benchmark
Returns
(%) ##
Value of ` 10,000 invested
Scheme (`) Benchmark
(`)#
Additional
Benchmark
(`)##
Jul 29, 16 Last 1 Year 22.74 19.84 16.56 12,288 11,996 11,665
Jul 31, 14 Last 3 Years 16.57 12.38 9.27 15,846 14,195 13,051
Jul 31, 12 Last 5 Years 20.63 16.33 14.01 25,555 21,310 19,272
Feb 01, 94 Since Inception 15.00 9.40 9.36 267,088 82,736 81,932
Returns greater than 1 year period are compounded annualized (CAGR). For performance of other schemes managed by Miten Lathia,
please refer page 51. Different plans viz. Regular Plan and Direct Plan have a different expense structure. The expenses of the Direct Plan
under the Scheme will be lower to the extent of the distribution expenses / commission charged in the Regular Plan. For Performance of
Direct Plan, refer page no. 68.
Face Value per Unit: ` 10 unless otherwise specified, + Industry Classification as recommended by AMFI, Data is as of July 31, 2017 unless otherwise specified.
This product is suitable for investors who are seeking ~
l	 Capital appreciation over long term.
l	 Investment predominantly in equity and equity related
instruments of strong companies.
Riskometer
Investors understand that their principal will be at
moderately high risk
~ Investors should consult their financial advisers if in doubt
about whether the product is suitable for them.
Portfolio
Company Industry+ % to NAV
Equity & Equity Related
•	HDFC Bank Ltd. Banks 8.14
•	Axis Bank Ltd. Banks 4.21
•	ICICI Bank Ltd. Banks 3.86
•	Reliance Industries Ltd. Petroleum Products 3.75
•	State Bank of India Banks 3.63
•	Vedanta Ltd. Non - Ferrous Metals 3.24
•	GAIL (India) Ltd. Gas 3.17
•	Cipla Ltd. Pharmaceuticals 3.15
•	Larsen & Toubro Ltd. Construction Project 3.12
•	Infosys Ltd. Software 2.93
Tata Motors Ltd. Auto 2.32
Kotak Mahindra Bank Ltd. Banks 2.29
VIP Industries Ltd. Consumer Durables 2.11
Yes Bank Ltd. Banks 2.10
Aurobindo Pharma Ltd. Pharmaceuticals 2.06
Indusind Bank Ltd. Banks 2.05
Dilip Buildcon Ltd. Construction 2.00
Dabur India Ltd. Consumer Non Durables 1.99
Tata Steel Ltd. Ferrous Metals 1.97
Oracle Financial Services
Software Ltd. Software 1.92
Solar Industries India Ltd. Chemicals 1.83
Adani Ports and Special
Economic Zone Ltd. Transportation 1.82
NHPC Ltd. Power 1.75
Wipro Ltd. Software 1.68
TV18 Broadcast Limited Media & Entertainment 1.63
Bank of Baroda Banks 1.45
J.Kumar Infraprojects Ltd. Construction 1.33
Voltas Ltd. Construction Project 1.30
Housing Development Finance
Corporation Ltd.£ Finance 1.30
Mahindra & Mahindra Ltd. Auto 1.22
Blue Star Ltd. Consumer Durables 1.18
Bajaj Corp Ltd. Consumer Non Durables 1.08
Dish TV India Ltd. Media & Entertainment 1.06
Sundram Fasteners Ltd. Auto Ancillaries 1.03
Trent Ltd. Retailing 1.02
PNC Infratech Ltd. Construction 1.01
Wonderla Holidays Ltd. Hotels, Resorts & Other
Recreational Activities 1.00
IPCA Laboratories Ltd. Pharmaceuticals 0.97
Delta Corp Ltd. Hotels, Resorts & Other
Recreational Activities 0.96
SadbhavInfrastructureProjectLtd Construction Project 0.91
Info Edge (India) Ltd. Software 0.85
Bharat Petroleum Corporation Ltd. Petroleum Products 0.83
Fag Bearings India Ltd. Industrial Products 0.80
Ashoka Buildcon Ltd. Construction Project 0.76
Ambuja Cements Ltd. Cement 0.76
Wockhardt Ltd. Pharmaceuticals 0.72
Titagarh Wagons Ltd. Industrial Capital Goods 0.71
Company Industry+ % to NAV
Network 18 Media &
Investments Ltd Media & Entertainment 0.66
Crompton Greaves
Consumer Elec. Ltd Consumer Durables 0.57
Bharti Infratel Ltd. Telecom - Equipment &
Accessories 0.48
Federal Bank Ltd. Banks 0.47
Gujarat Pipavav Port Ltd. Transportation 0.43
OnMobile Global Limited Telecom - Services 0.26
Indoco Remedies Ltd. Pharmaceuticals 0.11
KSK Energy Ventures Ltd. Power 0.05
Tata Communications Ltd. Telecom - Services 0.05
Sub Total 94.05
Preference Shares
Vedanta Ltd. Non - Ferrous Metals 0.21
Sub Total 0.21
Total 94.26
Cash, Cash Equivalents and Net Current Assets 5.74
Grand Total 100.00
•	Top Ten Holdings, £ Co-sponsor
0.31
0.48
0.71
0.76
0.80
1.02
1.03
1.30
1.80
1.83
1.96
1.97
2.25
3.07
3.17
3.35
3.45
3.54
3.86
4.34
4.58
6.09
7.01
7.38
28.20
0 5 10 15 20 25 30
Telecom - Services
Telecom - Equipment & Accessories
Industrial Capital Goods
Cement
Industrial Products
Retailing
Auto Ancillaries
Finance
Power
Chemicals
Hotels, Resorts & Other Recreational Activities
Ferrous Metals
Transportation
Consumer Non Durables
Gas
Media And Entertainment
Non - Ferrous Metals
Auto
Consumer Durables
Construction
Petroleum Products
Construction Project
Pharmaceuticals
Software
Banks
Industry Allocation of Equity Holding (% of Net Assets)
^Past performance may or may not be sustained in the future. Load is not taken into consideration for computation of performance.
Intouch mutually	 July 2017	9
Company Industry+ / Rating % to
NAV
Equity & Equity Related
•	HDFC Bank Ltd. Banks 9.09
•	Larsen & Toubro Ltd. Construction Project 7.13
•	Bharat Petroleum
Corporation Ltd. Petroleum Products 6.09
•	ICICI Bank Ltd. Banks 5.74
•	Maruti Suzuki India Ltd. Auto 5.30
•	Cipla Ltd. Pharmaceuticals 5.21
•	State Bank of India Banks 4.75
•	Teamlease Services Ltd. Commercial Services 4.62
•	Tata Motors Ltd. DVR Auto 4.39
•	BEML Ltd. Industrial Capital Goods 4.38
NHPC Ltd. Power 4.31
CESC Ltd. Power 4.30
Bharat Electronics Ltd. Industrial Capital Goods 3.92
KEC International Ltd. Construction Project 3.79
Infosys Ltd. Software 3.58
Titagarh Wagons Ltd. Industrial Capital Goods 3.26
Elecon Engineering Co. Ltd. Industrial Capital Goods 2.45
Dynamatic Technologies Ltd. Auto Ancillaries 2.38
Thyrocare Technologies Ltd. Healthcare Services 2.19
Kalpataru Power
Transmission Ltd. Power 2.07
BSE Limited Finance 2.02
Transport Corporation of
India Ltd. Transportation 1.73
PNC Infratech Ltd. Construction 1.58
Company Industry+ / Rating % to
NAV
Centum Electronics Ltd. Industrial Capital Goods 1.48
Network 18 Media &
Investments Ltd Media & Entertainment 1.44
Sub Total 97.20
Debt & Debt Related
Credit Exposure
Au Small Finance Bank Ltd. FITCH - A+ 0.62
Sub Total 0.62
Total 97.82
Cash, Cash Equivalents and Net Current Assets 2.18
Grand Total 100.00
•	Top Ten Holdings
l	 investment objective
To generate capital appreciation through equity investment
in companies whose shares are quoting at prices below
their true value.
l	 Fund Manager ¥
Vinay Kulkarni (since November 21, 06)
Total Experience: Over 27 years
l	 Inception Date (Date of Allotment)
September 17, 2004
	 NAV (as on July 31, 2017)	 NAV per Unit (`)
Regular Plan - Growth Option	 78.465
Regular Plan - Dividend Option	 20.996
Direct Plan - Growth Option	 81.406
Direct Plan - Dividend Option	 22.234
	 aSSETS UNDER MANAGEMENT	 (`) IN CRORE
As on July 31, 2017	 657.93
Average for Month of July, 2017	 645.40
l	 quantitative data
Portfolio Turnover Ratio (Last 1 year)	 18.74%
Risk Ratio
n	 Standard Deviation	 5.072%
n	 Beta	 1.138
n	 Sharpe Ratio*	 0.133
Computed for the 3-yr period ended July 31, 2017. Based on
month-endNAV.*Riskfreerate:6.25%(Source:FIMMDAMIBOR)
	 Total Expense Ratio (Weighted Average for the month)
Excluding Goods and Service Tax on Management Fees
Regular: 2.56%	 Direct: 1.44%
l	 #BENCHMARK INDEX: S&P BSE 200
l	 ##addl. BENCHMARK INDEX: S&P BSE Sensex
l	 Exit Load
l	 In respect of each purchase / switch-in of Units, an Exit
Load of 1.00% is payable if Units are redeemed / switched-
out within 1 year from the date of allotment.
l	 No Exit Load is payable if Units are redeemed / switched-
out after 1 year from the date of allotment.
For further details, please refer to para ‘Exit Load’ on Pg 51.
l	 PlanS & Options
Regular Plan, Direct Plan. Under Each Plan : Growth &
Dividend. The Dividend Option offers Dividend Payout and
Reinvestment facility.
l	 Minimum Application Amount
Purchase : ` 5,000 and any amount thereafter.
Additional Purchase : ` 1,000 and any amount thereafter.
l	 Redemption Proceeds
Normally despatched within 3-4 Business Days.
¥ Dedicated Fund Manager for Overseas Investments:
Mr Rakesh Vyas (Total Experience: Over 10 years).
HDFC Core & Satellite Fund (An open-ended growth scheme)
SIP Performance^ - Regular Plan - Growth Option
Since Inception
SIP
10 year
SIP
5 year
SIP
3 year
SIP
1 year
SIP
Total Amount Invested (` ‘000) 1,550.00 1,200.00 600.00 360.00 120.00
Mkt Value as on July 31, 2017 (` ‘000) 4,180.66 2,566.63 965.03 461.89 138.48
Returns (Annualised) (%) 14.33 14.54 19.09 16.89 29.89
Benchmark Returns (Annualised) (%) # 12.28 12.11 15.39 14.59 27.56
Addl. Benchmark Ret. (Annualised) (%) ## 11.22 10.47 12.30 11.43 25.85
Assuming ` 10,000 invested systematically on the first Business Day of every month over a period of time. CAGR returns are computed
after accounting for the cash flow by using XIRR method (investment internal rate of return) for Regular Plan - Growth Option. The above
investment simulation is for illustrative purposes only and should not be construed as a promise on minimum returns and safeguard of capital.
Performance^ - Regular Plan - Growth Option
Date Period Scheme
Returns
(%)
Benchmark
Returns
(%)#
Additional
Benchmark
Returns
(%) ##
Value of ` 10,000 invested
Scheme (`) Benchmark
(`)#
Additional
Benchmark
(`)##
Jul 29, 16 Last 1 Year 22.64 18.56 15.82 12,277 11,867 11,591
Jul 31, 14 Last 3 Years 13.62 11.68 7.88 14,672 13,933 12,556
Jul 31, 12 Last 5 Years 17.95 15.68 13.53 22,837 20,722 18,864
Sep 17, 04 Since Inception 17.35 15.00 14.70 78,465 60,454 58,468
Returns greater than 1 year period are compounded annualized (CAGR). For performance of other schemes managed by Vinay Kulkarni,
please refer page 51. Different plans viz. Regular Plan and Direct Plan have a different expense structure. The expenses of the Direct Plan
under the Scheme will be lower to the extent of the distribution expenses / commission charged in the Regular Plan. For Performance of
Direct Plan, refer page no. 59.
Face Value per Unit: ` 10 unless otherwise specified, + Industry Classification as recommended by AMFI, Data is as of July 31, 2017 unless otherwise specified.
This product is suitable for investors who are seeking ~
l	 Capital appreciation over long term.
l	 Investment primarily in equity and equity related instruments
of companies whose shares are quoting at prices below their
true value.
Riskometer
Investors understand that their principal will be at
moderately high risk
~ Investors should consult their financial advisers if in doubt
about whether the product is suitable for them.
Portfolio
1.44
1.58
1.73
2.02
2.19
2.38
3.58
4.62
5.21
6.09
9.69
10.68
10.92
15.49
19.58
0 5 10 15 20 25
Media And Entertainment
Construction
Transportation
Finance
Healthcare Services
Auto Ancillaries
Software
Commercial Services
Pharmaceuticals
Petroleum Products
Auto
Power
Construction Project
Industrial Capital Goods
Banks
Industry Allocation of Equity Holding (% of Net Assets)
^Past performance may or may not be sustained in the future. Load is not taken into consideration for computation of performance.
10	 July 2017	 Intouch mutually
l	 investment objective
To generate capital appreciation in the long term through
equity investments by investing in a diversified portfolio of
Mid Cap and Large Cap ‘blue chip’ companies.
l	 Fund Manager ¥
Vinay Kulkarni (since November 21, 06)
Total Experience: Over 27 years
l	 Inception Date (Date of Allotment)
April 6, 2005
	 NAV (as on July 31, 2017)	 NAV per Unit (`)
Regular Plan - Growth Option	 53.973
Regular Plan - Dividend Option	 14.899
Direct Plan - Growth Option	 55.433
Direct Plan - Dividend Option	 15.413
	 aSSETS UNDER MANAGEMENT	 (`) IN CRORE
As on July 31, 2017	 323.85
Average for Month of July, 2017	 315.24
l	 quantitative data
Portfolio Turnover Ratio (Last 1 year)	 18.61%
Risk Ratio
n	 Standard Deviation	 5.231%
n	 Beta	 1.205
n	 Sharpe Ratio*	 0.104
Computed for the 3-yr period ended July 31, 2017. Based on
month-endNAV.*Riskfreerate:6.25%(Source:FIMMDAMIBOR)
	 Total Expense Ratio (Weighted Average for the month)
Excluding Goods and Service Tax on Management Fees
Regular: 2.68%	 Direct: 2.08%
l	 #BENCHMARK INDEX: NIFTY 500 Index
l	 ##addl. BENCHMARK INDEX: NIFTY 50 Index
l	 Exit Load
l	 In respect of each purchase / switch-in of Units, an Exit
Load of 1.00% is payable if Units are redeemed / switched-
out within 1 year from the date of allotment.
l	 No Exit Load is payable if Units are redeemed / switched-
out after 1 year from the date of allotment.
For further details, please refer to para ‘Exit Load’ on Pg 51.
l	 PlanS & Options
Regular Plan, Direct Plan. Under Each Plan : Growth &
Dividend. The Dividend Option offers Dividend Payout and
Reinvestment facility.
l	 Minimum Application Amount
Purchase : ` 5,000 and any amount thereafter.
Additional Purchase : ` 1,000 and any amount thereafter.
l	 Redemption Proceeds
Normally despatched within 3-4 Business Days.
l	 Segment-wise break-up
	 of equity holding	 (% of net assets)
Large Cap 	 46.89%
Mid Cap 	 51.65%
¥ Dedicated Fund Manager for Overseas Investments:
Mr Rakesh Vyas (Total Experience: Over 10 years).
HDFC Premier Multi-cap Fund (An open-ended growth scheme)
SIP Performance^ - Regular Plan - Growth Option
Since Inception
SIP
10 year
SIP
5 year
SIP
3 year
SIP
1 year
SIP
Total Amount Invested (` ‘000) 1,480.00 1,200.00 600.00 360.00 120.00
Mkt Value as on July 31, 2017 (` ‘000) 3,446.90 2,410.88 922.79 449.04 137.93
Returns (Annualised) (%) 12.91 13.38 17.26 14.91 28.98
Benchmark Returns (Annualised) (%) # 12.07 12.48 16.26 15.41 28.75
Addl. Benchmark Ret. (Annualised) (%) ## 11.17 11.01 13.26 12.60 26.58
Assuming ` 10,000 invested systematically on the first Business Day of every month over a period of time. CAGR returns are computed
after accounting for the cash flow by using XIRR method (investment internal rate of return) for Regular Plan - Growth Option. The above
investment simulation is for illustrative purposes only and should not be construed as a promise on minimum returns and safeguard of capital.
Performance^ - Regular Plan - Growth Option
Date Period Scheme
Returns
(%)
Benchmark
Returns
(%)#
Additional
Benchmark
Returns
(%) ##
Value of ` 10,000 invested
Scheme (`) Benchmark
(`)#
Additional
Benchmark
(`)##
Jul 29, 16 Last 1 Year 22.72 19.84 16.56 12,286 11,996 11,665
Jul 31, 14 Last 3 Years 11.76 12.38 9.27 13,963 14,195 13,051
Jul 31, 12 Last 5 Years 16.07 16.33 14.01 21,074 21,310 19,272
Apr 06, 05 Since Inception 14.66 13.70 13.70 53,973 48,662 48,698
Returns greater than 1 year period are compounded annualized (CAGR). For performance of other schemes managed by Vinay Kulkarni,
please refer page 51. Different plans viz. Regular Plan and Direct Plan have a different expense structure. The expenses of the Direct Plan
under the Scheme will be lower to the extent of the distribution expenses / commission charged in the Regular Plan. For Performance of
Direct Plan, refer page no. 59.
Face Value per Unit: ` 10 unless otherwise specified, + Industry Classification as recommended by AMFI, Data is as of July 31, 2017 unless otherwise specified.
This product is suitable for investors who are seeking ~
l	 Capital appreciation over long term.
l	 Investment predominantly in equity and equity related
instruments of Mid Cap and Large Cap ‘blue chip’ companies.
Riskometer
Investors understand that their principal will be at
moderately high risk
~ Investors should consult their financial advisers if in doubt
about whether the product is suitable for them.
Company Industry+ % to
NAV
Equity & Equity Related
•	State Bank of India Banks 9.46
•	HDFC Bank Ltd. Banks 8.87
•	ICICI Bank Ltd. Banks 7.76
•	Maruti Suzuki India Ltd. Auto 4.79
•	Tata Motors Ltd. DVR Auto 4.78
•	Infosys Ltd. Software 4.68
•	Tata Steel Ltd. Ferrous Metals 4.57
•	Punjab National Bank Banks 4.51
•	KEC International Ltd. Construction Project 4.50
•	Bharat Petroleum
Corporation Ltd. Petroleum Products 4.38
Housing Development Finance
Corporation Ltd.£ Finance 4.14
Bharat Electronics Ltd. Industrial Capital Goods 4.14
Larsen & Toubro Ltd. Construction Project 3.98
Hindustan Construction
Company Ltd. Construction Project 3.67
Crompton Greaves
Consumer Elec. Ltd Consumer Durables 3.63
Bank of Baroda Banks 3.51
Axis Bank Ltd. Banks 3.21
Kalpataru Power
Transmission Ltd. Power 2.50
Cipla Ltd. Pharmaceuticals 2.08
Titagarh Wagons Ltd. Industrial Capital Goods 1.91
Crompton Greaves Ltd. Industrial Capital Goods 1.67
Company Industry+ % to
NAV
The Indian Hotels
Company Ltd.
Hotels, Resorts & Other
Recreational Activities 1.66
Siemens Ltd. Industrial Capital Goods 1.35
Dilip Buildcon Ltd. Construction 1.24
Astra Microwave Products Ltd. Telecom - Equipment
& Accessories 0.99
Tamil Nadu Newsprint &
Papers Ltd. Paper 0.57
Total 98.55
Cash, Cash Equivalents and Net Current Assets 1.45
Grand Total 100.00
•	Top Ten Holdings, £ Co-sponsor
Portfolio
0.57
0.99
1.24
1.66
2.08
2.50
3.63
4.14
4.38
4.57
4.68
9.07
9.57
12.15
37.32
0 5 10152025303540
Paper
Telecom - Equipment & Accessories
Construction
Hotels, Resorts & Other Recreational Activities
Pharmaceuticals
Power
Consumer Durables
Finance
Petroleum Products
Ferrous Metals
Software
Industrial Capital Goods
Auto
Construction Project
Banks
Industry Allocation of Equity Holding (% of Net Assets)
^Past performance may or may not be sustained in the future. Load is not taken into consideration for computation of performance.
Intouch mutually	 July 2017	11
Company Industry+ % to
NAV
Equity & Equity Related
•	ICICI Bank Ltd. Banks 9.64
•	HDFC Bank Ltd. Banks 9.52
•	State Bank of India Banks 9.51
•	Reliance Industries Ltd. Petroleum Products 9.04
•	Larsen & Toubro Ltd. Construction Project 8.85
•	Bharat Petroleum
Corporation Ltd. Petroleum Products 6.93
•	Axis Bank Ltd. Banks 6.54
•	Maruti Suzuki India Ltd. Auto 5.79
•	ITC Ltd. Consumer Non
Durables 4.98
•	Infosys Ltd. Software 4.90
Tata Motors Ltd. DVR Auto 4.62
UltraTech Cement Ltd. Cement 3.09
Cognizant Technology
Solutions Corp Software 3.08
Indusind Bank Ltd. Banks 2.68
Mahindra & Mahindra Ltd. Auto 2.43
Power Grid Corporation of
India Ltd. Power 2.04
Adani Ports and Special
Economic Zone Ltd. Transportation 1.35
GAIL (India) Ltd. Gas 0.80
Company Industry+ % to
NAV
NTPC Ltd. Power 0.63
Indian Oil Corporation Ltd. Petroleum Products 0.54
Sub Total 93.88
Foreign Securities and / or overseas ETF(s)
Cognizant Technology
Solutions Corp Software 3.08
Sub Total 3.08
Cash, Cash Equivalents and Net Current Assets 3.04
Grand Total 100.00
•	Top Ten Holdings
l	 investment objective
To provide long-term capital appreciation by investing
predominantly in large cap companies.
l	 Fund Manager § ¥
Vinay Kulkarni (since June 27, 14)
Total Experience: Over 27 years
l	 Inception Date (Date of Allotment)
February 18, 1994
	 NAV (as on July 31, 2017)	 NAV per Unit (`)
Regular Plan - Growth Option	 108.042
Regular Plan - Dividend Option	 22.679
Direct Plan - Growth Option	 108.960
Direct Plan - Dividend Option	 25.589
	 aSSETS UNDER MANAGEMENT	 (`) IN CRORE
As on July 31, 2017	 1,312.43
Average for Month of July, 2017	 1,292.50
l	 quantitative data
Portfolio Turnover Ratio (Last 1 year)	 11.22%
Risk Ratio
n	 Standard Deviation	 4.130%
n	 Beta	 1.004
n	 Sharpe Ratio*	 0.078
Computed for the 3-yr period ended July 31, 2017. Based on
month-endNAV.*Riskfreerate:6.25%(Source:FIMMDAMIBOR)
	 Total Expense Ratio (Weighted Average for the month)
Excluding Goods and Service Tax on Management Fees
Regular: 2.18%	 Direct: 2.08%
l	 #BENCHMARK INDEX: NIFTY 50 Index
l	 ##addl. BENCHMARK INDEX: S&P BSE Sensex
l	 Exit Load
l	 In respect of each purchase / switch-in of Units, an Exit
Load of 1.00% is payable if Units are redeemed / switched-
out within 1 year from the date of allotment.
l	 No Exit Load is payable if Units are redeemed / switched-
out after 1 year from the date of allotment.
For further details, please refer to para ‘Exit Load’ on Pg 51.
l	 PlanS & Options
Regular Plan, Direct Plan. Under Each Plan : Growth &
Dividend. The Dividend Option offers Dividend Payout and
Reinvestment facility.
l	 Minimum Application Amount
Purchase : ` 5,000 and any amount thereafter.
Additional Purchase : ` 1,000 and any amount thereafter.
l	 Redemption Proceeds
Normally despatched within 3-4 Business Days.
§ Date of migration from Morgan Stanley Mutual Fund (Close
of business hours - June 27, 14)
¥ Dedicated Fund Manager for Overseas Investments:
Mr Rakesh Vyas (Total Experience: Over 10 years).
HDFC Large Cap Fund (An open-ended equity scheme)
SIP Performance^ - Regular Plan - Growth Option
Since Inception
SIP
5 year
SIP
3 year
SIP
1 year
SIP
Total Amount Invested (` ‘000) 1,110.00 600.00 360.00 120.00
Mkt Value as on July 31, 2017 (` ‘000) $$ 1,926.39 830.39 437.81 137.31
Returns (Annualised) (%) $$ 11.53 12.97 13.14 27.94
Benchmark Returns (Annualised) (%) # 11.76 13.26 12.60 26.58
Addl. Benchmark Ret. (Annualised) (%) ## 11.21 12.30 11.43 25.85
Assuming ` 10,000 invested systematically on the first Business Day of every month over a period of time. CAGR returns are computed
after accounting for the cash flow by using XIRR method (investment internal rate of return) for Regular Plan - Growth Option. The above
investment simulation is for illustrative purposes only and should not be construed as a promise on minimum returns and safeguard of capital.
Performance^ - Regular Plan - Growth Option
Date Period Scheme
Returns
(%) $$
Benchmark
Returns
(%)#
Additional
Benchmark
Returns
(%) ##
Value of ` 10,000 invested
Scheme (`)
$$
Benchmark
(`)#
Additional
Benchmark
(`)##
Jul 29, 16 Last 1 Year 19.23 16.56 15.82 11,935 11,665 11,591
Jul 31, 14 Last 3 Years 9.49 9.27 7.88 13,128 13,051 12,556
Jul 31, 12 Last 5 Years 14.00 14.01 13.53 19,261 19,272 18,864
Feb 18, 94 Since Inception 11.25 9.37 9.44 121,871 81,784 83,051
Returns greater than 1 year period are compounded annualized (CAGR). $$ All dividends declared prior to the splitting of the Scheme
into Dividend & Growth Options are assumed to be reinvested in the units of the Scheme at the then prevailing NAV. For performance of
other schemes managed by Vinay Kulkarni, please refer page 51. Different plans viz. Regular Plan and Direct Plan have a different expense
structure. The expenses of the Direct Plan under the Scheme will be lower to the extent of the distribution expenses / commission charged
in the Regular Plan. For Performance of Direct Plan, refer page no. 59.
Face Value per Unit: ` 10 unless otherwise specified, + Industry Classification as recommended by AMFI, Data is as of July 31, 2017 unless otherwise specified.
This product is suitable for investors who are seeking ~
l	 Capital appreciation over long term.
l	 Investment in equity and equity related instruments of Large
Cap companies.
Riskometer
Investors understand that their principal will be at
moderately high risk
~ Investors should consult their financial advisers if in doubt
about whether the product is suitable for them.
Portfolio
0.80
1.35
2.67
3.09
4.98
7.98
8.85
12.84
16.51
37.89
0 5 10 15 20 25 30 35 40
Gas
Transportation
Power
Cement
Consumer Non Durables
Software
Construction Project
Auto
Petroleum Products
Banks
Industry Allocation of Equity Holding (% of Net Assets)
^Past performance may or may not be sustained in the future. Load is not taken into consideration for computation of performance.
12	 July 2017	 Intouch mutually
l	 investment objective
To generate long-term capital appreciation from a portfolio
that is substantially constituted of equity and equity related
securities of Small and Mid-Cap companies.
l	 Fund Manager ¥
Chirag Setalvad (since June 25, 07)
Total Experience: Over 17 years
l	 Inception Date (Date of Allotment)
June 25, 2007
	 NAV (as on July 31, 2017)	 NAV per Unit (`)
Regular Plan - Growth Option	 54.096
Regular Plan - Dividend Option	 33.167
Direct Plan - Growth Option	 56.092
Direct Plan - Dividend Option	 38.895
	 aSSETS UNDER MANAGEMENT	 (`) IN CRORE
As on July 31, 2017	 17,841.14
Average for Month of July, 2017	 17,488.14
l	 quantitative data
Portfolio Turnover Ratio (Last 1 year)	 23.80%
Risk Ratio
n	 Standard Deviation	 4.189%
n	 Beta	 0.935
n	 Sharpe Ratio*	 0.312
Computed for the 3-yr period ended July 31, 2017. Based on
month-endNAV.*Riskfreerate:6.25%(Source:FIMMDAMIBOR)
	 Total Expense Ratio (Weighted Average for the month)
Excluding Goods and Service Tax on Management Fees
Regular: 2.23%	 Direct: 1.23%
l	 #BENCHMARK INDEX: NIFTY Free Float Midcap 100 Index
l	 ##addl. BENCHMARK INDEX: NIFTY 50 Index
l	 Exit Load
l	 In respect of each purchase / switch-in of Units, an Exit
Load of 1.00% is payable if Units are redeemed / switched-
out within 1 year from the date of allotment.
l	 No Exit Load is payable if Units are redeemed / switched-
out after 1 year from the date of allotment.
For further details, please refer to para ‘Exit Load’ on Pg 51.
l	 PlanS & Options
Regular Plan, Direct Plan. Under Each Plan : Growth &
Dividend. The Dividend Option offers Dividend Payout and
Reinvestment facility.
l	 Minimum Application Amount
Purchase : ` 5,000 and any amount thereafter.
Additional Purchase : ` 1,000 and any amount thereafter.
l	 Redemption Proceeds
Normally despatched within 3-4 Business Days.
l	 Segment-wise break-up
	 of equity holding	 (% of net assets)
Large Cap 	 1.46%
Mid Cap 	 93.88%
¥ Dedicated Fund Manager for Overseas Investments:
Mr Rakesh Vyas (Total Experience: Over 10 years).
HDFC Mid-Cap Opportunities Fund (An open-ended equity scheme)
SIP Performance^ - Regular Plan - Growth Option
Since Inception
SIP
10 year
SIP
5 year
SIP
3 year
SIP
1 year
SIP
Total Amount Invested (` ‘000) 1,220.00 1,200.00 600.00 360.00 120.00
Mkt Value as on July 31, 2017 (` ‘000) 4,225.85 4,118.14 1,187.70 498.72 138.29
Returns (Annualised) (%) 23.06 23.31 27.72 22.38 29.58
Benchmark Returns (Annualised) (%) # 16.02 16.20 22.59 20.64 28.88
Addl. Benchmark Ret. (Annualised) (%) ## 10.92 11.01 13.26 12.60 26.58
Assuming ` 10,000 invested systematically on the first Business Day of every month over a period of time. CAGR returns are computed
after accounting for the cash flow by using XIRR method (investment internal rate of return) for Regular Plan - Growth Option. The above
investment simulation is for illustrative purposes only and should not be construed as a promise on minimum returns and safeguard of capital.
Performance^ - Regular Plan - Growth Option
Date Period Scheme
Returns
(%)
Benchmark
Returns
(%)#
Additional
Benchmark
Returns
(%) ##
Value of ` 10,000 invested
Scheme (`) Benchmark
(`)#
Additional
Benchmark
(`)##
Jul 29, 16 Last 1 Year 26.35 25.18 16.56 12,652 12,533 11,665
Jul 31, 14 Last 3 Years 23.05 19.52 9.27 18,640 17,083 13,051
Jul 31, 12 Last 5 Years 27.06 20.88 14.01 33,133 25,828 19,272
Jun 25, 07 Since Inception 18.18 12.12 8.89 54,096 31,773 23,658
Returns greater than 1 year period are compounded annualized (CAGR). For performance of other schemes managed by Chirag Setalvad,
please refer page 51. Different plans viz. Regular Plan and Direct Plan have a different expense structure. The expenses of the Direct Plan
under the Scheme will be lower to the extent of the distribution expenses / commission charged in the Regular Plan. For Performance of
Direct Plan, refer page no. 59.
Face Value per Unit: ` 10 unless otherwise specified, + Industry Classification as recommended by AMFI, Data is as of July 31, 2017 unless otherwise specified.
This product is suitable for investors who are seeking ~
l	 Capital appreciation over long term.
l	 Investment predominantly in equity and equity related
instruments of Small and Mid Cap companies.
Riskometer
Investors understand that their principal will be at
moderately high risk
~ Investors should consult their financial advisers if in doubt
about whether the product is suitable for them.
Portfolio
Company Industry+ % to NAV
Equity & Equity Related
•	Tube Investments of India Ltd. Auto Ancillaries 3.39
•	Voltas Ltd. Construction Project 2.88
•	Yes Bank Ltd. Banks 2.59
•	Aurobindo Pharma Ltd. Pharmaceuticals 2.55
•	Indusind Bank Ltd. Banks 2.41
•	UPL Ltd. Pesticides 2.40
•	Balkrishna Industries Ltd. Auto Ancillaries 2.21
•	Sundram Fasteners Ltd. Auto Ancillaries 2.18
•	Adani Ports and Special
Economic Zone Ltd. Transportation 2.18
•	Hexaware Technologies Ltd. Software 2.09
Federal Bank Ltd. Banks 1.93
Aarti Industries Ltd. Chemicals 1.92
Carborundum Universal Ltd. Industrial Products 1.90
MRF Ltd. Auto Ancillaries 1.85
VST Industries Ltd. Consumer Non Durables 1.81
Bajaj Finance Ltd. Finance 1.79
Cholamandalam Investment
and Finance Company Ltd. Finance 1.76
Punjab National Bank Banks 1.73
Torrent Pharmaceuticals Ltd. Pharmaceuticals 1.70
Blue Star Ltd. Consumer Durables 1.66
SKF India Ltd. Industrial Products 1.59
Indian Bank Banks 1.56
Bharat Electronics Ltd. Industrial Capital Goods 1.55
Trent Ltd. Retailing 1.54
Redington (India) Limited Transportation 1.53
City Union Bank Ltd. Banks 1.47
Axis Bank Ltd. Banks 1.46
Hindustan Petroleum
Corporation Ltd. Petroleum Products 1.45
Navneet Education Ltd. Media & Entertainment 1.43
Bank of Baroda Banks 1.43
The Indian Hotels
Company Ltd.
Hotels, Resorts & Other
Recreational Activities 1.40
Jagran Prakashan Ltd. Media & Entertainment 1.35
Supreme Industries Ltd. Industrial Products 1.34
Lakshmi Machine Works Ltd. Industrial Capital Goods 1.29
Capital First Ltd. Finance 1.27
KNR Constructions Ltd. Construction 1.24
Petronet LNG Ltd. Gas 1.20
D.B.Corp Ltd. Media & Entertainment 1.18
Greenply Industries Ltd. Consumer Durables 1.12
NIIT Technologies Ltd. Software 1.12
Atul Ltd. Chemicals 1.09
Solar Industries India Ltd. Chemicals 1.03
Karur Vysya Bank Ltd. Banks 1.02
Exide Industries Ltd. Auto Ancillaries 0.99
IPCA Laboratories Ltd. Pharmaceuticals 0.96
Power Finance Corporation Ltd. Finance 0.93
Union Bank of India Banks 0.93
Vardhman Textiles Ltd. Textiles - Cotton 0.92
Greenlam Industries Ltd. Consumer Durables 0.89
Fag Bearings India Ltd. Industrial Products 0.89
Cummins India Ltd. Industrial Products 0.89
Vesuvius India Ltd. Industrial Products 0.89
KEC International Ltd. Construction Project 0.85
Mahindra Holidays &
Resorts Ind Ltd
Hotels, Resorts & Other
Recreational Activities 0.85
Max Financial Services Limited Finance 0.82
AIA Engineering Ltd. Industrial Products 0.81
Divi's Laboratories Ltd. Pharmaceuticals 0.80
Sadbhav Engineering Ltd. Construction Project 0.75
Allahabad Bank Banks 0.75
Company Industry+ % to NAV
Grindwell Norton Ltd. Industrial Products 0.71
Oracle Financial Services
Software Ltd. Software 0.69
Strides Shasun Limited Pharmaceuticals 0.67
Dhanuka Agritech Ltd. Pesticides 0.66
Delta Corp Ltd. Hotels, Resorts & Other
Recreational Activities 0.62
Whirlpool of India Ltd. Consumer Durables 0.57
Apollo Tyres Ltd. Auto Ancillaries 0.56
Huhtamaki PPL Ltd. Industrial Products 0.55
Persistent Systems Limited Software 0.54
Havells India Ltd. Consumer Durables 0.53
Thermax Ltd. IndustrialCapitalGoods 0.40
Bata India Ltd. Consumer Durables 0.33
Oil India Ltd. Oil 0.26
eClerx Services Ltd. Software 0.22
Max India Limited Healthcare Services 0.20
Crompton Greaves Ltd. IndustrialCapitalGoods 0.11
GTPL Hathway Ltd. Media & Entertainment 0.10
Wockhardt Ltd. Pharmaceuticals 0.09
Sub Total 95.32
Preference Shares
Zee Entertainment Enterprises Ltd. Media & Entertainment 0.01
Sub Total 0.01
Total 95.33
Cash, Cash Equivalents and Net Current Assets 4.67
Grand Total 100.00
•	Top Ten Holdings
0.20
0.26
0.92
1.20
1.24
1.45
1.54
1.81
2.87
3.06
3.35
3.71
4.04
4.07
4.48
4.66
5.10
6.57
6.77
9.57
11.18
17.28
0 2 4 6 8 101214161820
Healthcare Services
Oil
Textiles - Cotton
Gas
Construction
Petroleum Products
Retailing
Consumer Non Durables
Hotels, Resorts & Other Recreational Activities
Pesticides
Industrial Capital Goods
Transportation
Chemicals
Media And Entertainment
Construction Project
Software
Consumer Durables
Finance
Pharmaceuticals
Industrial Products
Auto Ancillaries
Banks
Industry Allocation of Equity Holding (% of Net Assets)
^Past performance may or may not be sustained in the future. Load is not taken into consideration for computation of performance.
Intouch mutually	 July 2017	13
l	 investment objective
To provide long-term capital appreciation by investing
predominantly in Small-Cap and Mid-Cap companies.
l	 Fund Manager § ¥
Chirag Setalvad (since June 27, 14)
Total Experience: Over 17 years
l	 Inception Date (Date of Allotment)
April 3, 2008
	 NAV (as on July 31, 2017)	 NAV per Unit (`)
Regular Plan - Growth Option	 38.072
Regular Plan - Dividend Option	 24.864
Direct Plan - Growth Option	 39.804
Direct Plan - Dividend Option	 26.359
	 aSSETS UNDER MANAGEMENT	 (`) IN CRORE
As on July 31, 2017	 1,206.69
Average for Month of July, 2017	 1,195.95
l	 quantitative data
Portfolio Turnover Ratio (Last 1 year)	 29.42%
Risk Ratio
n	 Standard Deviation	 4.413%
n	 Beta	 0.636
n	 Sharpe Ratio*	 0.271
Computed for the 3-yr period ended July 31, 2017. Based on
month-endNAV.*Riskfreerate:6.25%(Source:FIMMDAMIBOR)
	 Total Expense Ratio (Weighted Average for the month)
Excluding Goods and Service Tax on Management Fees
Regular: 2.46%	 Direct: 1.31%
l	 #BENCHMARKINDEX:NIFTYFreeFloatSmallcap100Index
l	 ##addl. BENCHMARK INDEX: NIFTY 50 Index
l	 Exit Load
l	 In respect of each purchase / switch-in of Units, an Exit
Load of 1.00% is payable if Units are redeemed / switched-
out within 1 year from the date of allotment.
l	 No Exit Load is payable if Units are redeemed / switched-
out after 1 year from the date of allotment.
For further details, please refer to para ‘Exit Load’ on Pg 51.
l	 PlanS & Options
Regular Plan, Direct Plan. Under Each Plan : Growth &
Dividend. The Dividend Option offers Dividend Payout and
Reinvestment facility.
l	 Minimum Application Amount
Purchase : ` 5,000 and any amount thereafter.
Additional Purchase : ` 1,000 and any amount thereafter.
l	 Redemption Proceeds
Normally despatched within 3-4 Business Days.
l	 Segment-wise break-up
	 of equity holding	 (% of net assets)
Mid Cap 	 4.17%
Small Cap 	 87.79%
§	Date of migration from Morgan Stanley Mutual Fund (Close
of business hours - June 27, 14)
¥	Dedicated Fund Manager for Overseas Investments:
Mr Rakesh Vyas (Total Experience: Over 10 years).
HDFC Small Cap Fund (An open-ended equity scheme)
SIP Performance^ - Regular Plan - Growth Option
Since Inception
SIP
5 year
SIP
3 year
SIP
1 year
SIP
Total Amount Invested (` ‘000) 1,120.00 600.00 360.00 120.00
Mkt Value as on July 31, 2017 (` ‘000) 2,881.40 1,080.40 503.27 142.50
Returns (Annualised) (%) 19.37 23.76 23.03 36.70
Benchmark Returns (Annualised) (%) # 15.80 22.76 21.95 37.69
Addl. Benchmark Ret. (Annualised) (%) ## 11.69 13.26 12.60 26.58
Assuming ` 10,000 invested systematically on the first Business Day of every month over a period of time. CAGR returns are computed
after accounting for the cash flow by using XIRR method (investment internal rate of return) for Regular Plan - Growth Option. The above
investment simulation is for illustrative purposes only and should not be construed as a promise on minimum returns and safeguard of capital.
Performance^ - Regular Plan - Growth Option
Date Period Scheme
Returns
(%)
Benchmark
Returns
(%)#
Additional
Benchmark
Returns
(%) ##
Value of ` 10,000 invested
Scheme (`) Benchmark
(`)#
Additional
Benchmark
(`)##
Jul 29, 16 Last 1 Year 29.31 28.00 16.56 12,949 12,817 11,665
Jul 31, 14 Last 3 Years 21.24 15.50 9.27 17,831 15,415 13,051
Jul 31, 12 Last 5 Years 22.96 19.44 14.01 28,126 24,316 19,272
Apr 03, 08 Since Inception 15.40 8.35 8.34 38,072 21,137 21,119
Returns greater than 1 year period are compounded annualized (CAGR). For performance of other schemes managed by Chirag Setalvad,
please refer page 51. Different plans viz. Regular Plan and Direct Plan have a different expense structure. The expenses of the Direct Plan
under the Scheme will be lower to the extent of the distribution expenses / commission charged in the Regular Plan. For Performance of
Direct Plan, refer page no. 59.
Face Value per Unit: ` 10 unless otherwise specified, + Industry Classification as recommended by AMFI, Data is as of July 31, 2017 unless otherwise specified.
This product is suitable for investors who are seeking ~
l	 Capital appreciation over long term.
l	 Investment predominantly in equity and equity related
instruments of Small-Cap and Mid-Cap companies.
Riskometer
Investors understand that their principal will be at
moderately high risk
~ Investors should consult their financial advisers if in doubt
about whether the product is suitable for them.
Portfolio
Company Industry+ % to NAV
Equity & Equity Related
•	Oriental Carbon &
Chemicals Ltd. Chemicals 4.12
•	KEC International Ltd. Construction Project 3.94
•	Carborundum Universal Ltd. Industrial Products 3.88
•	Aarti Industries Ltd. Chemicals 3.83
•	Tube Investments of India Ltd. Auto Ancillaries 3.61
•	City Union Bank Ltd. Banks 3.25
•	Balkrishna Industries Ltd. Auto Ancillaries 3.12
•	Dilip Buildcon Ltd. Construction 2.85
•	Apar Industries Limited Industrial Capital Goods 2.77
•	Swaraj Engines Ltd. Industrial Products 2.61
LG Balakrishnan & Bros Ltd. Auto Ancillaries 2.39
Federal Bank Ltd. Banks 2.39
PNC Infratech Ltd. Construction 2.29
Redington (India) Limited Transportation 2.16
NIIT Technologies Ltd. Software 2.06
KalpataruPowerTransmissionLtd. Power 2.03
Hexaware Technologies Ltd. Software 1.95
Oriental Bank of Commerce Banks 1.91
Greenply Industries Ltd. Consumer Durables 1.86
Aurobindo Pharma Ltd. Pharmaceuticals 1.79
Century Plyboards (India) Ltd. Consumer Durables 1.75
Vesuvius India Ltd. Industrial Products 1.75
Sundram Fasteners Ltd. Auto Ancillaries 1.71
Jagran Prakashan Ltd. Media & Entertainment 1.67
VIP Industries Ltd. Consumer Durables 1.65
IFB Industries Ltd. Consumer Durables 1.65
D.B. Corp Ltd. Media & Entertainment 1.59
Titagarh Wagons Ltd. Industrial Capital Goods 1.53
The Indian Hotels
Company Ltd.
Hotels, Resorts & Other
Recreational Activities 1.49
Insecticides (India) Ltd. Pesticides 1.48
V.S.T Tillers Tractors Ltd. Auto 1.47
Banco Products (I) Ltd. Auto Ancillaries 1.44
Hindustan Construction
Company Ltd. Construction Project 1.42
Vardhman Textiles Ltd. Textiles - Cotton 1.41
Sarla Performance Fibers Ltd. Textiles - Synthetic 1.40
Sadbhav Engineering Ltd. Construction Project 1.37
Great Eastern Shipping
Company Ltd. Transportation 1.27
Company Industry+ % to NAV
Everest Industries Ltd. Cement 1.25
Nilkamal Ltd. Industrial Products 1.18
SKF India Ltd. Industrial Products 1.16
Power Mech Projects Ltd. Construction Project 1.07
Time Technoplast Ltd. Industrial Products 1.05
Corporation Bank Banks 0.95
Atul Auto Ltd. Auto 0.93
Garware Wall Ropes Ltd. Textile Products 0.77
Mold-Tek Packaging Ltd. Industrial Products 0.71
NRB Bearing Ltd. Industrial Products 0.65
Indian Bank Banks 0.58
Avanti Feeds Ltd. Consumer Non Durables 0.42
IFGL Refractories Ltd. Industrial Products 0.39
Total 91.97
Cash, Cash Equivalents and Net Current Assets 8.03
Grand Total 100.00
•	Top Ten Holdings
0.42
0.77
1.25
1.40
1.41
1.48
1.49
1.79
2.03
2.40
3.26
3.43
4.01
4.30
5.14
6.91
7.80
7.95
9.08
12.27
13.38
0 2 4 6 8 10 12 14 16
Consumer Non Durables
Textile Products
Cement
Textiles - Synthetic
Textiles - Cotton
Pesticides
Hotels, Resorts & Other Recreational Activities
Pharmaceuticals
Power
Auto
Media And Entertainment
Transportation
Software
Industrial Capital Goods
Construction
Consumer Durables
Construction Project
Chemicals
Banks
Auto Ancillaries
Industrial Products
Industry Allocation of Equity Holding (% of Net Assets)
^Past performance may or may not be sustained in the future. Load is not taken into consideration for computation of performance.
14	 July 2017	 Intouch mutually
l	 investment objective
Toseeklong-termcapitalappreciationbyinvestingpredominantly
in equity and equity related securities of companies engaged
in or expected to benefit from the growth and development
of infrastructure.
l	 Fund Manager ¥
Srinivas Rao Ravuri (since March 20, 17)
Total Experience: Over 22 years
l	 Inception Date (Date of Allotment)
March 10, 2008
	 NAV (as on July 31, 2017)	 NAV per Unit (`)
Regular Plan - Growth Option	 20.318
Regular Plan - Dividend Option	 15.305
Direct Plan - Growth Option	 21.090
Direct Plan - Dividend Option	 19.329
	 aSSETS UNDER MANAGEMENT	 (`) IN CRORE
As on July 31, 2017	 1,379.68
Average for Month of July, 2017	 1,358.15
l	 quantitative data
Portfolio Turnover Ratio (Last 1 year)	 6.01%
Risk Ratio
n	 Standard Deviation	 5.610%
n	 Beta	 1.267
n	 Sharpe Ratio*	 0.106
Computed for the 3-yr period ended July 31, 2017. Based on
month-endNAV.*Riskfreerate:6.25%(Source:FIMMDAMIBOR)
	 Total Expense Ratio (Weighted Average for the month)
Excluding Goods and Service Tax on Management Fees
Regular: 2.18%	 Direct: 1.38%
l	 #BENCHMARK INDEX: NIFTY 500 Index
l	 ##addl. BENCHMARK INDEX: NIFTY 50 Index
l	 Exit Load
l	 In respect of each purchase / switch-in of Units, an Exit
Load of 1.00% is payable if Units are redeemed / switched-
out within 1 year from the date of allotment.
l	 No Exit Load is payable if Units are redeemed / switched-
out after 1 year from the date of allotment.
For further details, please refer to para ‘Exit Load’ on Pg 51.
l	 PlanS & Options
Regular Plan, Direct Plan. Under Each Plan : Growth &
Dividend. The Dividend Option offers Dividend Payout and
Reinvestment facility.
l	 Minimum Application Amount
Purchase : ` 5,000 and any amount thereafter.
Additional Purchase : ` 1,000 and any amount thereafter.
l	 Redemption Proceeds
Normally despatched within 3-4 Business Days (Redemption
is subject to completion of Lock-in Period, if applicable).
¥ Dedicated Fund Manager for Overseas Investments:
Mr Rakesh Vyas (Total Experience: Over 10 years).
HDFC Infrastructure Fund (An open-ended equity scheme)
SIP Performance^ - Regular Plan - Growth Option
Since Inception
SIP
5 year
SIP
3 year
SIP
1 year
SIP
Total Amount Invested (` ‘000) 1,130.00 600.00 360.00 120.00
Mkt Value as on July 31, 2017 (` ‘000) 2,138.70 963.58 455.53 141.26
Returns (Annualised) (%) 13.06 19.03 15.91 34.60
Benchmark Returns (Annualised) (%) # 13.25 16.26 15.41 28.75
Addl. Benchmark Ret. (Annualised) (%) ## 11.62 13.26 12.60 26.58
Assuming ` 10,000 invested systematically on the first Business Day of every month over a period of time. CAGR returns are computed
after accounting for the cash flow by using XIRR method (investment internal rate of return) for Regular Plan - Growth Option. The above
investment simulation is for illustrative purposes only and should not be construed as a promise on minimum returns and safeguard of capital.
Performance^ - Regular Plan - Growth Option
Date Period Scheme
Returns
(%)
Benchmark
Returns
(%)#
Additional
Benchmark
Returns
(%) ##
Value of ` 10,000 invested
Scheme (`) Benchmark
(`)#
Additional
Benchmark
(`)##
Jul 29, 16 Last 1 Year 25.07 19.84 16.56 12,523 11,996 11,665
Jul 31, 14 Last 3 Years 12.10 12.38 9.27 14,092 14,195 13,051
Jul 31, 12 Last 5 Years 16.24 16.33 14.01 21,233 21,310 19,272
Mar 10, 08 Since Inception 7.84 8.95 8.21 20,318 22,387 20,992
Returns greater than 1 year period are compounded annualized (CAGR). For performance of other schemes managed by Srinivas Rao Ravuri,
please refer page 51. Different plans viz. Regular Plan and Direct Plan have a different expense structure. The expenses of the Direct Plan
under the Scheme will be lower to the extent of the distribution expenses / commission charged in the Regular Plan. For Performance of
Direct Plan, refer page no. 60.
Face Value per Unit: ` 10 unless otherwise specified, + Industry Classification as recommended by AMFI, Data is as of July 31, 2017 unless otherwise specified.
This product is suitable for investors who are seeking ~
l	 Capital appreciation over long term.
l	 Investment predominantly in equity and equity related
securities of companies engaged in or expected to benefit
from the growth and development of infrastructure.
Riskometer
Investors understand that their principal will be at high risk
~ Investors should consult their financial advisers if in doubt
about whether the product is suitable for them.
Portfolio
Company Industry+ % to NAV
Equity & Equity Related
•	State Bank of India Banks 9.60
•	Larsen & Toubro Ltd. Construction Project 8.69
•	ICICI Bank Ltd. Banks 7.48
•	Siemens Ltd. Industrial Capital Goods 5.09
•	JMC Projects (India) Ltd. Construction 3.88
•	CESC Ltd. Power 3.79
•	Bank of Baroda Banks 3.79
•	Hindustan Construction
Company Ltd. Construction Project 3.66
•	Punjab National Bank Banks 3.62
•	Astra Microwave
Products Ltd.
Telecom - Equipment &
Accessories 3.00
Premier Explosives Ltd. Chemicals 2.92
Simplex Infrastructures Ltd. Construction 2.66
Centum Electronics Ltd. Industrial Capital Goods 2.51
Maruti Suzuki India Ltd. Auto 2.50
Dilip Buildcon Ltd. Construction 2.49
BEML Ltd. Industrial Capital Goods 2.45
HBL Power Systems Ltd. Consumer Non Durables 2.34
Dynamatic Technologies Ltd. Auto Ancillaries 2.08
Canara Bank Banks 2.05
B L Kashyap & Sons Ltd. Construction 2.05
Texmaco Rail & Engineering Ltd. Industrial Capital Goods 2.00
PNC Infratech Ltd. Construction 1.94
KEC International Ltd. Construction Project 1.93
MEP Infrastructure
Developers Ltd. Transportation 1.66
Crompton Greaves Ltd. Industrial Capital Goods 1.41
ITD Cementation India Ltd. Construction 1.29
Vedanta Ltd. Non - Ferrous Metals 1.26
Sanghvi Movers Ltd Industrial Capital Goods 1.16
Gammon Infrastructure
Projects Ltd. Construction Project 1.03
Tata Steel Ltd. Ferrous Metals 0.99
Everest Industries Ltd. Cement 0.88
Tata Motors Ltd. DVR Auto 0.85
Transformers And Rectifiers
(India) Ltd.
Industrial Capital
Goods 0.83
SadbhavInfrastructureProjectLtd Construction Project 0.74
Sadbhav Engineering Ltd. Construction Project 0.60
Corporation Bank Banks 0.60
J.Kumar Infraprojects Ltd. Construction 0.58
Elecon Engineering Co. Ltd. Industrial Capital Goods 0.51
Swelect Energy Systems Ltd. Industrial Capital Goods 0.49
C & C Constructions Ltd. Construction 0.44
Company Industry+ % to NAV
KSK Energy Ventures Ltd. Power 0.40
Oriental Bank of Commerce Banks 0.26
Rural Electrification
Corporation Ltd. Finance 0.25
Pennar Engineered Bldg
Systems Ltd Ferrous Metals 0.24
Jaiprakash Power Ventures Ltd. Power 0.19
Power Finance Corporation Ltd. Finance 0.15
Easun Reyrolle Ltd. Industrial Capital Goods 0.08
Total 99.41
Preference Shares
Vedanta Ltd. Non - Ferrous Metals 0.16
Sub Total 0.16
Total 99.57
Cash, Cash Equivalents and Net Current Assets 0.43
Grand Total 100.00
•	Top Ten Holdings
0.40
0.88
1.23
1.42
1.66
2.08
2.34
2.92
3.00
3.35
4.38
15.33
16.53
16.65
27.40
0 5 10 15 20 25 30
Finance
Cement
Ferrous Metals
Non - Ferrous Metals
Transportation
Auto Ancillaries
Consumer Non Durables
Chemicals
Telecom - Equipment & Accessories
Auto
Power
Construction
Industrial Capital Goods
Construction Project
Banks
Industry Allocation of Equity Holding (% of Net Assets)
^Past performance may or may not be sustained in the future. Load is not taken into consideration for computation of performance.
Intouch mutually	 July 2017	15
HDFC Balanced Fund (An open-ended balanced scheme)
l	 investment objective
To generate capital appreciation along with current income
from a combined portfolio of equity & equity related and debt
and money market instruments.
l	 Fund Manager ¥
Chirag Setalvad (since April 2, 07)
Total Experience - Over 17 years
l	 Inception Date (Date of Allotment)
September 11, 2000
	 NAV (as on July 31, 2017)	 NAV per Unit (`)
Regular Plan - Growth Option	 144.004
Regular Plan - Dividend Option	 31.685
Direct Plan - Growth Option	 149.688
Direct Plan - Dividend Option	 34.515
	 aSSETS UNDER MANAGEMENT	 (`) IN CRORE
As on July 31, 2017	 13,824.15
Average for Month of July, 2017	 13,207.81
l	 quantitative data
Portfolio Turnover Ratio (Last 1 year)	 35.07%
Average Maturity *	 7.41 years
Modified Duration *	 4.39 years
Yield to Maturity *	 7.12%
* Computed on the invested amount for debt portfolio.
	 Total Expense Ratio (Weighted Average for the month)
Excluding Goods and Service Tax on Management Fees
Regular: 1.95%	 Direct: 0.85%
l	 #BENCHMARKINDEX:CRISILBalancedFund-AggressiveIndex
l	 ##addl. BENCHMARK INDEX: NIFTY 50 Index
l	 Exit Load
l	 In respect of each purchase / switch-in of Units, upto 15%
of the units may be redeemed without any exit load from
the date of allotment.
l	 Any redemption in excess of the above limit shall be subject
to the following exit load:
	 n	 Exit load of 1.00% is payable if Units are redeemed /
switched-out within 1 year from the date of allotment
of units.
l	 No Exit Load is payable if Units are redeemed / switched-
out after 1 year from the date of allotment.
For further details, please refer to para ‘Exit Load’ on Pg 51.
l	 PlanS & Options
Regular Plan, Direct Plan. Under Each Plan : Growth &
Dividend. The Dividend Option offers Dividend Payout and
Reinvestment facility.
l	 Minimum Application Amount
Purchase : ` 5,000 and any amount thereafter.
Additional Purchase : ` 1,000 and any amount thereafter.
l	 Redemption Proceeds
Normally despatched within 3-4 Business Days.
¥ Dedicated Fund Manager for Overseas Investments:
Mr Rakesh Vyas (Total Experience - Over 10 years).
Face Value per Unit: ` 10 unless otherwise specified, + Industry Classification as recommended by AMFI, Data is as of July 31, 2017 unless otherwise specified.	 ....Contd on next page
This product is suitable for investors who are seeking ~
l	 Capital appreciation along with current income over long term.
l	 Investmentpredominantlyinequityandequity relatedinstruments
with balance exposure to debt and money market instruments.
Riskometer
Investors understand that their principal will be at
moderately high risk
~ Investors should consult their financial advisers if in doubt
about whether the product is suitable for them.
Portfolio
Company Industry+ / Rating % to NAV
Equity & Equity Related
•	HDFC Bank Ltd. Banks 5.28
•	Larsen & Toubro Ltd. Construction Project 3.84
•	Reliance Industries Ltd. Petroleum Products 3.56
•	ITC Ltd. Consumer Non Durables 3.06
•	ICICI Bank Ltd. Banks 2.97
•	State Bank of India Banks 2.51
•	Housing Development
Finance Corporation Ltd.£ Finance 2.34
•	Tube Investments of India Ltd. Auto Ancillaries 2.31
•	Aurobindo Pharma Ltd. Pharmaceuticals 2.07
Power Grid Corporation of
India Ltd. Power 1.97
Voltas Ltd. Construction Project 1.96
Infosys Ltd. Software 1.89
Indusind Bank Ltd. Banks 1.65
Aarti Industries Ltd. Chemicals 1.57
Vedanta Ltd. Non - Ferrous Metals 1.45
Tata Steel Ltd. Ferrous Metals 1.40
Federal Bank Ltd. Banks 1.24
KEC International Ltd. Construction Project 1.22
Bharti Airtel Ltd. Telecom - Services 1.14
Bharat Petroleum Corporation Ltd. Petroleum Products 1.05
Hindustan Petroleum
Corporation Ltd. Petroleum Products 1.03
Tata Motors Ltd. DVR Auto 1.01
Cholamandalam Investment
and Finance Company Ltd. Finance 0.89
SKF India Ltd. Industrial Products 0.89
City Union Bank Ltd. Banks 0.88
Mahindra Holidays &
Resorts India Ltd
Hotels, Resorts & Other
Recreational Activities 0.87
Axis Bank Ltd. Banks 0.83
Redington (India) Limited Transportation 0.77
The Indian Hotels
Company Ltd.
Hotels, Resorts & Other
Recreational Activities 0.76
Balkrishna Industries Ltd. Auto Ancillaries 0.75
Bajaj Finance Ltd. Finance 0.75
PNC Infratech Ltd. Construction 0.75
Hero MotoCorp Ltd. Auto 0.69
Tamil Nadu Newsprint &
Papers Ltd. Paper 0.65
Bank of Baroda Banks 0.65
Torrent Pharmaceuticals Ltd. Pharmaceuticals 0.62
VST Industries Ltd. Consumer Non Durables 0.61
MRF Ltd. Auto Ancillaries 0.59
Tata Consultancy Services Ltd. Software 0.56
Oil & Natural Gas
Corporation Ltd. Oil 0.51
Greenply Industries Ltd. Consumer Durables 0.48
Kalpataru Power
Transmission Ltd. Power 0.48
Avenue Supermarts Ltd. Retailing 0.45
Carborundum Universal Ltd. Industrial Products 0.45
Union Bank of India Banks 0.44
Indian Bank Banks 0.41
Atul Ltd. Chemicals 0.41
Hexaware Technologies Ltd. Software 0.39
Bharat Electronics Ltd. Industrial Capital Goods 0.39
Sadbhav Engineering Ltd. Construction Project 0.37
Zensar Technologies Ltd. Software 0.37
Navneet Education Ltd. Media & Entertainment 0.36
Rallis India Ltd. Pesticides 0.36
Kaveri Seed Company Ltd. Consumer Non Durables 0.33
IPCA Laboratories Ltd. Pharmaceuticals 0.32
NIIT Technologies Ltd. Software 0.31
Insecticides (India) Ltd. Pesticides 0.31
Allahabad Bank Banks 0.18
Atul Auto Ltd. Auto 0.18
Fag Bearings India Ltd. Industrial Products 0.17
J.Kumar Infraprojects Ltd. Construction 0.17
Lupin Ltd. Pharmaceuticals 0.15
MM Forgings Ltd. Industrial Products 0.13
Company Industry+ / Rating % to NAV
Persistent Systems Limited Software 0.12
Crompton Greaves Ltd. Industrial Capital Goods 0.03
Sub Total 67.30
Preference Shares
Vedanta Ltd. Non - Ferrous Metals 0.12
Sub Total 0.12
Total 67.42
Debt & Debt Related
Government Securities
8.13 GOI 2045 Sovereign 1.81
8.24 GOI 2033 Sovereign 1.38
8.20 GOI 2025 Sovereign 1.36
8.32 GOI 2032 Sovereign 1.32
7.16 GOI 2023 Sovereign 1.26
7.35 GOI 2024 Sovereign 1.12
8.08 GOI 2022 Sovereign 1.00
8.15 GOI 2022 Sovereign 0.84
7.88 GOI 2030 Sovereign 0.78
7.73 GOI 2034 Sovereign 0.77
7.72 GOI 2025 Sovereign 0.76
7.68 GOI 2023 Sovereign 0.61
8.17 GOI 2044 Sovereign 0.47
8.83 GOI 2023 Sovereign 0.43
8.97 GOI 2030 Sovereign 0.42
8.40 GOI 2024 Sovereign 0.39
8.60 GOI 2028 Sovereign 0.32
8.35 GOI 2022 Sovereign 0.31
6.35 GOI 2020 Sovereign 0.27
7.80 GOI 2020 Sovereign 0.19
8.12 GOI 2020 Sovereign 0.17
8.30 GOI 2040 Sovereign 0.03
8.20 GOI 2022 Sovereign 0.02
Sub Total 16.03
Credit Exposure
•	Housing Development
Finance Corporation Ltd.£ CRISIL - AAA 2.69
Punjab National Bank CRISIL - AA 0.72
Bank of India CRISIL - A+ 0.72
Cholamandalam Investment
and Finance Company Ltd. ICRA - AA 0.56
Shriram Transport
Finance Co. Ltd. CRISIL - AA+ 0.55
Tata Sons Ltd. CRISIL - AAA 0.40
State Bank of India CRISIL - AA+, AAA 0.39
Oriental Bank of Commerce ICRA - A, AA- 0.37
HDFC Bank Ltd. CRISIL - AAA 0.37
National Highways
Authority of India CRISIL - AAA 0.37
Small Industries Development
Bank of India CARE - AAA 0.37
Axis Bank Ltd. CRISIL - AA+ 0.37
L&T Finance Limited CARE - AA+ 0.36
LIC Housing Finance Ltd. CRISIL - AAA 0.26
Power Finance Corporation Ltd. CRISIL - AAA 0.25
Syndicate Bank CARE - AA- 0.23
ICICI Bank Ltd. CARE - AAA 0.18
IDBI Bank Ltd. ICRA - BBB- 0.17
Andhra Bank CARE - AA- 0.15
Vedanta Ltd. CRISIL - AA 0.12
Hindalco Industries Ltd. CRISIL - AA 0.08
Tata Motors Finance Ltd. CRISIL - AA 0.04
Sub Total 9.72
Cash margin / Earmarked cash for Futures & Options 0.87
Cash, Cash Equivalents and Net Current Assets 5.96
Grand Total 100.00
•	Top Ten Holdings, £ Co-sponsor
Outstanding exposure in
derivative instruments (` in Crore) 119.72
Hedged position in Equity & Equity related instruments
Outstanding derivative exposure (% age) 0.87
Equity 67.42
G-Sec 16.03
Credit Exposure 9.72
Cash, Cash Equivalents and
Net Current Assets 6.83
Equity 67.42
Sovereign 16.03
AAA/AAA(SO)/A1+/A1+(SO)
& Equivalent 4.91
AA+ & Below 4.81
Cash, Cash Equivalents and
Net Current Assets 6.83
Portfolio Classification by Asset Class (%) Portfolio Classification by Rating Class (%)
Factsheet for HDFC Mutual Fund

More Related Content

What's hot

Geojit profile reports
Geojit  profile  reportsGeojit  profile  reports
Geojit profile reports
Babasab Patil
 
Adani group
Adani groupAdani group
Adani group
Swarup Deogharia
 
HUL vs P&G
HUL vs P&GHUL vs P&G
HUL vs P&G
Saurabh Barnwal
 
BCG Matrix
BCG MatrixBCG Matrix
BCG Matrix
Rashida Siamwala
 
PROJECT REPORT ON MUTUAL FUNDS
PROJECT REPORT ON MUTUAL FUNDS PROJECT REPORT ON MUTUAL FUNDS
PROJECT REPORT ON MUTUAL FUNDS
Ramneet Singh Bhangu
 
A project report on comparative study of mutual funds in india
A project report on comparative study of mutual funds in indiaA project report on comparative study of mutual funds in india
A project report on comparative study of mutual funds in india
Projects Kart
 
I.T.C Ltd
I.T.C    LtdI.T.C    Ltd
I.T.C Ltdhome
 
Project on mutual funds study and survey
Project on mutual funds study and surveyProject on mutual funds study and survey
Project on mutual funds study and survey
Projects Kart
 
ICICI SECURITIES PROJECT REPORT
ICICI SECURITIES PROJECT REPORT ICICI SECURITIES PROJECT REPORT
ICICI SECURITIES PROJECT REPORT sumit singh
 
49017204 copy-of-motilaloswal-proj-a-2
49017204 copy-of-motilaloswal-proj-a-249017204 copy-of-motilaloswal-proj-a-2
49017204 copy-of-motilaloswal-proj-a-2
Ashish Pradhan
 
Raju omelet case solution
Raju omelet case solutionRaju omelet case solution
Raju omelet case solution
Sana Baloch
 
Dabur india
Dabur indiaDabur india
Dabur india
Quazi Ghous
 
summer internship project on ICICI MF
summer internship project on ICICI MF summer internship project on ICICI MF
summer internship project on ICICI MF
shubham5ashtikar
 
25786437 questionnaire-on-mutual-fund-invetment
25786437 questionnaire-on-mutual-fund-invetment25786437 questionnaire-on-mutual-fund-invetment
25786437 questionnaire-on-mutual-fund-invetment
9015207039
 
Project report on goodrej
Project   report on goodrejProject   report on goodrej
Project report on goodrej
Aryan Parmar
 
Study of Investor Perception towards Mutual Funds
Study of Investor Perception towards Mutual FundsStudy of Investor Perception towards Mutual Funds
Study of Investor Perception towards Mutual Funds
MeghnaJaiswal6
 
Godrej ppt
Godrej pptGodrej ppt
Godrej ppt
Anurag Pandey
 
project report on aditya birla mutual funds AMC topic marketing of mutual fun...
project report on aditya birla mutual funds AMC topic marketing of mutual fun...project report on aditya birla mutual funds AMC topic marketing of mutual fun...
project report on aditya birla mutual funds AMC topic marketing of mutual fun...
robin7017
 
Analysing the competitor factor in HUL
Analysing the competitor factor  in HUL Analysing the competitor factor  in HUL
Analysing the competitor factor in HUL
Babasab Patil
 
Air India ppt
Air India pptAir India ppt
Air India ppt
AzraNadaf1
 

What's hot (20)

Geojit profile reports
Geojit  profile  reportsGeojit  profile  reports
Geojit profile reports
 
Adani group
Adani groupAdani group
Adani group
 
HUL vs P&G
HUL vs P&GHUL vs P&G
HUL vs P&G
 
BCG Matrix
BCG MatrixBCG Matrix
BCG Matrix
 
PROJECT REPORT ON MUTUAL FUNDS
PROJECT REPORT ON MUTUAL FUNDS PROJECT REPORT ON MUTUAL FUNDS
PROJECT REPORT ON MUTUAL FUNDS
 
A project report on comparative study of mutual funds in india
A project report on comparative study of mutual funds in indiaA project report on comparative study of mutual funds in india
A project report on comparative study of mutual funds in india
 
I.T.C Ltd
I.T.C    LtdI.T.C    Ltd
I.T.C Ltd
 
Project on mutual funds study and survey
Project on mutual funds study and surveyProject on mutual funds study and survey
Project on mutual funds study and survey
 
ICICI SECURITIES PROJECT REPORT
ICICI SECURITIES PROJECT REPORT ICICI SECURITIES PROJECT REPORT
ICICI SECURITIES PROJECT REPORT
 
49017204 copy-of-motilaloswal-proj-a-2
49017204 copy-of-motilaloswal-proj-a-249017204 copy-of-motilaloswal-proj-a-2
49017204 copy-of-motilaloswal-proj-a-2
 
Raju omelet case solution
Raju omelet case solutionRaju omelet case solution
Raju omelet case solution
 
Dabur india
Dabur indiaDabur india
Dabur india
 
summer internship project on ICICI MF
summer internship project on ICICI MF summer internship project on ICICI MF
summer internship project on ICICI MF
 
25786437 questionnaire-on-mutual-fund-invetment
25786437 questionnaire-on-mutual-fund-invetment25786437 questionnaire-on-mutual-fund-invetment
25786437 questionnaire-on-mutual-fund-invetment
 
Project report on goodrej
Project   report on goodrejProject   report on goodrej
Project report on goodrej
 
Study of Investor Perception towards Mutual Funds
Study of Investor Perception towards Mutual FundsStudy of Investor Perception towards Mutual Funds
Study of Investor Perception towards Mutual Funds
 
Godrej ppt
Godrej pptGodrej ppt
Godrej ppt
 
project report on aditya birla mutual funds AMC topic marketing of mutual fun...
project report on aditya birla mutual funds AMC topic marketing of mutual fun...project report on aditya birla mutual funds AMC topic marketing of mutual fun...
project report on aditya birla mutual funds AMC topic marketing of mutual fun...
 
Analysing the competitor factor in HUL
Analysing the competitor factor  in HUL Analysing the competitor factor  in HUL
Analysing the competitor factor in HUL
 
Air India ppt
Air India pptAir India ppt
Air India ppt
 

Similar to Factsheet for HDFC Mutual Fund

mutual funds ABOUT TYPES OF MUTUAL FUNDS
mutual funds ABOUT TYPES OF MUTUAL FUNDSmutual funds ABOUT TYPES OF MUTUAL FUNDS
mutual funds ABOUT TYPES OF MUTUAL FUNDS
SarthakSharma328485
 
9
99
Factsheet of Baroda Pioneer Mutual Fund- Wishfin
Factsheet of Baroda Pioneer Mutual Fund- WishfinFactsheet of Baroda Pioneer Mutual Fund- Wishfin
Factsheet of Baroda Pioneer Mutual Fund- Wishfin
Anvi Sharma
 
Net assets value of mutual fund
Net assets value of mutual fundNet assets value of mutual fund
Net assets value of mutual fundYashika Vashistha
 
A Sampling of Investment Ideas #2
A Sampling of Investment Ideas #2A Sampling of Investment Ideas #2
A Sampling of Investment Ideas #2
David Williams
 
Unit 5
Unit 5Unit 5
Problem111111111
Problem111111111Problem111111111
Problem111111111
Hazur Saran
 
Glossary on mutual funds
Glossary on mutual fundsGlossary on mutual funds
Glossary on mutual funds
Babasab Patil
 
Pranav kapse sip
Pranav kapse sipPranav kapse sip
Pranav kapse sip
AGRIFORCESALES
 
Pranav kapse sip
Pranav kapse sipPranav kapse sip
Pranav kapse sip
AGRIFORCESALES
 
Investment Valuation Ratios
Investment Valuation RatiosInvestment Valuation Ratios
Investment Valuation Ratios
MajorGainz
 
Fundamental Analysis by Vivek Srivastava
Fundamental Analysis by Vivek SrivastavaFundamental Analysis by Vivek Srivastava
Fundamental Analysis by Vivek Srivastava
Axis Direct
 
awais presentation.pptx
awais presentation.pptxawais presentation.pptx
awais presentation.pptx
SardarBilal15
 
p961.pdf
p961.pdfp961.pdf
p961.pdf
TaraThompson40
 
Analysing_an_Equity_Mutual_Fund_Fact_Sheet_Risk_&_Performance_Parameters (1)
Analysing_an_Equity_Mutual_Fund_Fact_Sheet_Risk_&_Performance_Parameters (1)Analysing_an_Equity_Mutual_Fund_Fact_Sheet_Risk_&_Performance_Parameters (1)
Analysing_an_Equity_Mutual_Fund_Fact_Sheet_Risk_&_Performance_Parameters (1)Sanjay Ananda Rao
 

Similar to Factsheet for HDFC Mutual Fund (20)

mutual funds ABOUT TYPES OF MUTUAL FUNDS
mutual funds ABOUT TYPES OF MUTUAL FUNDSmutual funds ABOUT TYPES OF MUTUAL FUNDS
mutual funds ABOUT TYPES OF MUTUAL FUNDS
 
9
99
9
 
Factsheet of Baroda Pioneer Mutual Fund- Wishfin
Factsheet of Baroda Pioneer Mutual Fund- WishfinFactsheet of Baroda Pioneer Mutual Fund- Wishfin
Factsheet of Baroda Pioneer Mutual Fund- Wishfin
 
Net assets value of mutual fund
Net assets value of mutual fundNet assets value of mutual fund
Net assets value of mutual fund
 
A Sampling of Investment Ideas #2
A Sampling of Investment Ideas #2A Sampling of Investment Ideas #2
A Sampling of Investment Ideas #2
 
Unit 5
Unit 5Unit 5
Unit 5
 
Problem111111111
Problem111111111Problem111111111
Problem111111111
 
Glossary on mutual funds
Glossary on mutual fundsGlossary on mutual funds
Glossary on mutual funds
 
Pranav kapse sip
Pranav kapse sipPranav kapse sip
Pranav kapse sip
 
Pranav kapse sip
Pranav kapse sipPranav kapse sip
Pranav kapse sip
 
Investment Valuation Ratios
Investment Valuation RatiosInvestment Valuation Ratios
Investment Valuation Ratios
 
Angel broking
Angel brokingAngel broking
Angel broking
 
Fundamental Analysis by Vivek Srivastava
Fundamental Analysis by Vivek SrivastavaFundamental Analysis by Vivek Srivastava
Fundamental Analysis by Vivek Srivastava
 
awais presentation.pptx
awais presentation.pptxawais presentation.pptx
awais presentation.pptx
 
E
EE
E
 
p961.pdf
p961.pdfp961.pdf
p961.pdf
 
EQUITY MUTUAL FUND
EQUITY MUTUAL FUNDEQUITY MUTUAL FUND
EQUITY MUTUAL FUND
 
Rasio keuangan
Rasio keuanganRasio keuangan
Rasio keuangan
 
Suraj
SurajSuraj
Suraj
 
Analysing_an_Equity_Mutual_Fund_Fact_Sheet_Risk_&_Performance_Parameters (1)
Analysing_an_Equity_Mutual_Fund_Fact_Sheet_Risk_&_Performance_Parameters (1)Analysing_an_Equity_Mutual_Fund_Fact_Sheet_Risk_&_Performance_Parameters (1)
Analysing_an_Equity_Mutual_Fund_Fact_Sheet_Risk_&_Performance_Parameters (1)
 

More from Anvi Sharma

Additional Information of Mirae Asset Mutual Fund- Wishfin
Additional Information of Mirae Asset Mutual Fund- WishfinAdditional Information of Mirae Asset Mutual Fund- Wishfin
Additional Information of Mirae Asset Mutual Fund- Wishfin
Anvi Sharma
 
Factsheet for Mirae Asset Mutual Fund- Wishfin
Factsheet for Mirae Asset Mutual Fund- WishfinFactsheet for Mirae Asset Mutual Fund- Wishfin
Factsheet for Mirae Asset Mutual Fund- Wishfin
Anvi Sharma
 
Additional Information of Baroda Pioneer Mutual Fund- Wishfin
Additional Information of Baroda Pioneer Mutual Fund- WishfinAdditional Information of Baroda Pioneer Mutual Fund- Wishfin
Additional Information of Baroda Pioneer Mutual Fund- Wishfin
Anvi Sharma
 
Additional Information of Principal Mutual Fund- Wishfin
Additional Information of Principal Mutual Fund- WishfinAdditional Information of Principal Mutual Fund- Wishfin
Additional Information of Principal Mutual Fund- Wishfin
Anvi Sharma
 
Factsheet for Principal Mutual Fund- Wishfin
Factsheet for Principal Mutual Fund- WishfinFactsheet for Principal Mutual Fund- Wishfin
Factsheet for Principal Mutual Fund- Wishfin
Anvi Sharma
 
Additional Information of DSP BlackRock Mutual Fund- Wishfin
Additional Information of DSP BlackRock Mutual Fund- WishfinAdditional Information of DSP BlackRock Mutual Fund- Wishfin
Additional Information of DSP BlackRock Mutual Fund- Wishfin
Anvi Sharma
 
Factsheet for DSP Blackrock Mutual Fund- Wishfin
Factsheet for DSP Blackrock Mutual Fund- WishfinFactsheet for DSP Blackrock Mutual Fund- Wishfin
Factsheet for DSP Blackrock Mutual Fund- Wishfin
Anvi Sharma
 
Additional Information of Axis Mutual Fund- Wishfin
Additional Information of Axis Mutual Fund- WishfinAdditional Information of Axis Mutual Fund- Wishfin
Additional Information of Axis Mutual Fund- Wishfin
Anvi Sharma
 
Factsheet for Axis Mutual Fund- Wishfin
Factsheet for Axis Mutual Fund- WishfinFactsheet for Axis Mutual Fund- Wishfin
Factsheet for Axis Mutual Fund- Wishfin
Anvi Sharma
 
Additional Information of Franklin Templeton Mutual Fund- Wishfin
Additional Information of Franklin Templeton Mutual Fund- WishfinAdditional Information of Franklin Templeton Mutual Fund- Wishfin
Additional Information of Franklin Templeton Mutual Fund- Wishfin
Anvi Sharma
 
Factsheet for Franklin Templeton Mutual Fund- Wishfin
Factsheet for Franklin Templeton Mutual Fund- WishfinFactsheet for Franklin Templeton Mutual Fund- Wishfin
Factsheet for Franklin Templeton Mutual Fund- Wishfin
Anvi Sharma
 
Additional Information of UTI Mutual Fund- Wishfin
Additional Information of UTI Mutual Fund- WishfinAdditional Information of UTI Mutual Fund- Wishfin
Additional Information of UTI Mutual Fund- Wishfin
Anvi Sharma
 
Factsheet for UTI Mutual Fund- Wishfin
Factsheet for UTI Mutual Fund- WishfinFactsheet for UTI Mutual Fund- Wishfin
Factsheet for UTI Mutual Fund- Wishfin
Anvi Sharma
 
Additional Information of Birla Sun Life Mutual Fund- Wishfin
Additional Information of Birla Sun Life Mutual Fund- WishfinAdditional Information of Birla Sun Life Mutual Fund- Wishfin
Additional Information of Birla Sun Life Mutual Fund- Wishfin
Anvi Sharma
 
Additional Information of SBI Mutual Fund- Wishfin
Additional Information of SBI Mutual Fund- WishfinAdditional Information of SBI Mutual Fund- Wishfin
Additional Information of SBI Mutual Fund- Wishfin
Anvi Sharma
 
Factsheet for SBI Mutual Fund- Wishfin
Factsheet for SBI Mutual Fund- WishfinFactsheet for SBI Mutual Fund- Wishfin
Factsheet for SBI Mutual Fund- Wishfin
Anvi Sharma
 
Factsheet for Birla Sun Life Mutual Fund- Wishfin
Factsheet for Birla Sun Life Mutual Fund- WishfinFactsheet for Birla Sun Life Mutual Fund- Wishfin
Factsheet for Birla Sun Life Mutual Fund- Wishfin
Anvi Sharma
 
Statement of Additional Information for HDFC Mutual Fund
Statement of Additional Information for HDFC Mutual FundStatement of Additional Information for HDFC Mutual Fund
Statement of Additional Information for HDFC Mutual Fund
Anvi Sharma
 
Factsheet for ICICI Prudential Mutual Fund
Factsheet for ICICI Prudential Mutual FundFactsheet for ICICI Prudential Mutual Fund
Factsheet for ICICI Prudential Mutual Fund
Anvi Sharma
 

More from Anvi Sharma (19)

Additional Information of Mirae Asset Mutual Fund- Wishfin
Additional Information of Mirae Asset Mutual Fund- WishfinAdditional Information of Mirae Asset Mutual Fund- Wishfin
Additional Information of Mirae Asset Mutual Fund- Wishfin
 
Factsheet for Mirae Asset Mutual Fund- Wishfin
Factsheet for Mirae Asset Mutual Fund- WishfinFactsheet for Mirae Asset Mutual Fund- Wishfin
Factsheet for Mirae Asset Mutual Fund- Wishfin
 
Additional Information of Baroda Pioneer Mutual Fund- Wishfin
Additional Information of Baroda Pioneer Mutual Fund- WishfinAdditional Information of Baroda Pioneer Mutual Fund- Wishfin
Additional Information of Baroda Pioneer Mutual Fund- Wishfin
 
Additional Information of Principal Mutual Fund- Wishfin
Additional Information of Principal Mutual Fund- WishfinAdditional Information of Principal Mutual Fund- Wishfin
Additional Information of Principal Mutual Fund- Wishfin
 
Factsheet for Principal Mutual Fund- Wishfin
Factsheet for Principal Mutual Fund- WishfinFactsheet for Principal Mutual Fund- Wishfin
Factsheet for Principal Mutual Fund- Wishfin
 
Additional Information of DSP BlackRock Mutual Fund- Wishfin
Additional Information of DSP BlackRock Mutual Fund- WishfinAdditional Information of DSP BlackRock Mutual Fund- Wishfin
Additional Information of DSP BlackRock Mutual Fund- Wishfin
 
Factsheet for DSP Blackrock Mutual Fund- Wishfin
Factsheet for DSP Blackrock Mutual Fund- WishfinFactsheet for DSP Blackrock Mutual Fund- Wishfin
Factsheet for DSP Blackrock Mutual Fund- Wishfin
 
Additional Information of Axis Mutual Fund- Wishfin
Additional Information of Axis Mutual Fund- WishfinAdditional Information of Axis Mutual Fund- Wishfin
Additional Information of Axis Mutual Fund- Wishfin
 
Factsheet for Axis Mutual Fund- Wishfin
Factsheet for Axis Mutual Fund- WishfinFactsheet for Axis Mutual Fund- Wishfin
Factsheet for Axis Mutual Fund- Wishfin
 
Additional Information of Franklin Templeton Mutual Fund- Wishfin
Additional Information of Franklin Templeton Mutual Fund- WishfinAdditional Information of Franklin Templeton Mutual Fund- Wishfin
Additional Information of Franklin Templeton Mutual Fund- Wishfin
 
Factsheet for Franklin Templeton Mutual Fund- Wishfin
Factsheet for Franklin Templeton Mutual Fund- WishfinFactsheet for Franklin Templeton Mutual Fund- Wishfin
Factsheet for Franklin Templeton Mutual Fund- Wishfin
 
Additional Information of UTI Mutual Fund- Wishfin
Additional Information of UTI Mutual Fund- WishfinAdditional Information of UTI Mutual Fund- Wishfin
Additional Information of UTI Mutual Fund- Wishfin
 
Factsheet for UTI Mutual Fund- Wishfin
Factsheet for UTI Mutual Fund- WishfinFactsheet for UTI Mutual Fund- Wishfin
Factsheet for UTI Mutual Fund- Wishfin
 
Additional Information of Birla Sun Life Mutual Fund- Wishfin
Additional Information of Birla Sun Life Mutual Fund- WishfinAdditional Information of Birla Sun Life Mutual Fund- Wishfin
Additional Information of Birla Sun Life Mutual Fund- Wishfin
 
Additional Information of SBI Mutual Fund- Wishfin
Additional Information of SBI Mutual Fund- WishfinAdditional Information of SBI Mutual Fund- Wishfin
Additional Information of SBI Mutual Fund- Wishfin
 
Factsheet for SBI Mutual Fund- Wishfin
Factsheet for SBI Mutual Fund- WishfinFactsheet for SBI Mutual Fund- Wishfin
Factsheet for SBI Mutual Fund- Wishfin
 
Factsheet for Birla Sun Life Mutual Fund- Wishfin
Factsheet for Birla Sun Life Mutual Fund- WishfinFactsheet for Birla Sun Life Mutual Fund- Wishfin
Factsheet for Birla Sun Life Mutual Fund- Wishfin
 
Statement of Additional Information for HDFC Mutual Fund
Statement of Additional Information for HDFC Mutual FundStatement of Additional Information for HDFC Mutual Fund
Statement of Additional Information for HDFC Mutual Fund
 
Factsheet for ICICI Prudential Mutual Fund
Factsheet for ICICI Prudential Mutual FundFactsheet for ICICI Prudential Mutual Fund
Factsheet for ICICI Prudential Mutual Fund
 

Recently uploaded

The Parable of the Pipeline a book every new businessman or business student ...
The Parable of the Pipeline a book every new businessman or business student ...The Parable of the Pipeline a book every new businessman or business student ...
The Parable of the Pipeline a book every new businessman or business student ...
awaisafdar
 
Recruiting in the Digital Age: A Social Media Masterclass
Recruiting in the Digital Age: A Social Media MasterclassRecruiting in the Digital Age: A Social Media Masterclass
Recruiting in the Digital Age: A Social Media Masterclass
LuanWise
 
Digital Transformation and IT Strategy Toolkit and Templates
Digital Transformation and IT Strategy Toolkit and TemplatesDigital Transformation and IT Strategy Toolkit and Templates
Digital Transformation and IT Strategy Toolkit and Templates
Aurelien Domont, MBA
 
5 Things You Need To Know Before Hiring a Videographer
5 Things You Need To Know Before Hiring a Videographer5 Things You Need To Know Before Hiring a Videographer
5 Things You Need To Know Before Hiring a Videographer
ofm712785
 
ikea_woodgreen_petscharity_dog-alogue_digital.pdf
ikea_woodgreen_petscharity_dog-alogue_digital.pdfikea_woodgreen_petscharity_dog-alogue_digital.pdf
ikea_woodgreen_petscharity_dog-alogue_digital.pdf
agatadrynko
 
Buy Verified PayPal Account | Buy Google 5 Star Reviews
Buy Verified PayPal Account | Buy Google 5 Star ReviewsBuy Verified PayPal Account | Buy Google 5 Star Reviews
Buy Verified PayPal Account | Buy Google 5 Star Reviews
usawebmarket
 
The Influence of Marketing Strategy and Market Competition on Business Perfor...
The Influence of Marketing Strategy and Market Competition on Business Perfor...The Influence of Marketing Strategy and Market Competition on Business Perfor...
The Influence of Marketing Strategy and Market Competition on Business Perfor...
Adam Smith
 
Mastering B2B Payments Webinar from BlueSnap
Mastering B2B Payments Webinar from BlueSnapMastering B2B Payments Webinar from BlueSnap
Mastering B2B Payments Webinar from BlueSnap
Norma Mushkat Gaffin
 
The key differences between the MDR and IVDR in the EU
The key differences between the MDR and IVDR in the EUThe key differences between the MDR and IVDR in the EU
The key differences between the MDR and IVDR in the EU
Allensmith572606
 
falcon-invoice-discounting-a-premier-platform-for-investors-in-india
falcon-invoice-discounting-a-premier-platform-for-investors-in-indiafalcon-invoice-discounting-a-premier-platform-for-investors-in-india
falcon-invoice-discounting-a-premier-platform-for-investors-in-india
Falcon Invoice Discounting
 
Discover the innovative and creative projects that highlight my journey throu...
Discover the innovative and creative projects that highlight my journey throu...Discover the innovative and creative projects that highlight my journey throu...
Discover the innovative and creative projects that highlight my journey throu...
dylandmeas
 
Cracking the Workplace Discipline Code Main.pptx
Cracking the Workplace Discipline Code Main.pptxCracking the Workplace Discipline Code Main.pptx
Cracking the Workplace Discipline Code Main.pptx
Workforce Group
 
Enterprise Excellence is Inclusive Excellence.pdf
Enterprise Excellence is Inclusive Excellence.pdfEnterprise Excellence is Inclusive Excellence.pdf
Enterprise Excellence is Inclusive Excellence.pdf
KaiNexus
 
Exploring Patterns of Connection with Social Dreaming
Exploring Patterns of Connection with Social DreamingExploring Patterns of Connection with Social Dreaming
Exploring Patterns of Connection with Social Dreaming
Nicola Wreford-Howard
 
RMD24 | Retail media: hoe zet je dit in als je geen AH of Unilever bent? Heid...
RMD24 | Retail media: hoe zet je dit in als je geen AH of Unilever bent? Heid...RMD24 | Retail media: hoe zet je dit in als je geen AH of Unilever bent? Heid...
RMD24 | Retail media: hoe zet je dit in als je geen AH of Unilever bent? Heid...
BBPMedia1
 
Improving profitability for small business
Improving profitability for small businessImproving profitability for small business
Improving profitability for small business
Ben Wann
 
ikea_woodgreen_petscharity_cat-alogue_digital.pdf
ikea_woodgreen_petscharity_cat-alogue_digital.pdfikea_woodgreen_petscharity_cat-alogue_digital.pdf
ikea_woodgreen_petscharity_cat-alogue_digital.pdf
agatadrynko
 
ModelingMarketingStrategiesMKS.CollumbiaUniversitypdf
ModelingMarketingStrategiesMKS.CollumbiaUniversitypdfModelingMarketingStrategiesMKS.CollumbiaUniversitypdf
ModelingMarketingStrategiesMKS.CollumbiaUniversitypdf
fisherameliaisabella
 
What is the TDS Return Filing Due Date for FY 2024-25.pdf
What is the TDS Return Filing Due Date for FY 2024-25.pdfWhat is the TDS Return Filing Due Date for FY 2024-25.pdf
What is the TDS Return Filing Due Date for FY 2024-25.pdf
seoforlegalpillers
 
Project File Report BBA 6th semester.pdf
Project File Report BBA 6th semester.pdfProject File Report BBA 6th semester.pdf
Project File Report BBA 6th semester.pdf
RajPriye
 

Recently uploaded (20)

The Parable of the Pipeline a book every new businessman or business student ...
The Parable of the Pipeline a book every new businessman or business student ...The Parable of the Pipeline a book every new businessman or business student ...
The Parable of the Pipeline a book every new businessman or business student ...
 
Recruiting in the Digital Age: A Social Media Masterclass
Recruiting in the Digital Age: A Social Media MasterclassRecruiting in the Digital Age: A Social Media Masterclass
Recruiting in the Digital Age: A Social Media Masterclass
 
Digital Transformation and IT Strategy Toolkit and Templates
Digital Transformation and IT Strategy Toolkit and TemplatesDigital Transformation and IT Strategy Toolkit and Templates
Digital Transformation and IT Strategy Toolkit and Templates
 
5 Things You Need To Know Before Hiring a Videographer
5 Things You Need To Know Before Hiring a Videographer5 Things You Need To Know Before Hiring a Videographer
5 Things You Need To Know Before Hiring a Videographer
 
ikea_woodgreen_petscharity_dog-alogue_digital.pdf
ikea_woodgreen_petscharity_dog-alogue_digital.pdfikea_woodgreen_petscharity_dog-alogue_digital.pdf
ikea_woodgreen_petscharity_dog-alogue_digital.pdf
 
Buy Verified PayPal Account | Buy Google 5 Star Reviews
Buy Verified PayPal Account | Buy Google 5 Star ReviewsBuy Verified PayPal Account | Buy Google 5 Star Reviews
Buy Verified PayPal Account | Buy Google 5 Star Reviews
 
The Influence of Marketing Strategy and Market Competition on Business Perfor...
The Influence of Marketing Strategy and Market Competition on Business Perfor...The Influence of Marketing Strategy and Market Competition on Business Perfor...
The Influence of Marketing Strategy and Market Competition on Business Perfor...
 
Mastering B2B Payments Webinar from BlueSnap
Mastering B2B Payments Webinar from BlueSnapMastering B2B Payments Webinar from BlueSnap
Mastering B2B Payments Webinar from BlueSnap
 
The key differences between the MDR and IVDR in the EU
The key differences between the MDR and IVDR in the EUThe key differences between the MDR and IVDR in the EU
The key differences between the MDR and IVDR in the EU
 
falcon-invoice-discounting-a-premier-platform-for-investors-in-india
falcon-invoice-discounting-a-premier-platform-for-investors-in-indiafalcon-invoice-discounting-a-premier-platform-for-investors-in-india
falcon-invoice-discounting-a-premier-platform-for-investors-in-india
 
Discover the innovative and creative projects that highlight my journey throu...
Discover the innovative and creative projects that highlight my journey throu...Discover the innovative and creative projects that highlight my journey throu...
Discover the innovative and creative projects that highlight my journey throu...
 
Cracking the Workplace Discipline Code Main.pptx
Cracking the Workplace Discipline Code Main.pptxCracking the Workplace Discipline Code Main.pptx
Cracking the Workplace Discipline Code Main.pptx
 
Enterprise Excellence is Inclusive Excellence.pdf
Enterprise Excellence is Inclusive Excellence.pdfEnterprise Excellence is Inclusive Excellence.pdf
Enterprise Excellence is Inclusive Excellence.pdf
 
Exploring Patterns of Connection with Social Dreaming
Exploring Patterns of Connection with Social DreamingExploring Patterns of Connection with Social Dreaming
Exploring Patterns of Connection with Social Dreaming
 
RMD24 | Retail media: hoe zet je dit in als je geen AH of Unilever bent? Heid...
RMD24 | Retail media: hoe zet je dit in als je geen AH of Unilever bent? Heid...RMD24 | Retail media: hoe zet je dit in als je geen AH of Unilever bent? Heid...
RMD24 | Retail media: hoe zet je dit in als je geen AH of Unilever bent? Heid...
 
Improving profitability for small business
Improving profitability for small businessImproving profitability for small business
Improving profitability for small business
 
ikea_woodgreen_petscharity_cat-alogue_digital.pdf
ikea_woodgreen_petscharity_cat-alogue_digital.pdfikea_woodgreen_petscharity_cat-alogue_digital.pdf
ikea_woodgreen_petscharity_cat-alogue_digital.pdf
 
ModelingMarketingStrategiesMKS.CollumbiaUniversitypdf
ModelingMarketingStrategiesMKS.CollumbiaUniversitypdfModelingMarketingStrategiesMKS.CollumbiaUniversitypdf
ModelingMarketingStrategiesMKS.CollumbiaUniversitypdf
 
What is the TDS Return Filing Due Date for FY 2024-25.pdf
What is the TDS Return Filing Due Date for FY 2024-25.pdfWhat is the TDS Return Filing Due Date for FY 2024-25.pdf
What is the TDS Return Filing Due Date for FY 2024-25.pdf
 
Project File Report BBA 6th semester.pdf
Project File Report BBA 6th semester.pdfProject File Report BBA 6th semester.pdf
Project File Report BBA 6th semester.pdf
 

Factsheet for HDFC Mutual Fund

  • 2. 2 July 2017 Intouch mutually Fund Manager An employee of the asset management company such as a mutual fund or life insurer, who manages investments of the scheme. He is usually part of a larger team of fund managers and research analysts. Application Amount for Fresh Subscription This is the minimum investment amount for a new investor in a mutual fund scheme. Minimum Additional Amount This is the minimum investment amount for an existing investor in a mutual fund scheme. Yield to Maturity The Yield to Maturity or the YTM is the rate of return anticipated on a bond if held until maturity. YTM is expressed as an annual rate. The YTM factors in the bond’s current market price, par value, coupon interest rate and time to maturity. SIP SIP or systematic investment plan works on the principle of making periodic investments of a fixed sum. It works similar to a recurring bank deposit. For instance, an investor may opt for an SIP that invests Rs 500 every 15th of the month in an equity fund for a period of three years. NAV The NAV or the net asset value is the total asset value per unit of the mutual fund after deducting all related and permissible expenses. The NAV is calculated at the end of every business day. It is the value at which the investor enters or exits the mutual fund. Benchmark A group of securities, usually a market index, whose performance is used as a standard or benchmark to measure investment performance of mutual funds, among other investments. Some typical benchmarks include the NIFTY, Sensex, BSE200, BSE500, 10-Year Gsec. Entry Load A mutual fund may have a sales charge or load at the time of entry and/or exit to compensate the distributor/agent. Entry load is charged at the time an investor purchases the units of a mutual fund. The entry load is added to the prevailing NAV at the time of investment. For instance, if the NAV is Rs. 100 and the entry load is 1 %, the investor will enter the fund at Rs. 101. (Note: SEBI, vide circular dated June 30, 2009 has abolished entry load and mandated that the upfront commission to distributors will be paid by the investor directly to the distributor, based on his assessment of various factors including the service rendered by the distributor). Exit Load Exit load is charged at the time an investor redeems the units of a mutual fund. The exit load is reduced from the prevailing NAV at the time of redemption. The investor will receive redemption proceed at net value of NAV less Exit Load. For instance if the NAV is Rs. 100 and the exit load is 1%, the investor will receive Rs. 99. Modified Duration Modified duration is the price sensitivity and the percentage change in price for a unit change in yield. Standard Deviation Standard deviation is a statistical measure of the range of an investment’s performance. When a mutual fund has a high standard deviation, its means its range of performance is wide, implying greater volatility. Sharpe Ratio The Sharpe Ratio, named after its founder, the Nobel Laureate William Sharpe, is a measure of risk-adjusted returns. It is calculated using standard deviation and excess return to determine reward per unit of risk. Beta Ratio (Portfolio Beta) Beta is a measure of an investment’s volatility vis-a-vis the market. Beta of less than 1 means that the security will be less volatile than the market. A beta of greater than 1 implies that the security’s price will be more volatile than the market. Average portfolio PE (Average P/E) It is price to earnings ratio of the stocks calculated for the entire portfolio on a weighted average basis. Average portfolio price to book ratio (Average P/BV) It is price to book value of the stocks calculated for the entire portfolio on a weighted average basis. Average portfolio dividend yield (Average Dividend Yield) It is dividend yield of the stocks calculated for the entire portfolio on a weighted average basis. Net Equity Net equity level is the net equity exposure percentage adjusted for any derivative positions in stocks or index for hedging or rebalancing purpose. R Squared It is a statistical measure of how closely the portfolio returns are correlated with its benchmark. AUM AUM or assets under management refers to the recent / updated cumulative market value of investments managed by a mutual fund or any investment firm. Holdings The holdings or the portfolio is a mutual fund’s latest or updated reported statement of investments/securities. These are usually displayed in terms of percentage to net assets or the rupee value or both. The objective is to give investors an idea of where their money is being invested by the fund manager. Nature of Scheme The investment objective and underlying investments determine the nature of the mutual fund scheme. For instance, a mutual fund that aims at generating capital appreciation by investing in stock markets is an equity fund or growth fund. Likewise, a mutual fund that aims at capital preservation by investing in debt markets is a debt fund or income fund. Each of these categories may have sub-categories. Rating Profile Mutual funds invest in securities after evaluating their creditworthiness as disclosed by the ratings. A depiction of the mutual fund in various investments based on their ratings becomes the rating profile of the fund. Typically, this is a feature of debt funds. HOW TO READ FACTSHEET Sharpe Ratio Sharpe Ratio is a risk to reward ratio, it measures portfolio returns generated in excess to the investment in risk-free asset, for per unit of total risk taken. While, positive Sharpe ratio indicates, portfolio compensating investors with excess returns (over risk-free rate) for the commensurate risk taken; negative Sharpe ratio indicates, investors are better off investing in risk-free assets. Beta Beta (ß) of a portfolio is a number indicating the relation between portfolio returns with that of the market index i.e. it measure the volatility, or systematic risk, of a portfolio in comparison to the market as a whole. Modified Duration A formula that expresses the measurable change in the value of a security in response to a change in interest rates. Modified duration of portfolio can be used to anticipate the change in market value of portfolio for every change in portfolio yield. Standard Deviation A statistical measure that defines expected volatility/risk associated with a portfolio. This explains the variation/deviation from the average returns delivered by the portfolio. A higher standard deviation means higher volatility (risk) and a lower standard deviation means lower volatility. Risk Free Return The theoretical rate of return of an investment with safest (zero risk) investment in a country. Tracking Error Tracking error indicates how closely the portfolio return is tracking the benchmark Index return. It measures the deviation between portfolio return and benchmark index return. A lower tracking error indicates portfolio closely tracking benchmark index and higher tracking error indicates portfolio returns with higher deviation from benchmark index returns. Total Expense Ratio Total expenses charged to scheme for the month expressed as a percentage to average monthly net assets. Average Maturity Weighted average maturity of the securities in scheme. Portfolio Yield (Yield To Maturity) Weighted average yield of the securities in scheme portfolio. Portfolio Turnover Ratio Portfolio Turnover Ratio is the percentage of a fund’s holdings that have changed in a given year. This ratio measures the fund’s trading activity, which is computed by taking the lesser of purchases or sales and dividing by average monthly net assets. GLOSSARY
  • 3. Intouch mutually July 2017 3 Market Review Source for various data points: RBI Website, Bloomberg, Reuters and HDFC AMC Research. Equity Market update Indian equity markets continue to do well and made new highs in July. Nifty 50 closed above 10,000 and S&P BSE Sensex closed above 32,000 for first time. Performance of global equity markets was mixed with Hang Seng being the best performer. The table below gives the details of performance of key domestic and global indices. % Change in Indices CY 2016 1M CY2017 YTD S&P BSE India Bankex 7.3 8.0 36.8 S&P BSE India Capital Goods (3.3) 5.3 31.5 S&P BSE India FMCG 3.3 (3.2) 24.1 S&P BSE India Healthcare (12.9) 0.0 (3.6) S&P BSE India Metal 36.7 9.2 22.9 S&P BSE India Oil & Gas 27.2 7.5 16.8 S&P BSE India IT (8.0) 6.1 2.6 S&P BSE Sensex 1.9 5.2 22.1 NIFTY 50 3.0 5.8 23.1 NIFTY Free Float Midcap 100 7.1 4.4 29.0 % Change in Indices CY 2016 1M CY2017 YTD Dow Jones Industrial Average 13.4 2.5 10.8 NASDAQ 7.5 3.4 17.9 FTSE 14.4 0.8 3.2 DAX 6.9 (1.7) 5.5 CAC 4.9 (0.5) 4.8 Nikkei 0.4 (0.5) 4.2 Hang Seng 0.4 6.1 24.2 KOSPI 3.3 0.5 18.6 Shanghai (12.3) 2.5 5.5 MSCI Emerging Market Index 8.6 5.5 23.7 Key commodities performed well in July with Steel (HRC) up 13% and Brent crude up 7.5%. INR appreciated by 0.6% against USD in July and closed at 64.2, INR has appreciated by 5.5% in 2017 so far. FII’s bought Indian equities worth $0.8bn in July. Net inflows in domestic equity oriented mutual funds continue to be robust. In Q1FY18 were net inflows were ~Rs 46,900 crores vs ~Rs 93,500 in FY17. GST got implemented during the month without significant glitches. June CPI came in at a record low of 1.54%. Amongst the results declared so far FMCG and IT earnings were below expectations, Pharma results were mixed, while banks and Industrials delivered results upto or better than expectations. Monsoons have progressed well with cumulative rainfall for country as a whole is 5% above long period average upto July 26, 2017. One interesting development in recent years has been falling share of OPEC and rising share of US shale oil in global oil production. This is supportive of stable crude prices in medium term which is good for oil importing countries like India: OPEC vs US marketshare (%) in Oil production 4 5 6 7 8 9 10 11 31 32 33 34 35 36 37 06 07 08 09 10 11 12 13 14 15 16 17 OPEC - LHS US - RHS Data for the period: June 2006 to May 2017 Equity market have lagged nominal GDP growth for several years now. Profit growth is now improving and earnings growth for next 2-3 years is expected to be strong. NIFTY is currently trading at ~16xFY19E EPS which is reasonable in a low interest rate and strong earnings growth environment. However, bunching of new issuances inAugust / September could have a short term impact on markets. In our opinion therefore, there is merit in increasing allocation to equities (for those with a medium to long term view) and to stay invested. Debt Market update The yield on 10-year benchmark (6.79% GoI 2027) ended the month of July at 6.47% down by 4 bps over the previous month end. The yield on 10-year AAA Corporate Bond ended the month at 7.31% as against 7.42% at the end of June 2017. Thus, corporate bond spreads during the month narrowed to 74 bps as against 80 bps in the previous month. Liquidity conditions continued to remain positive during the month of July 2017.As against ~Rs. 309,030 crs of average liquidity absorbed by RBI during the month of June 2017 through various sources (LiquidityAdjustment Facility, export refinance, marginal standing facility and term repos/reverse repos), ~Rs.299,653 crs of liquidity was absorbed by RBI during the month of July 2017. During the month of July 2017, RBI conducted Open Market Operation (OMO) sale of G-secs totaling Rs.20,000 crs. The overnight rate ended at the same level of 6.25% as against previous month. INR closed at 64.19 versus the USD in July 2017 as against 64.58 in June 2017. The net FII investments in equities & debt were ~US$ 3.73 billion in July 2017, down from US$ 4.55 billion in June 2017. FII’s have purchased close to US$ 26.39 billion in Indian debt and equity markets between Jan’17 to July’17 as compared to ~US$ 4.13 bn during Jan’16 to July’16. The annual rate of retail inflation, CPI fell to 1.54% YOY in June 2017, lower than 2.2% in May 2017. The drop was largely on account of fall in food inflation, which decreased to -1.17% in June 2017 from -0.22% in May 2017. This was largely contributed by fall in prices of pulses which fell from -19.45% in May 2017 to -21.92% in June 2017. Core CPI (excl. food & fuel) also declined to 3.75% in June 2017 from 4.14% in May 2017. In the credit policy review of Aug’17, the Monetary Policy Committee (MPC) voted in favour of a 25 bp cut in repo rate to 6.0% from 6.25%. The major factors that provided space for a rate cut include: recent low headline CPI inflation, the moderation in core inflation over the last three months, smooth implementation of GST and normal monsoons. Conclusion & Outlook As highlighted by us recently (in Credit Policy Review: June ’17) the moderating path of inflation should create some space for easing, the MPC announced a 25 bp cut in repo rate. More importantly, even though headline inflation (excluding HRA impact) is expected to rise from current lows, it is projected at little over 4% for Q4 of FY18 by the RBI. Further, RBI commented that it is comfortable with a real rate of over 175bp. In summary, with benign inflation outlook, steady INR, ample liquidity and fairly stable international commodity prices, there is room for some more downside in yields in our view.
  • 4. 4 July 2017 Intouch mutually CONTENTS Page No. Wealth Creation Solutions Actively Managed Funds Hdfc Growth Fund............................................................................... 5 Hdfc Equity Fund................................................................................. 6 Hdfc Top 200 Fund.............................................................................. 7 Hdfc Capital Builder Fund.................................................................... 8 Hdfc Core & Satellite Fund................................................................... 9 Hdfc Premier Multi-Cap Fund............................................................... 10 Hdfc Large Cap Fund........................................................................... 11 Hdfc Mid-Cap Opportunities Fund....................................................... 12 Hdfc Small Cap Fund........................................................................... 13 Hdfc Infrastructure Fund...................................................................... 14 Hdfc Balanced Fund............................................................................. 15-16 Hdfc Prudence Fund............................................................................ 18-19 Hdfc Equity Savings Fund.................................................................... 16-17 Passively Managed Funds Hdfc Index Fund - Sensex Plan........................................................... 21 Hdfc Index Fund - Nifty Plan.............................................................. 22 Hdfc Index Fund - Sensex Plus Plan.................................................... 23 Hdfc Sensex Etf................................................................................. 24 Hdfc Nifty Etf.................................................................................... 25 Tax Savings Solutions Hdfc Long Term Advantage Fund......................................................... 26 Hdfc Taxsaver...................................................................................... 27 Goal Oriented Solutions Hdfc Children’s Gift Fund - Investment Plan......................................... 28 Hdfc Children’s Gift Fund - Savings Plan.............................................. 29 Hdfc Retirement Savings Fund - Equity Plan......................................... 30 Hdfc Retirement Savings Fund - Hybrid Equity Plan............................. 31 Hdfc Retirement Savings Fund - Hybrid Debt Plan................................ 32 Page No. Regular Income Solutions Hdfc MF Monthly Income Plan - Short Term Plan................................. 33 Hdfc MF Monthly Income Plan - Long Term Plan.................................. 34 Hdfc Multiple Yield Fund - Plan 2005.................................................. 35 Savings Solutions Hdfc Arbitrage Fund............................................................................ 19-20 Hdfc Income Fund............................................................................... 36 Hdfc High Interest Fund - Dynamic Plan............................................... 37 Hdfc High Interest Fund - Short Term Plan........................................... 38 Hdfc Regular Savings Fund.................................................................. 39 Hdfc Short Term Opportunities Fund.................................................... 40 Hdfc Medium Term Opportunities Fund............................................... 41 Hdfc Gilt Fund - Short Term Plan.......................................................... 42 Hdfc Gilt Fund - Long Term Plan.......................................................... 43 Hdfc Floating Rate Income Fund - Short Term Plan............................... 44 Hdfc Floating Rate Income Fund - Long Term Plan............................... 45 Hdfc Liquid Fund................................................................................. 46 Hdfc Cash Management Fund - Savings Plan....................................... 47 Hdfc Cash Management Fund - Treasury Advantage Plan.................... 48 Hdfc Corporate Debt Opportunities Fund............................................. 49 Hdfc Banking and Psu Debt Fund........................................................ 50 Performance details of schemes managed by respective fund managers .................................... 51 Scheme performance summary - Regular Plans ........................ 52-58 Scheme performance summary - Direct Plans ........................... 59-69 Performance of Category I - FPI Portfolio .................................. 69 Dividend History ...................................................................... 70-72 Disclaimer ................................................................................ 72 Our range of offerings Wealth Creation Solutions These schemes aim to increase your wealth over the long term by investing predominantly in equity instruments and it is suitable for investors with high risk appetite and relatively higher investment horizon. Tax Savings Solutions These schemes are eligible to provide tax deduction under Sec 80C and also aim to increase your wealth over the long term. This is an ideal solution for investors who would like to create wealth and save tax. Goal Oriented Solutions These schemes aim to help you achieve your specific financial goals. It is ideal for investors planning for their retirement, future expenses like higher education of children, etc. Investors can choose from aggressive to conservative options based on their risk profile and time horizon. Regular Income Solutions These schemes aim to provide you with regular income. It is ideal for investors with medium risk appetite who wish to receive regular cash flows to meet specific needs like post retirement expenses, EMI, etc. at a fixed time horizon, e.g. monthly, quarterly, etc. These schemes have relatively lower equity exposure. Savings Solutions These schemes aim to preserve your capital and provide you with ready liquidity by investing in debt and money market instruments. It is suitable for investors with low to medium risk appetite across time horizons (Short, Medium and Long term) Disclaimer: Investors are requested to note that the above investment solution(s) should not be construed as financial planning solution/recommendation by the Fund/ AMC. It does not in any manner, indicate or imply either the quality of any particular Scheme or guarantee any specific performance/returns. Such solutions must be tailored to investor’s individual situation and objectives and therefore, investors should consult their financial advisors to ascertain whether the product is suitable for them.
  • 5. Intouch mutually July 2017 5 investment objective To generate long term capital appreciation from a portfolio that is invested predominantly in equity and equity related instruments. Fund Manager ¥ Srinivas Rao Ravuri (since April 3, 06) Total Experience: Over 22 years Inception Date (Date of Allotment) September 11, 2000 NAV (as on July 31, 2017) NAV per Unit (`) Regular Plan - Growth Option 175.778 Regular Plan - Dividend Option 32.613 Direct Plan - Growth Option 180.122 Direct Plan - Dividend Option 33.622 aSSETS UNDER MANAGEMENT (`) IN CRORE As on July 31, 2017 1,146.91 Average for Month of July, 2017 1,123.28 quantitative data Portfolio Turnover Ratio (Last 1 year) 35.98% Risk Ratio n Standard Deviation 4.277% n Beta 1.037 n Sharpe Ratio* 0.147 Computed for the 3-yr period ended July 31, 2017. Based on month-end NAV. * Risk free rate: 6.25% (Source: FIMMDA MIBOR) Total Expense Ratio (Weighted Average for the month) Excluding Goods and Service Tax on Management Fees Regular 2.30% Direct 1.65% l #BENCHMARK INDEX: S&P BSE SENSEX l ##addl. BENCHMARK INDEX: NIFTY 50 Index Exit Load l In respect of each purchase / switch-in of Units, an Exit Load of 1.00% is payable if Units are redeemed / switched- out within 1 year from the date of allotment. l No Exit Load is payable if Units are redeemed / switched- out after 1 year from the date of allotment. For further details, please refer to para ‘Exit Load’ on Pg 51. l PlanS & Options Regular Plan, Direct Plan. Under Each Plan : Growth & Dividend. The Dividend Option offers Dividend Payout and Reinvestment facility. Minimum Application Amount Purchase : ` 5,000 and any amount thereafter. Additional Purchase : ` 1,000 and any amount thereafter. Redemption Proceeds Normally despatched within 3-4 Business Days. ¥ Dedicated Fund Manager for Overseas Investments: Mr Rakesh Vyas (Total Experience: Over 10 years). HDFC Growth Fund (An open-ended growth scheme) Face Value per Unit: ` 10 unless otherwise specified, + Industry Classification as recommended by AMFI, Data is as of July 31, 2017 unless otherwise specified. SIP Performance^ - Regular Plan - Growth Option Since Inception SIP 15 year SIP 10 year SIP 5 year SIP 3 year SIP 1 year SIP Total Amount Invested (` ‘000) 2,030.00 1,800.00 1,200.00 600.00 360.00 120.00 Mkt Value as on July 31, 2017 (` ‘000) 13,347.35 8,317.08 2,506.18 926.60 463.47 138.50 Returns (Annualised) (%) 19.65 18.42 14.10 17.43 17.13 29.93 Benchmark Returns (Annualised) (%) # 14.01 13.51 10.47 12.30 11.43 25.85 Addl. Benchmark Ret. (Annualised) (%) ## 13.94 13.57 11.01 13.26 12.60 26.58 Assuming ` 10,000 invested systematically on the first Business Day of every month over a period of time. CAGR returns are computed after accounting for the cash flow by using XIRR method (investment internal rate of return) for Regular Plan - Growth Option. The above investmentsimulationisforillustrativepurposesonlyandshouldnotbeconstruedasapromiseonminimumreturnsandsafeguardofcapital. Performance^ - Regular Plan - Growth Option Date Period Scheme Returns (%) Benchmark Returns (%)# Additional Benchmark Returns (%) ## Value of ` 10,000 invested Scheme (`) Benchmark (`)# Additional Benchmark (`)## Jul 29, 16 Last 1 Year 22.27 15.82 16.56 12,240 11,591 11,665 Jul 31, 14 Last 3 Years 13.51 7.88 9.27 14,630 12,556 13,051 Jul 31, 12 Last 5 Years 16.22 13.53 14.01 21,215 18,864 19,272 Sep 11, 00 Since Inception 18.49 12.13 12.13 175,778 69,231 69,194 Returns greater than 1 year period are compounded annualized (CAGR). For performance of other schemes managed by Srinivas Rao Ravuri, please refer page 51. Different plans viz. Regular Plan and Direct Plan have a different expense structure. The expenses of the Direct Plan under the Scheme will be lower to the extent of the distribution expenses / commission charged in the Regular Plan. For Performance of Direct Plan, refer page no. 59. This product is suitable for investors who are seeking ~ l Capital appreciation over long term. l Investment predominantly in equity and equity related instruments. Riskometer Investors understand that their principal will be at moderately high risk ~ Investors should consult their financial advisers if in doubt about whether the product is suitable for them. Portfolio Company Industry+ % to NAV Equity & Equity Related • HDFC Bank Ltd. Banks 9.97 • State Bank of India Banks 8.37 • ICICI Bank Ltd. Banks 6.68 • ITC Ltd. Consumer Non Durables 6.22 • Larsen & Toubro Ltd. Construction Project 5.45 • Infosys Ltd. Software 5.24 • Reliance Industries Ltd. Petroleum Products 4.36 • Housing Development Finance Corporation Ltd.£ Finance 3.83 • Maruti Suzuki India Ltd. Auto 3.38 • Vedanta Ltd. Non - Ferrous Metals 3.25 Oil&NaturalGasCorporationLtd. Oil 2.66 Power Grid Corporation of India Ltd. Power 2.63 Adani Ports and Special Economic Zone Ltd. Transportation 2.44 GAIL (India) Ltd. Gas 2.38 Axis Bank Ltd. Banks 2.22 Tata Motors Ltd. DVR Auto 2.06 Dilip Buildcon Ltd. Construction 1.92 Coal India Ltd. Minerals/Mining 1.77 Cipla Ltd. Pharmaceuticals 1.74 Solar Industries India Ltd. Chemicals 1.72 DLF Ltd. Construction 1.60 Kalpataru Power Transmission Ltd. Power 1.48 NTPC Ltd. Power 1.47 Eimco Elecon (India) Ltd. Industrial Capital Goods 1.46 Aurobindo Pharma Ltd. Pharmaceuticals 1.41 Tata Steel Ltd. Ferrous Metals 1.24 Tata Communications Ltd. Telecom - Services 1.22 Hindalco Industries Ltd. Non - Ferrous Metals 1.22 KCP Ltd. Cement 1.22 Bank of Baroda Banks 1.17 Tata Consultancy Services Ltd. Software 1.00 JMC Projects (India) Ltd. Construction 0.99 HPL Electric and Power Ltd. Consumer Durables 0.84 Company Industry+ % to NAV Mahindra & Mahindra Ltd. Auto 0.76 Sun Pharmaceuticals Industries Ltd. Pharmaceuticals 0.57 Jaiprakash Power Ventures Ltd. Power 0.50 C & C Constructions Ltd. Construction 0.48 Pennar Engineered Bldg Systems Ltd Ferrous Metals 0.29 KSK Energy Ventures Ltd. Power 0.12 Sub Total 97.33 Preference Shares Vedanta Ltd. Non - Ferrous Metals 0.34 Sub Total 0.34 Total 97.67 Cash, Cash Equivalents and Net Current Assets 2.33 Grand Total 100.00 • Top Ten Holdings, £ Co-sponsor 0.84 1.22 1.22 1.46 1.53 1.72 1.77 2.38 2.44 2.66 3.72 3.83 4.36 4.81 4.99 5.45 6.20 6.20 6.22 6.24 28.41 0 5 10 15 20 25 30 Consumer Durables Cement Telecom - Services Industrial Capital Goods Ferrous Metals Chemicals Minerals/Mining Gas Transportation Oil Pharmaceuticals Finance Petroleum Products Non - Ferrous Metals Construction Construction Project Power Auto Consumer Non Durables Software Banks Industry Allocation of Equity Holding (% of Net Assets) ^Past performance may or may not be sustained in the future. Load is not taken into consideration for computation of performance.
  • 6. 6 July 2017 Intouch mutually l investment objective To achieve capital appreciation. l Fund Manager § ¥ Prashant Jain (since June 19, 03) Total Experience: Over 26 years l Inception Date (Date of Allotment) January 1, 1995 NAV (as on July 31, 2017) NAV per Unit (`) Regular Plan - Growth Option 608.029 Regular Plan - Dividend Option 57.088 Direct Plan - Growth Option 629.819 Direct Plan - Dividend Option 59.664 aSSETS UNDER MANAGEMENT (`) IN CRORE As on July 31, 2017 20,350.41 Average for Month of July, 2017 19,879.43 l quantitative data Portfolio Turnover Ratio (Last 1 year) 24.10% Risk Ratio n Standard Deviation 4.784% n Beta 1.142 n Sharpe Ratio* 0.133 Computed for the 3-yr period ended July 31, 2017. Based on month-endNAV.*Riskfreerate:6.25%(Source:FIMMDAMIBOR) Total Expense Ratio (Weighted Average for the month) Excluding Goods and Service Tax on Management Fees Regular: 2.05% Direct: 1.15% l #BENCHMARK INDEX: NIFTY 500 Index l ##addl. BENCHMARK INDEX: NIFTY 50 Index l Exit Load l In respect of each purchase / switch-in of Units, an Exit Load of 1.00% is payable if Units are redeemed / switched-out within 1 year from the date of allotment. l No Exit Load is payable if Units are redeemed / switched-out after 1 year from the date of allotment. For further details, please refer to para ‘Exit Load’ on Pg 51. l PlanS & Options Regular Plan, Direct Plan. Under Each Plan : Growth & Dividend. The Dividend Option offers Dividend Payout and Reinvestment facility. l Minimum Application Amount Purchase : ` 5,000 and any amount thereafter. Additional Purchase : ` 1,000 and any amount thereafter. l Redemption Proceeds Normally despatched within 3-4 Business Days. § DateofmigrationfromZurichIndiaMutualFund(Closeofbusiness hours - June 19, 03. ¥ Dedicated Fund Manager for Overseas Investments: Mr Rakesh Vyas (Total Experience: Over 10 years). HDFC Equity Fund (An open-ended growth scheme) SIP Performance^ - Regular Plan - Growth Option Since Inception SIP 15 year SIP 10 year SIP 5 year SIP 3 year SIP 1 year SIP Total Amount Invested (` ‘000) 2,710.00 1,800.00 1,200.00 600.00 360.00 120.00 Mkt Value as on July 31, 2017 (` ‘000) 65,996.29 10,070.26 2,836.11 970.37 465.03 140.23 Returns (Annualised) (%) 23.40 20.59 16.40 19.32 17.37 32.85 Benchmark Returns (Annualised) (%) # 13.90 14.57 12.48 16.26 15.41 28.75 Addl. Benchmark Ret. (Annualised) (%) ## 12.66 13.57 11.01 13.26 12.60 26.58 Assuming ` 10,000 invested systematically on the first Business Day of every month over a period of time. CAGR returns are computed after accounting for the cash flow by using XIRR method (investment internal rate of return) for Regular Plan - Growth Option. The above investment simulation is for illustrative purposes only and should not be construed as a promise on minimum returns and safeguard of capital. Face Value per Unit: ` 10 unless otherwise specified, + Industry Classification as recommended by AMFI, Data is as of July 31, 2017 unless otherwise specified. Performance^ - Regular Plan - Growth Option Date Period Scheme Returns (%) Benchmark Returns (%)# Additional Benchmark Returns (%) ## Value of ` 10,000 invested Scheme (`) Benchmark (`)# Additional Benchmark (`)## Jul 29, 16 Last 1 Year 25.23 19.84 16.56 12,538 11,996 11,665 Jul 31, 14 Last 3 Years 13.32 12.38 9.27 14,557 14,195 13,051 Jul 31, 12 Last 5 Years 18.96 16.33 14.01 23,832 21,310 19,272 Jan 01, 95 Since Inception 19.94 10.10 N.A. 608,029 87,933 N.A. Returns greater than 1 year period are compounded annualized (CAGR). N.A. Not Available. For performance of other schemes managed by Prashant Jain, please refer page 51. Different plans viz. Regular Plan and Direct Plan have a different expense structure. The expenses of the Direct Plan under the Scheme will be lower to the extent of the distribution expenses / commission charged in the Regular Plan. For Performance of Direct Plan, refer page no. 59. This product is suitable for investors who are seeking ~ l Capital appreciation over long term. l Investment predominantly in equity and equity related instruments of medium to large sized companies. Riskometer Investors understand that their principal will be at moderately high risk ~ Investors should consult their financial advisers if in doubt about whether the product is suitable for them. Portfolio Company Industry+ % to NAV Equity & Equity Related • ICICI Bank Ltd. Banks 9.56 • State Bank of India Banks 9.40 • Larsen & Toubro Ltd. Construction Project 7.78 • Infosys Ltd. Software 6.41 • HDFC Bank Ltd. Banks 5.31 • Maruti Suzuki India Ltd. Auto 4.50 • Reliance Industries Ltd. Petroleum Products 4.00 • Tata Steel Ltd. Ferrous Metals 3.09 • Balkrishna Industries Ltd. Auto Ancillaries 3.07 • CESC Ltd. Power 2.80 Power Grid Corporation of India Ltd. Power 2.66 Bank of Baroda Banks 2.39 Aurobindo Pharma Ltd. Pharmaceuticals 2.21 Housing Development Finance Corporation Ltd.£ Finance 1.87 Siemens Ltd. Industrial Capital Goods 1.81 UPL Ltd. Pesticides 1.75 Adani Ports and Special Economic Zone Ltd. Transportation 1.73 Canara Bank Banks 1.71 Tata Motors Ltd. Auto 1.67 Avenue Supermarts Ltd. Retailing 1.56 BEML Ltd. Industrial Capital Goods 1.55 Info Edge (India) Ltd. Software 1.43 Crompton Greaves Ltd. Industrial Capital Goods 1.42 Tata Consultancy Services Ltd. Software 1.34 Vedanta Ltd. Non - Ferrous Metals 1.32 Prism Cement Ltd. Cement 1.31 Kalpataru Power Transmission Ltd. Power 1.19 Punjab National Bank Banks 1.18 Rural Electrification Corporation Ltd. Finance 1.08 GAIL (India) Ltd. Gas 1.01 Tata Motors Ltd. DVR Auto 0.98 Simplex Infrastructures Ltd. Construction 0.76 Dish TV India Ltd. Media & Entertainment 0.76 Time Technoplast Ltd. Industrial Products 0.75 Century Textiles & Industries Ltd. Cement 0.71 Container Corporation of India Ltd. Transportation 0.64 Tata Chemicals Ltd. Chemicals 0.61 Praj Industries Limited Industrial Capital Goods 0.60 Oriental Bank of Commerce Banks 0.60 Cipla Ltd. Pharmaceuticals 0.60 Hindustan Construction Company Ltd. Construction Project 0.51 NTPC Ltd. Power 0.51 Siti Network Ltd. Media & Entertainment 0.41 Company Industry+ % to NAV Oracle Financial Services Software Ltd. Software 0.40 Sadbhav Infrastructure Project Ltd Construction Project 0.33 Ramco Systems Ltd. Software 0.29 Crompton Greaves Consumer Elec. Ltd Consumer Durables 0.28 Jaiprakash Power Ventures Ltd. Power 0.20 Gammon Infrastructure Projects Ltd. Construction Project 0.12 KSK Energy Ventures Ltd. Power 0.09 Sub Total 98.26 Preference Shares Vedanta Ltd. Non - Ferrous Metals 0.11 Zee Entertainment Enterprises Ltd. Media & Entertainment 0.02 Sub Total 0.13 Total 98.39 Cash, Cash Equivalents and Net Current Assets 1.61 Grand Total 100.00 • Top Ten Holdings, £ Co-sponsor 0.28 0.61 0.75 0.76 1.01 1.19 1.43 1.56 1.75 2.02 2.37 2.81 2.95 3.07 3.09 4.00 5.38 7.15 7.45 8.74 9.87 30.15 0 5 10 15 20 25 30 35 Consumer Durables Chemicals Industrial Products Construction Gas Media And Entertainment Non - Ferrous Metals Retailing Pesticides Cement Transportation Pharmaceuticals Finance Auto Ancillaries Ferrous Metals Petroleum Products Industrial Capital Goods Auto Power Construction Project Software Banks Industry Allocation of Equity Holding (% of Net Assets) ^Past performance may or may not be sustained in the future. Load is not taken into consideration for computation of performance.
  • 7. Intouch mutually July 2017 7 HDFC Top 200 Fund (An open-ended growth scheme) Face Value per Unit: ` 10 unless otherwise specified, + Industry Classification as recommended by AMFI, Data is as of July 31, 2017 unless otherwise specified. l investment objective To generate long term capital appreciation from a portfolio of equity and equity linked instruments. The investment portfolio for equity and equity linked instruments will be primarily drawn from the companies in the BSE 200 Index. Further, the Scheme may also invest in listed companies that would qualify to be in the top 200 by market capitalisation on the BSE even though they may not be listed on the BSE. This includes participation in large IPOs where in the market capitalisation of the company based on issue price would make the company a part of the top 200 companies listed on the BSE based on market capitalisation. l Fund Manager § ¥ Prashant Jain (since June 19, 03) Total Experience: Over 26 years l Inception Date (Date of Allotment) October 11, 1996 NAV (as on July 31, 2017) NAV per Unit (`) Regular Plan - Growth Option 443.760 Regular Plan - Dividend Option 55.218 Direct Plan - Growth Option 456.895 Direct Plan - Dividend Option 57.243 aSSETS UNDER MANAGEMENT (`) IN CRORE As on July 31, 2017 15,360.67 Average for Month of July, 2017 14,942.87 l quantitative data Portfolio Turnover Ratio (Last 1 year) 30.60% Risk Ratio n Standard Deviation 4.570% n Beta 1.116 n Sharpe Ratio* 0.131 Computed for the 3-yr period ended July 31, 2017. Based on month-endNAV.*Riskfreerate:6.25%(Source:FIMMDAMIBOR) Total Expense Ratio (Weighted Average for the month) Excluding Goods and Service Tax on Management Fees Regular: 2.10% Direct: 1.35% l #BENCHMARK INDEX: S&P BSE 200 l ##addl. BENCHMARK INDEX: S&P BSE SENSEX l Exit Load l In respect of each purchase / switch-in of Units, an Exit Load of 1.00% is payable if Units are redeemed / switched- out within 1 year from the date of allotment. l No Exit Load is payable if Units are redeemed / switched- out after 1 year from the date of allotment. For further details, please refer to para ‘Exit Load’ on Pg 51. l PlanS & Options Regular Plan, Direct Plan. Under Each Plan : Growth & Dividend. The Dividend Option offers Dividend Payout and Reinvestment facility. l Minimum Application Amount Purchase : ` 5,000 and any amount thereafter. Additional Purchase : ` 1,000 and any amount thereafter. l Redemption Proceeds Normally despatched within 3-4 Business Days. § Date of migration from Zurich India Mutual Fund (Close of business hours - June 19, 03 ¥ Dedicated Fund Manager for Overseas Investments: Mr Rakesh Vyas (Total Experience: Over 10 years). This product is suitable for investors who are seeking ~ l Capital appreciation over long term. l Investment in equity and equity linked instruments including equity derivatives primarily drawn from the companies in the S&P BSE 200 Index. Riskometer Investors understand that their principal will be at moderately high risk ~ Investors should consult their financial advisers if in doubt about whether the product is suitable for them. SIP Performance^ - Regular Plan - Growth Option Since Inception SIP 15 year SIP 10 year SIP 5 year SIP 3 year SIP 1 year SIP Total Amount Invested (` ‘000) 2,500.00 1,800.00 1,200.00 600.00 360.00 120.00 Mkt Value as on July 31, 2017 (` ‘000) $$ 34,447.46 9,579.15 2,655.81 938.15 462.35 139.23 Returns (Annualised) (%) $$ 21.31 20.02 15.18 17.93 16.96 31.15 Benchmark Returns (Annualised) (%) # 14.41 14.44 12.11 15.39 14.59 27.56 Addl. Benchmark Ret. (Annualised) (%) ## 13.00 13.51 10.47 12.30 11.43 25.85 Assuming ` 10,000 invested systematically on the first Business Day of every month over a period of time. CAGR returns are computed after accounting for the cash flow by using XIRR method (investment internal rate of return) for Regular Plan - Growth Option. The above investment simulation is for illustrative purposes only and should not be construed as a promise on minimum returns and safeguard of capital. Performance^ - Regular Plan - Growth Option Date Period Scheme Returns (%) $$ Benchmark Returns (%)# Additional Benchmark Returns (%) ## Value of ` 10,000 invested Scheme (`) $$ Benchmark (`)# Additional Benchmark (`)## Jul 29, 16 Last 1 Year 23.63 18.56 15.82 12,377 11,867 11,591 Jul 31, 14 Last 3 Years 12.91 11.68 7.88 14,398 13,933 12,556 Jul 31, 12 Last 5 Years 17.63 15.68 13.53 22,535 20,722 18,864 Oct 11, 96 Since Inception 21.13 13.51 11.85 541,080 139,739 102,878 Returns greater than 1 year period are compounded annualized (CAGR). $$ All dividends declared prior to the splitting of the Scheme into Dividend & Growth Options are assumed to be reinvested in the units of the Scheme at the then prevailing NAV (ex-dividend NAV). For performance of other schemes managed by Prashant Jain, please refer page 51. Different plans viz. Regular Plan and Direct Plan have a different expense structure. The expenses of the Direct Plan under the Scheme will be lower to the extent of the distribution expenses / commission charged in the Regular Plan. For Performance of Direct Plan, refer page no. 59. Portfolio Company Industry+ % to NAV Equity & Equity Related • HDFC Bank Ltd. Banks 8.27 • ICICI Bank Ltd. Banks 6.48 • State Bank of India Banks 6.19 • Larsen & Toubro Ltd. Construction Project 6.16 • Infosys Ltd. Software 5.08 • Reliance Industries Ltd. Petroleum Products 4.81 • Housing Development Finance Corporation Ltd.£ Finance 3.59 • ITC Ltd. Consumer Non Durables 3.16 • Maruti Suzuki India Ltd. Auto 2.89 • Tata Consultancy Services Ltd. Software 2.42 Tata Steel Ltd. Ferrous Metals 2.22 Power Grid Corporation of India Ltd. Power 2.22 Tata Motors Ltd. Auto 2.05 Aurobindo Pharma Ltd. Pharmaceuticals 1.88 Axis Bank Ltd. Banks 1.84 Adani Ports and Special Economic Zone Ltd. Transportation 1.75 CESC Ltd. Power 1.73 Canara Bank Banks 1.57 Bank of Baroda Banks 1.54 ABB India Ltd. Industrial Capital Goods 1.44 Kotak Mahindra Bank Ltd. Banks 1.42 Indusind Bank Ltd. Banks 1.42 SunPharmaceuticalsIndustriesLtd. Pharmaceuticals 1.36 NTPC Ltd. Power 1.35 UPL Ltd. Pesticides 1.34 Bank of India Banks 1.27 Vedanta Ltd. Non - Ferrous Metals 1.26 Siemens Ltd. Industrial Capital Goods 1.22 GAIL (India) Ltd. Gas 1.16 Avenue Supermarts Ltd. RETAILING 1.15 Yes Bank Ltd. Banks 1.13 Punjab National Bank Banks 0.99 Union Bank of India Banks 0.99 Cipla Ltd. Pharmaceuticals 0.93 Century Textiles & Industries Ltd. Cement 0.93 Mahindra & Mahindra Ltd. Auto 0.91 Power Finance Corporation Ltd. Finance 0.91 HCL Technologies Ltd. Software 0.89 Oil&NaturalGasCorporationLtd. Oil 0.85 Rural Electrification Corporation Ltd. Finance 0.80 Ambuja Cements Ltd. Cement 0.76 Oracle Financial Services Software Ltd. Software 0.68 Wipro Ltd. Software 0.65 Zee Entertainment Enterprises Ltd. Media & Entertainment 0.59 Tata Motors Ltd. DVR Auto 0.58 Bharti Airtel Ltd. Telecom - Services 0.58 Tech Mahindra Ltd. Software 0.57 Hindalco Industries Ltd. Non - Ferrous Metals 0.54 Dish TV India Ltd. Media & Entertainment 0.52 Company Industry+ % to NAV Steel Authority of India Ltd. Ferrous Metals 0.45 Divi's Laboratories Ltd. Pharmaceuticals 0.44 Tata Chemicals Ltd. Chemicals 0.43 Hindustan Petroleum Corporation Ltd. Petroleum Products 0.42 Info Edge (India) Ltd. Software 0.41 Tata Communications Ltd. Telecom - Services 0.41 Bharat Petroleum Corporation Ltd. Petroleum Products 0.37 Federal Bank Ltd. Banks 0.31 Bharat Electronics Ltd. Industrial Capital Goods 0.24 Container Corporation of India Ltd. Transportation 0.15 NHPC Ltd. Power 0.11 Sub Total 98.78 Preference Shares Vedanta Ltd. Non - Ferrous Metals 0.15 Zee Entertainment Enterprises Ltd. Media & Entertainment 0.02 Sub Total 0.17 Total 98.95 Cash, Cash Equivalents and Net Current Assets 1.05 Grand Total 100.00 • Top Ten Holdings, £ Co-sponsor 0.43 0.85 0.99 1.13 1.15 1.16 1.34 1.69 1.90 1.95 2.67 2.90 3.16 4.61 5.30 5.41 5.60 6.16 6.43 10.70 33.42 0 5 10 15 20 25 30 35 40 Chemicals Oil Telecom - Services Media And Entertainment Retailing Gas Pesticides Cement Transportation Non - Ferrous Metals Ferrous Metals Industrial Capital Goods Consumer Non Durables Pharmaceuticals Finance Power Petroleum Products Construction Project Auto Software Banks Industry Allocation of Equity Holding (% of Net Assets) ^Past performance may or may not be sustained in the future. Load is not taken into consideration for computation of performance.
  • 8. 8 July 2017 Intouch mutually This is a simple and performing scheme which is eligible for distribution by new cadre of distributors. l investment objective To achieve capital appreciation in the long term. l Fund Manager ¥ Miten Lathia (since Mar 20, 17) Total Experience: Over 17 years (The scheme was co-managed by Chirag Setalvad & Miten Lathia till March 19, 17) l Inception Date (Date of Allotment) February 1, 1994 NAV (as on July 31, 2017) NAV per Unit (`) Regular Plan - Growth Option 267.088 Regular Plan - Dividend Option 29.126 Direct Plan - Growth Option 276.231 Direct Plan - Dividend Option 30.425 aSSETS UNDER MANAGEMENT (`) IN CRORE As on July 31, 2017 1,722.94 Average for Month of July, 2017 1,668.02 l quantitative data Portfolio Turnover Ratio (Last 1 year) 40.13% Risk Ratio n Standard Deviation 4.501% n Beta 1.045 n Sharpe Ratio* 0.192 Computed for the 3-yr period ended July 31, 2017. Based on month-endNAV.*Riskfreerate:6.25%(Source:FIMMDAMIBOR) Total Expense Ratio (Weighted Average for the month) Excluding Goods and Service Tax on Management Fees Regular: 2.40% Direct: 1.33% l #BENCHMARK INDEX: NIFTY 500 Index l ##addl. BENCHMARK INDEX: NIFTY 50 Index l Exit Load l In respect of each purchase / switch-in of Units, an Exit Load of 1.00% is payable if Units are redeemed / switched- out within 1 year from the date of allotment. l No Exit Load is payable if Units are redeemed / switched- out after 1 year from the date of allotment. For further details, please refer to para ‘Exit Load’ on Pg 51. l PlanS & Options Regular Plan, Direct Plan. Under Each Plan : Growth & Dividend. The Dividend Option offers Dividend Payout and Reinvestment facility. l Minimum Application Amount Purchase : ` 5,000 and any amount thereafter. Additional Purchase : ` 1,000 and any amount thereafter. l Redemption Proceeds Normally despatched within 3-4 Business Days. ¥ Dedicated Fund Manager for Overseas Investments: Mr Rakesh Vyas (Total Experience: Over 10 years). HDFC Capital Builder Fund (An open-ended growth scheme) SIP Performance^ - Regular Plan - Growth Option Since Inception SIP 15 year SIP 10 year SIP 5 year SIP 3 year SIP 1 year SIP Total Amount Invested (` ‘000) 2,820.00 1,800.00 1,200.00 600.00 360.00 120.00 Mkt Value as on July 31, 2017 (` ‘000) 39,660.00 9,641.55 2,941.97 997.81 466.00 137.96 Returns (Annualised) (%) 18.82 20.10 17.08 20.47 17.51 29.02 Benchmark Returns (Annualised) (%) # 13.42 14.57 12.48 16.26 15.41 28.75 Addl. Benchmark Ret. (Annualised) (%) ## 12.29 13.57 11.01 13.26 12.60 26.58 Assuming ` 10,000 invested systematically on the first Business Day of every month over a period of time. CAGR returns are computed after accounting for the cash flow by using XIRR method (investment internal rate of return). The above investment simulation is for illustrative purposes only and should not be construed as a promise on minimum returns and safeguard of capital. Performance^ - Regular Plan - Growth Option Date Period Scheme Returns (%) Benchmark Returns (%)# Additional Benchmark Returns (%) ## Value of ` 10,000 invested Scheme (`) Benchmark (`)# Additional Benchmark (`)## Jul 29, 16 Last 1 Year 22.74 19.84 16.56 12,288 11,996 11,665 Jul 31, 14 Last 3 Years 16.57 12.38 9.27 15,846 14,195 13,051 Jul 31, 12 Last 5 Years 20.63 16.33 14.01 25,555 21,310 19,272 Feb 01, 94 Since Inception 15.00 9.40 9.36 267,088 82,736 81,932 Returns greater than 1 year period are compounded annualized (CAGR). For performance of other schemes managed by Miten Lathia, please refer page 51. Different plans viz. Regular Plan and Direct Plan have a different expense structure. The expenses of the Direct Plan under the Scheme will be lower to the extent of the distribution expenses / commission charged in the Regular Plan. For Performance of Direct Plan, refer page no. 68. Face Value per Unit: ` 10 unless otherwise specified, + Industry Classification as recommended by AMFI, Data is as of July 31, 2017 unless otherwise specified. This product is suitable for investors who are seeking ~ l Capital appreciation over long term. l Investment predominantly in equity and equity related instruments of strong companies. Riskometer Investors understand that their principal will be at moderately high risk ~ Investors should consult their financial advisers if in doubt about whether the product is suitable for them. Portfolio Company Industry+ % to NAV Equity & Equity Related • HDFC Bank Ltd. Banks 8.14 • Axis Bank Ltd. Banks 4.21 • ICICI Bank Ltd. Banks 3.86 • Reliance Industries Ltd. Petroleum Products 3.75 • State Bank of India Banks 3.63 • Vedanta Ltd. Non - Ferrous Metals 3.24 • GAIL (India) Ltd. Gas 3.17 • Cipla Ltd. Pharmaceuticals 3.15 • Larsen & Toubro Ltd. Construction Project 3.12 • Infosys Ltd. Software 2.93 Tata Motors Ltd. Auto 2.32 Kotak Mahindra Bank Ltd. Banks 2.29 VIP Industries Ltd. Consumer Durables 2.11 Yes Bank Ltd. Banks 2.10 Aurobindo Pharma Ltd. Pharmaceuticals 2.06 Indusind Bank Ltd. Banks 2.05 Dilip Buildcon Ltd. Construction 2.00 Dabur India Ltd. Consumer Non Durables 1.99 Tata Steel Ltd. Ferrous Metals 1.97 Oracle Financial Services Software Ltd. Software 1.92 Solar Industries India Ltd. Chemicals 1.83 Adani Ports and Special Economic Zone Ltd. Transportation 1.82 NHPC Ltd. Power 1.75 Wipro Ltd. Software 1.68 TV18 Broadcast Limited Media & Entertainment 1.63 Bank of Baroda Banks 1.45 J.Kumar Infraprojects Ltd. Construction 1.33 Voltas Ltd. Construction Project 1.30 Housing Development Finance Corporation Ltd.£ Finance 1.30 Mahindra & Mahindra Ltd. Auto 1.22 Blue Star Ltd. Consumer Durables 1.18 Bajaj Corp Ltd. Consumer Non Durables 1.08 Dish TV India Ltd. Media & Entertainment 1.06 Sundram Fasteners Ltd. Auto Ancillaries 1.03 Trent Ltd. Retailing 1.02 PNC Infratech Ltd. Construction 1.01 Wonderla Holidays Ltd. Hotels, Resorts & Other Recreational Activities 1.00 IPCA Laboratories Ltd. Pharmaceuticals 0.97 Delta Corp Ltd. Hotels, Resorts & Other Recreational Activities 0.96 SadbhavInfrastructureProjectLtd Construction Project 0.91 Info Edge (India) Ltd. Software 0.85 Bharat Petroleum Corporation Ltd. Petroleum Products 0.83 Fag Bearings India Ltd. Industrial Products 0.80 Ashoka Buildcon Ltd. Construction Project 0.76 Ambuja Cements Ltd. Cement 0.76 Wockhardt Ltd. Pharmaceuticals 0.72 Titagarh Wagons Ltd. Industrial Capital Goods 0.71 Company Industry+ % to NAV Network 18 Media & Investments Ltd Media & Entertainment 0.66 Crompton Greaves Consumer Elec. Ltd Consumer Durables 0.57 Bharti Infratel Ltd. Telecom - Equipment & Accessories 0.48 Federal Bank Ltd. Banks 0.47 Gujarat Pipavav Port Ltd. Transportation 0.43 OnMobile Global Limited Telecom - Services 0.26 Indoco Remedies Ltd. Pharmaceuticals 0.11 KSK Energy Ventures Ltd. Power 0.05 Tata Communications Ltd. Telecom - Services 0.05 Sub Total 94.05 Preference Shares Vedanta Ltd. Non - Ferrous Metals 0.21 Sub Total 0.21 Total 94.26 Cash, Cash Equivalents and Net Current Assets 5.74 Grand Total 100.00 • Top Ten Holdings, £ Co-sponsor 0.31 0.48 0.71 0.76 0.80 1.02 1.03 1.30 1.80 1.83 1.96 1.97 2.25 3.07 3.17 3.35 3.45 3.54 3.86 4.34 4.58 6.09 7.01 7.38 28.20 0 5 10 15 20 25 30 Telecom - Services Telecom - Equipment & Accessories Industrial Capital Goods Cement Industrial Products Retailing Auto Ancillaries Finance Power Chemicals Hotels, Resorts & Other Recreational Activities Ferrous Metals Transportation Consumer Non Durables Gas Media And Entertainment Non - Ferrous Metals Auto Consumer Durables Construction Petroleum Products Construction Project Pharmaceuticals Software Banks Industry Allocation of Equity Holding (% of Net Assets) ^Past performance may or may not be sustained in the future. Load is not taken into consideration for computation of performance.
  • 9. Intouch mutually July 2017 9 Company Industry+ / Rating % to NAV Equity & Equity Related • HDFC Bank Ltd. Banks 9.09 • Larsen & Toubro Ltd. Construction Project 7.13 • Bharat Petroleum Corporation Ltd. Petroleum Products 6.09 • ICICI Bank Ltd. Banks 5.74 • Maruti Suzuki India Ltd. Auto 5.30 • Cipla Ltd. Pharmaceuticals 5.21 • State Bank of India Banks 4.75 • Teamlease Services Ltd. Commercial Services 4.62 • Tata Motors Ltd. DVR Auto 4.39 • BEML Ltd. Industrial Capital Goods 4.38 NHPC Ltd. Power 4.31 CESC Ltd. Power 4.30 Bharat Electronics Ltd. Industrial Capital Goods 3.92 KEC International Ltd. Construction Project 3.79 Infosys Ltd. Software 3.58 Titagarh Wagons Ltd. Industrial Capital Goods 3.26 Elecon Engineering Co. Ltd. Industrial Capital Goods 2.45 Dynamatic Technologies Ltd. Auto Ancillaries 2.38 Thyrocare Technologies Ltd. Healthcare Services 2.19 Kalpataru Power Transmission Ltd. Power 2.07 BSE Limited Finance 2.02 Transport Corporation of India Ltd. Transportation 1.73 PNC Infratech Ltd. Construction 1.58 Company Industry+ / Rating % to NAV Centum Electronics Ltd. Industrial Capital Goods 1.48 Network 18 Media & Investments Ltd Media & Entertainment 1.44 Sub Total 97.20 Debt & Debt Related Credit Exposure Au Small Finance Bank Ltd. FITCH - A+ 0.62 Sub Total 0.62 Total 97.82 Cash, Cash Equivalents and Net Current Assets 2.18 Grand Total 100.00 • Top Ten Holdings l investment objective To generate capital appreciation through equity investment in companies whose shares are quoting at prices below their true value. l Fund Manager ¥ Vinay Kulkarni (since November 21, 06) Total Experience: Over 27 years l Inception Date (Date of Allotment) September 17, 2004 NAV (as on July 31, 2017) NAV per Unit (`) Regular Plan - Growth Option 78.465 Regular Plan - Dividend Option 20.996 Direct Plan - Growth Option 81.406 Direct Plan - Dividend Option 22.234 aSSETS UNDER MANAGEMENT (`) IN CRORE As on July 31, 2017 657.93 Average for Month of July, 2017 645.40 l quantitative data Portfolio Turnover Ratio (Last 1 year) 18.74% Risk Ratio n Standard Deviation 5.072% n Beta 1.138 n Sharpe Ratio* 0.133 Computed for the 3-yr period ended July 31, 2017. Based on month-endNAV.*Riskfreerate:6.25%(Source:FIMMDAMIBOR) Total Expense Ratio (Weighted Average for the month) Excluding Goods and Service Tax on Management Fees Regular: 2.56% Direct: 1.44% l #BENCHMARK INDEX: S&P BSE 200 l ##addl. BENCHMARK INDEX: S&P BSE Sensex l Exit Load l In respect of each purchase / switch-in of Units, an Exit Load of 1.00% is payable if Units are redeemed / switched- out within 1 year from the date of allotment. l No Exit Load is payable if Units are redeemed / switched- out after 1 year from the date of allotment. For further details, please refer to para ‘Exit Load’ on Pg 51. l PlanS & Options Regular Plan, Direct Plan. Under Each Plan : Growth & Dividend. The Dividend Option offers Dividend Payout and Reinvestment facility. l Minimum Application Amount Purchase : ` 5,000 and any amount thereafter. Additional Purchase : ` 1,000 and any amount thereafter. l Redemption Proceeds Normally despatched within 3-4 Business Days. ¥ Dedicated Fund Manager for Overseas Investments: Mr Rakesh Vyas (Total Experience: Over 10 years). HDFC Core & Satellite Fund (An open-ended growth scheme) SIP Performance^ - Regular Plan - Growth Option Since Inception SIP 10 year SIP 5 year SIP 3 year SIP 1 year SIP Total Amount Invested (` ‘000) 1,550.00 1,200.00 600.00 360.00 120.00 Mkt Value as on July 31, 2017 (` ‘000) 4,180.66 2,566.63 965.03 461.89 138.48 Returns (Annualised) (%) 14.33 14.54 19.09 16.89 29.89 Benchmark Returns (Annualised) (%) # 12.28 12.11 15.39 14.59 27.56 Addl. Benchmark Ret. (Annualised) (%) ## 11.22 10.47 12.30 11.43 25.85 Assuming ` 10,000 invested systematically on the first Business Day of every month over a period of time. CAGR returns are computed after accounting for the cash flow by using XIRR method (investment internal rate of return) for Regular Plan - Growth Option. The above investment simulation is for illustrative purposes only and should not be construed as a promise on minimum returns and safeguard of capital. Performance^ - Regular Plan - Growth Option Date Period Scheme Returns (%) Benchmark Returns (%)# Additional Benchmark Returns (%) ## Value of ` 10,000 invested Scheme (`) Benchmark (`)# Additional Benchmark (`)## Jul 29, 16 Last 1 Year 22.64 18.56 15.82 12,277 11,867 11,591 Jul 31, 14 Last 3 Years 13.62 11.68 7.88 14,672 13,933 12,556 Jul 31, 12 Last 5 Years 17.95 15.68 13.53 22,837 20,722 18,864 Sep 17, 04 Since Inception 17.35 15.00 14.70 78,465 60,454 58,468 Returns greater than 1 year period are compounded annualized (CAGR). For performance of other schemes managed by Vinay Kulkarni, please refer page 51. Different plans viz. Regular Plan and Direct Plan have a different expense structure. The expenses of the Direct Plan under the Scheme will be lower to the extent of the distribution expenses / commission charged in the Regular Plan. For Performance of Direct Plan, refer page no. 59. Face Value per Unit: ` 10 unless otherwise specified, + Industry Classification as recommended by AMFI, Data is as of July 31, 2017 unless otherwise specified. This product is suitable for investors who are seeking ~ l Capital appreciation over long term. l Investment primarily in equity and equity related instruments of companies whose shares are quoting at prices below their true value. Riskometer Investors understand that their principal will be at moderately high risk ~ Investors should consult their financial advisers if in doubt about whether the product is suitable for them. Portfolio 1.44 1.58 1.73 2.02 2.19 2.38 3.58 4.62 5.21 6.09 9.69 10.68 10.92 15.49 19.58 0 5 10 15 20 25 Media And Entertainment Construction Transportation Finance Healthcare Services Auto Ancillaries Software Commercial Services Pharmaceuticals Petroleum Products Auto Power Construction Project Industrial Capital Goods Banks Industry Allocation of Equity Holding (% of Net Assets) ^Past performance may or may not be sustained in the future. Load is not taken into consideration for computation of performance.
  • 10. 10 July 2017 Intouch mutually l investment objective To generate capital appreciation in the long term through equity investments by investing in a diversified portfolio of Mid Cap and Large Cap ‘blue chip’ companies. l Fund Manager ¥ Vinay Kulkarni (since November 21, 06) Total Experience: Over 27 years l Inception Date (Date of Allotment) April 6, 2005 NAV (as on July 31, 2017) NAV per Unit (`) Regular Plan - Growth Option 53.973 Regular Plan - Dividend Option 14.899 Direct Plan - Growth Option 55.433 Direct Plan - Dividend Option 15.413 aSSETS UNDER MANAGEMENT (`) IN CRORE As on July 31, 2017 323.85 Average for Month of July, 2017 315.24 l quantitative data Portfolio Turnover Ratio (Last 1 year) 18.61% Risk Ratio n Standard Deviation 5.231% n Beta 1.205 n Sharpe Ratio* 0.104 Computed for the 3-yr period ended July 31, 2017. Based on month-endNAV.*Riskfreerate:6.25%(Source:FIMMDAMIBOR) Total Expense Ratio (Weighted Average for the month) Excluding Goods and Service Tax on Management Fees Regular: 2.68% Direct: 2.08% l #BENCHMARK INDEX: NIFTY 500 Index l ##addl. BENCHMARK INDEX: NIFTY 50 Index l Exit Load l In respect of each purchase / switch-in of Units, an Exit Load of 1.00% is payable if Units are redeemed / switched- out within 1 year from the date of allotment. l No Exit Load is payable if Units are redeemed / switched- out after 1 year from the date of allotment. For further details, please refer to para ‘Exit Load’ on Pg 51. l PlanS & Options Regular Plan, Direct Plan. Under Each Plan : Growth & Dividend. The Dividend Option offers Dividend Payout and Reinvestment facility. l Minimum Application Amount Purchase : ` 5,000 and any amount thereafter. Additional Purchase : ` 1,000 and any amount thereafter. l Redemption Proceeds Normally despatched within 3-4 Business Days. l Segment-wise break-up of equity holding (% of net assets) Large Cap 46.89% Mid Cap 51.65% ¥ Dedicated Fund Manager for Overseas Investments: Mr Rakesh Vyas (Total Experience: Over 10 years). HDFC Premier Multi-cap Fund (An open-ended growth scheme) SIP Performance^ - Regular Plan - Growth Option Since Inception SIP 10 year SIP 5 year SIP 3 year SIP 1 year SIP Total Amount Invested (` ‘000) 1,480.00 1,200.00 600.00 360.00 120.00 Mkt Value as on July 31, 2017 (` ‘000) 3,446.90 2,410.88 922.79 449.04 137.93 Returns (Annualised) (%) 12.91 13.38 17.26 14.91 28.98 Benchmark Returns (Annualised) (%) # 12.07 12.48 16.26 15.41 28.75 Addl. Benchmark Ret. (Annualised) (%) ## 11.17 11.01 13.26 12.60 26.58 Assuming ` 10,000 invested systematically on the first Business Day of every month over a period of time. CAGR returns are computed after accounting for the cash flow by using XIRR method (investment internal rate of return) for Regular Plan - Growth Option. The above investment simulation is for illustrative purposes only and should not be construed as a promise on minimum returns and safeguard of capital. Performance^ - Regular Plan - Growth Option Date Period Scheme Returns (%) Benchmark Returns (%)# Additional Benchmark Returns (%) ## Value of ` 10,000 invested Scheme (`) Benchmark (`)# Additional Benchmark (`)## Jul 29, 16 Last 1 Year 22.72 19.84 16.56 12,286 11,996 11,665 Jul 31, 14 Last 3 Years 11.76 12.38 9.27 13,963 14,195 13,051 Jul 31, 12 Last 5 Years 16.07 16.33 14.01 21,074 21,310 19,272 Apr 06, 05 Since Inception 14.66 13.70 13.70 53,973 48,662 48,698 Returns greater than 1 year period are compounded annualized (CAGR). For performance of other schemes managed by Vinay Kulkarni, please refer page 51. Different plans viz. Regular Plan and Direct Plan have a different expense structure. The expenses of the Direct Plan under the Scheme will be lower to the extent of the distribution expenses / commission charged in the Regular Plan. For Performance of Direct Plan, refer page no. 59. Face Value per Unit: ` 10 unless otherwise specified, + Industry Classification as recommended by AMFI, Data is as of July 31, 2017 unless otherwise specified. This product is suitable for investors who are seeking ~ l Capital appreciation over long term. l Investment predominantly in equity and equity related instruments of Mid Cap and Large Cap ‘blue chip’ companies. Riskometer Investors understand that their principal will be at moderately high risk ~ Investors should consult their financial advisers if in doubt about whether the product is suitable for them. Company Industry+ % to NAV Equity & Equity Related • State Bank of India Banks 9.46 • HDFC Bank Ltd. Banks 8.87 • ICICI Bank Ltd. Banks 7.76 • Maruti Suzuki India Ltd. Auto 4.79 • Tata Motors Ltd. DVR Auto 4.78 • Infosys Ltd. Software 4.68 • Tata Steel Ltd. Ferrous Metals 4.57 • Punjab National Bank Banks 4.51 • KEC International Ltd. Construction Project 4.50 • Bharat Petroleum Corporation Ltd. Petroleum Products 4.38 Housing Development Finance Corporation Ltd.£ Finance 4.14 Bharat Electronics Ltd. Industrial Capital Goods 4.14 Larsen & Toubro Ltd. Construction Project 3.98 Hindustan Construction Company Ltd. Construction Project 3.67 Crompton Greaves Consumer Elec. Ltd Consumer Durables 3.63 Bank of Baroda Banks 3.51 Axis Bank Ltd. Banks 3.21 Kalpataru Power Transmission Ltd. Power 2.50 Cipla Ltd. Pharmaceuticals 2.08 Titagarh Wagons Ltd. Industrial Capital Goods 1.91 Crompton Greaves Ltd. Industrial Capital Goods 1.67 Company Industry+ % to NAV The Indian Hotels Company Ltd. Hotels, Resorts & Other Recreational Activities 1.66 Siemens Ltd. Industrial Capital Goods 1.35 Dilip Buildcon Ltd. Construction 1.24 Astra Microwave Products Ltd. Telecom - Equipment & Accessories 0.99 Tamil Nadu Newsprint & Papers Ltd. Paper 0.57 Total 98.55 Cash, Cash Equivalents and Net Current Assets 1.45 Grand Total 100.00 • Top Ten Holdings, £ Co-sponsor Portfolio 0.57 0.99 1.24 1.66 2.08 2.50 3.63 4.14 4.38 4.57 4.68 9.07 9.57 12.15 37.32 0 5 10152025303540 Paper Telecom - Equipment & Accessories Construction Hotels, Resorts & Other Recreational Activities Pharmaceuticals Power Consumer Durables Finance Petroleum Products Ferrous Metals Software Industrial Capital Goods Auto Construction Project Banks Industry Allocation of Equity Holding (% of Net Assets) ^Past performance may or may not be sustained in the future. Load is not taken into consideration for computation of performance.
  • 11. Intouch mutually July 2017 11 Company Industry+ % to NAV Equity & Equity Related • ICICI Bank Ltd. Banks 9.64 • HDFC Bank Ltd. Banks 9.52 • State Bank of India Banks 9.51 • Reliance Industries Ltd. Petroleum Products 9.04 • Larsen & Toubro Ltd. Construction Project 8.85 • Bharat Petroleum Corporation Ltd. Petroleum Products 6.93 • Axis Bank Ltd. Banks 6.54 • Maruti Suzuki India Ltd. Auto 5.79 • ITC Ltd. Consumer Non Durables 4.98 • Infosys Ltd. Software 4.90 Tata Motors Ltd. DVR Auto 4.62 UltraTech Cement Ltd. Cement 3.09 Cognizant Technology Solutions Corp Software 3.08 Indusind Bank Ltd. Banks 2.68 Mahindra & Mahindra Ltd. Auto 2.43 Power Grid Corporation of India Ltd. Power 2.04 Adani Ports and Special Economic Zone Ltd. Transportation 1.35 GAIL (India) Ltd. Gas 0.80 Company Industry+ % to NAV NTPC Ltd. Power 0.63 Indian Oil Corporation Ltd. Petroleum Products 0.54 Sub Total 93.88 Foreign Securities and / or overseas ETF(s) Cognizant Technology Solutions Corp Software 3.08 Sub Total 3.08 Cash, Cash Equivalents and Net Current Assets 3.04 Grand Total 100.00 • Top Ten Holdings l investment objective To provide long-term capital appreciation by investing predominantly in large cap companies. l Fund Manager § ¥ Vinay Kulkarni (since June 27, 14) Total Experience: Over 27 years l Inception Date (Date of Allotment) February 18, 1994 NAV (as on July 31, 2017) NAV per Unit (`) Regular Plan - Growth Option 108.042 Regular Plan - Dividend Option 22.679 Direct Plan - Growth Option 108.960 Direct Plan - Dividend Option 25.589 aSSETS UNDER MANAGEMENT (`) IN CRORE As on July 31, 2017 1,312.43 Average for Month of July, 2017 1,292.50 l quantitative data Portfolio Turnover Ratio (Last 1 year) 11.22% Risk Ratio n Standard Deviation 4.130% n Beta 1.004 n Sharpe Ratio* 0.078 Computed for the 3-yr period ended July 31, 2017. Based on month-endNAV.*Riskfreerate:6.25%(Source:FIMMDAMIBOR) Total Expense Ratio (Weighted Average for the month) Excluding Goods and Service Tax on Management Fees Regular: 2.18% Direct: 2.08% l #BENCHMARK INDEX: NIFTY 50 Index l ##addl. BENCHMARK INDEX: S&P BSE Sensex l Exit Load l In respect of each purchase / switch-in of Units, an Exit Load of 1.00% is payable if Units are redeemed / switched- out within 1 year from the date of allotment. l No Exit Load is payable if Units are redeemed / switched- out after 1 year from the date of allotment. For further details, please refer to para ‘Exit Load’ on Pg 51. l PlanS & Options Regular Plan, Direct Plan. Under Each Plan : Growth & Dividend. The Dividend Option offers Dividend Payout and Reinvestment facility. l Minimum Application Amount Purchase : ` 5,000 and any amount thereafter. Additional Purchase : ` 1,000 and any amount thereafter. l Redemption Proceeds Normally despatched within 3-4 Business Days. § Date of migration from Morgan Stanley Mutual Fund (Close of business hours - June 27, 14) ¥ Dedicated Fund Manager for Overseas Investments: Mr Rakesh Vyas (Total Experience: Over 10 years). HDFC Large Cap Fund (An open-ended equity scheme) SIP Performance^ - Regular Plan - Growth Option Since Inception SIP 5 year SIP 3 year SIP 1 year SIP Total Amount Invested (` ‘000) 1,110.00 600.00 360.00 120.00 Mkt Value as on July 31, 2017 (` ‘000) $$ 1,926.39 830.39 437.81 137.31 Returns (Annualised) (%) $$ 11.53 12.97 13.14 27.94 Benchmark Returns (Annualised) (%) # 11.76 13.26 12.60 26.58 Addl. Benchmark Ret. (Annualised) (%) ## 11.21 12.30 11.43 25.85 Assuming ` 10,000 invested systematically on the first Business Day of every month over a period of time. CAGR returns are computed after accounting for the cash flow by using XIRR method (investment internal rate of return) for Regular Plan - Growth Option. The above investment simulation is for illustrative purposes only and should not be construed as a promise on minimum returns and safeguard of capital. Performance^ - Regular Plan - Growth Option Date Period Scheme Returns (%) $$ Benchmark Returns (%)# Additional Benchmark Returns (%) ## Value of ` 10,000 invested Scheme (`) $$ Benchmark (`)# Additional Benchmark (`)## Jul 29, 16 Last 1 Year 19.23 16.56 15.82 11,935 11,665 11,591 Jul 31, 14 Last 3 Years 9.49 9.27 7.88 13,128 13,051 12,556 Jul 31, 12 Last 5 Years 14.00 14.01 13.53 19,261 19,272 18,864 Feb 18, 94 Since Inception 11.25 9.37 9.44 121,871 81,784 83,051 Returns greater than 1 year period are compounded annualized (CAGR). $$ All dividends declared prior to the splitting of the Scheme into Dividend & Growth Options are assumed to be reinvested in the units of the Scheme at the then prevailing NAV. For performance of other schemes managed by Vinay Kulkarni, please refer page 51. Different plans viz. Regular Plan and Direct Plan have a different expense structure. The expenses of the Direct Plan under the Scheme will be lower to the extent of the distribution expenses / commission charged in the Regular Plan. For Performance of Direct Plan, refer page no. 59. Face Value per Unit: ` 10 unless otherwise specified, + Industry Classification as recommended by AMFI, Data is as of July 31, 2017 unless otherwise specified. This product is suitable for investors who are seeking ~ l Capital appreciation over long term. l Investment in equity and equity related instruments of Large Cap companies. Riskometer Investors understand that their principal will be at moderately high risk ~ Investors should consult their financial advisers if in doubt about whether the product is suitable for them. Portfolio 0.80 1.35 2.67 3.09 4.98 7.98 8.85 12.84 16.51 37.89 0 5 10 15 20 25 30 35 40 Gas Transportation Power Cement Consumer Non Durables Software Construction Project Auto Petroleum Products Banks Industry Allocation of Equity Holding (% of Net Assets) ^Past performance may or may not be sustained in the future. Load is not taken into consideration for computation of performance.
  • 12. 12 July 2017 Intouch mutually l investment objective To generate long-term capital appreciation from a portfolio that is substantially constituted of equity and equity related securities of Small and Mid-Cap companies. l Fund Manager ¥ Chirag Setalvad (since June 25, 07) Total Experience: Over 17 years l Inception Date (Date of Allotment) June 25, 2007 NAV (as on July 31, 2017) NAV per Unit (`) Regular Plan - Growth Option 54.096 Regular Plan - Dividend Option 33.167 Direct Plan - Growth Option 56.092 Direct Plan - Dividend Option 38.895 aSSETS UNDER MANAGEMENT (`) IN CRORE As on July 31, 2017 17,841.14 Average for Month of July, 2017 17,488.14 l quantitative data Portfolio Turnover Ratio (Last 1 year) 23.80% Risk Ratio n Standard Deviation 4.189% n Beta 0.935 n Sharpe Ratio* 0.312 Computed for the 3-yr period ended July 31, 2017. Based on month-endNAV.*Riskfreerate:6.25%(Source:FIMMDAMIBOR) Total Expense Ratio (Weighted Average for the month) Excluding Goods and Service Tax on Management Fees Regular: 2.23% Direct: 1.23% l #BENCHMARK INDEX: NIFTY Free Float Midcap 100 Index l ##addl. BENCHMARK INDEX: NIFTY 50 Index l Exit Load l In respect of each purchase / switch-in of Units, an Exit Load of 1.00% is payable if Units are redeemed / switched- out within 1 year from the date of allotment. l No Exit Load is payable if Units are redeemed / switched- out after 1 year from the date of allotment. For further details, please refer to para ‘Exit Load’ on Pg 51. l PlanS & Options Regular Plan, Direct Plan. Under Each Plan : Growth & Dividend. The Dividend Option offers Dividend Payout and Reinvestment facility. l Minimum Application Amount Purchase : ` 5,000 and any amount thereafter. Additional Purchase : ` 1,000 and any amount thereafter. l Redemption Proceeds Normally despatched within 3-4 Business Days. l Segment-wise break-up of equity holding (% of net assets) Large Cap 1.46% Mid Cap 93.88% ¥ Dedicated Fund Manager for Overseas Investments: Mr Rakesh Vyas (Total Experience: Over 10 years). HDFC Mid-Cap Opportunities Fund (An open-ended equity scheme) SIP Performance^ - Regular Plan - Growth Option Since Inception SIP 10 year SIP 5 year SIP 3 year SIP 1 year SIP Total Amount Invested (` ‘000) 1,220.00 1,200.00 600.00 360.00 120.00 Mkt Value as on July 31, 2017 (` ‘000) 4,225.85 4,118.14 1,187.70 498.72 138.29 Returns (Annualised) (%) 23.06 23.31 27.72 22.38 29.58 Benchmark Returns (Annualised) (%) # 16.02 16.20 22.59 20.64 28.88 Addl. Benchmark Ret. (Annualised) (%) ## 10.92 11.01 13.26 12.60 26.58 Assuming ` 10,000 invested systematically on the first Business Day of every month over a period of time. CAGR returns are computed after accounting for the cash flow by using XIRR method (investment internal rate of return) for Regular Plan - Growth Option. The above investment simulation is for illustrative purposes only and should not be construed as a promise on minimum returns and safeguard of capital. Performance^ - Regular Plan - Growth Option Date Period Scheme Returns (%) Benchmark Returns (%)# Additional Benchmark Returns (%) ## Value of ` 10,000 invested Scheme (`) Benchmark (`)# Additional Benchmark (`)## Jul 29, 16 Last 1 Year 26.35 25.18 16.56 12,652 12,533 11,665 Jul 31, 14 Last 3 Years 23.05 19.52 9.27 18,640 17,083 13,051 Jul 31, 12 Last 5 Years 27.06 20.88 14.01 33,133 25,828 19,272 Jun 25, 07 Since Inception 18.18 12.12 8.89 54,096 31,773 23,658 Returns greater than 1 year period are compounded annualized (CAGR). For performance of other schemes managed by Chirag Setalvad, please refer page 51. Different plans viz. Regular Plan and Direct Plan have a different expense structure. The expenses of the Direct Plan under the Scheme will be lower to the extent of the distribution expenses / commission charged in the Regular Plan. For Performance of Direct Plan, refer page no. 59. Face Value per Unit: ` 10 unless otherwise specified, + Industry Classification as recommended by AMFI, Data is as of July 31, 2017 unless otherwise specified. This product is suitable for investors who are seeking ~ l Capital appreciation over long term. l Investment predominantly in equity and equity related instruments of Small and Mid Cap companies. Riskometer Investors understand that their principal will be at moderately high risk ~ Investors should consult their financial advisers if in doubt about whether the product is suitable for them. Portfolio Company Industry+ % to NAV Equity & Equity Related • Tube Investments of India Ltd. Auto Ancillaries 3.39 • Voltas Ltd. Construction Project 2.88 • Yes Bank Ltd. Banks 2.59 • Aurobindo Pharma Ltd. Pharmaceuticals 2.55 • Indusind Bank Ltd. Banks 2.41 • UPL Ltd. Pesticides 2.40 • Balkrishna Industries Ltd. Auto Ancillaries 2.21 • Sundram Fasteners Ltd. Auto Ancillaries 2.18 • Adani Ports and Special Economic Zone Ltd. Transportation 2.18 • Hexaware Technologies Ltd. Software 2.09 Federal Bank Ltd. Banks 1.93 Aarti Industries Ltd. Chemicals 1.92 Carborundum Universal Ltd. Industrial Products 1.90 MRF Ltd. Auto Ancillaries 1.85 VST Industries Ltd. Consumer Non Durables 1.81 Bajaj Finance Ltd. Finance 1.79 Cholamandalam Investment and Finance Company Ltd. Finance 1.76 Punjab National Bank Banks 1.73 Torrent Pharmaceuticals Ltd. Pharmaceuticals 1.70 Blue Star Ltd. Consumer Durables 1.66 SKF India Ltd. Industrial Products 1.59 Indian Bank Banks 1.56 Bharat Electronics Ltd. Industrial Capital Goods 1.55 Trent Ltd. Retailing 1.54 Redington (India) Limited Transportation 1.53 City Union Bank Ltd. Banks 1.47 Axis Bank Ltd. Banks 1.46 Hindustan Petroleum Corporation Ltd. Petroleum Products 1.45 Navneet Education Ltd. Media & Entertainment 1.43 Bank of Baroda Banks 1.43 The Indian Hotels Company Ltd. Hotels, Resorts & Other Recreational Activities 1.40 Jagran Prakashan Ltd. Media & Entertainment 1.35 Supreme Industries Ltd. Industrial Products 1.34 Lakshmi Machine Works Ltd. Industrial Capital Goods 1.29 Capital First Ltd. Finance 1.27 KNR Constructions Ltd. Construction 1.24 Petronet LNG Ltd. Gas 1.20 D.B.Corp Ltd. Media & Entertainment 1.18 Greenply Industries Ltd. Consumer Durables 1.12 NIIT Technologies Ltd. Software 1.12 Atul Ltd. Chemicals 1.09 Solar Industries India Ltd. Chemicals 1.03 Karur Vysya Bank Ltd. Banks 1.02 Exide Industries Ltd. Auto Ancillaries 0.99 IPCA Laboratories Ltd. Pharmaceuticals 0.96 Power Finance Corporation Ltd. Finance 0.93 Union Bank of India Banks 0.93 Vardhman Textiles Ltd. Textiles - Cotton 0.92 Greenlam Industries Ltd. Consumer Durables 0.89 Fag Bearings India Ltd. Industrial Products 0.89 Cummins India Ltd. Industrial Products 0.89 Vesuvius India Ltd. Industrial Products 0.89 KEC International Ltd. Construction Project 0.85 Mahindra Holidays & Resorts Ind Ltd Hotels, Resorts & Other Recreational Activities 0.85 Max Financial Services Limited Finance 0.82 AIA Engineering Ltd. Industrial Products 0.81 Divi's Laboratories Ltd. Pharmaceuticals 0.80 Sadbhav Engineering Ltd. Construction Project 0.75 Allahabad Bank Banks 0.75 Company Industry+ % to NAV Grindwell Norton Ltd. Industrial Products 0.71 Oracle Financial Services Software Ltd. Software 0.69 Strides Shasun Limited Pharmaceuticals 0.67 Dhanuka Agritech Ltd. Pesticides 0.66 Delta Corp Ltd. Hotels, Resorts & Other Recreational Activities 0.62 Whirlpool of India Ltd. Consumer Durables 0.57 Apollo Tyres Ltd. Auto Ancillaries 0.56 Huhtamaki PPL Ltd. Industrial Products 0.55 Persistent Systems Limited Software 0.54 Havells India Ltd. Consumer Durables 0.53 Thermax Ltd. IndustrialCapitalGoods 0.40 Bata India Ltd. Consumer Durables 0.33 Oil India Ltd. Oil 0.26 eClerx Services Ltd. Software 0.22 Max India Limited Healthcare Services 0.20 Crompton Greaves Ltd. IndustrialCapitalGoods 0.11 GTPL Hathway Ltd. Media & Entertainment 0.10 Wockhardt Ltd. Pharmaceuticals 0.09 Sub Total 95.32 Preference Shares Zee Entertainment Enterprises Ltd. Media & Entertainment 0.01 Sub Total 0.01 Total 95.33 Cash, Cash Equivalents and Net Current Assets 4.67 Grand Total 100.00 • Top Ten Holdings 0.20 0.26 0.92 1.20 1.24 1.45 1.54 1.81 2.87 3.06 3.35 3.71 4.04 4.07 4.48 4.66 5.10 6.57 6.77 9.57 11.18 17.28 0 2 4 6 8 101214161820 Healthcare Services Oil Textiles - Cotton Gas Construction Petroleum Products Retailing Consumer Non Durables Hotels, Resorts & Other Recreational Activities Pesticides Industrial Capital Goods Transportation Chemicals Media And Entertainment Construction Project Software Consumer Durables Finance Pharmaceuticals Industrial Products Auto Ancillaries Banks Industry Allocation of Equity Holding (% of Net Assets) ^Past performance may or may not be sustained in the future. Load is not taken into consideration for computation of performance.
  • 13. Intouch mutually July 2017 13 l investment objective To provide long-term capital appreciation by investing predominantly in Small-Cap and Mid-Cap companies. l Fund Manager § ¥ Chirag Setalvad (since June 27, 14) Total Experience: Over 17 years l Inception Date (Date of Allotment) April 3, 2008 NAV (as on July 31, 2017) NAV per Unit (`) Regular Plan - Growth Option 38.072 Regular Plan - Dividend Option 24.864 Direct Plan - Growth Option 39.804 Direct Plan - Dividend Option 26.359 aSSETS UNDER MANAGEMENT (`) IN CRORE As on July 31, 2017 1,206.69 Average for Month of July, 2017 1,195.95 l quantitative data Portfolio Turnover Ratio (Last 1 year) 29.42% Risk Ratio n Standard Deviation 4.413% n Beta 0.636 n Sharpe Ratio* 0.271 Computed for the 3-yr period ended July 31, 2017. Based on month-endNAV.*Riskfreerate:6.25%(Source:FIMMDAMIBOR) Total Expense Ratio (Weighted Average for the month) Excluding Goods and Service Tax on Management Fees Regular: 2.46% Direct: 1.31% l #BENCHMARKINDEX:NIFTYFreeFloatSmallcap100Index l ##addl. BENCHMARK INDEX: NIFTY 50 Index l Exit Load l In respect of each purchase / switch-in of Units, an Exit Load of 1.00% is payable if Units are redeemed / switched- out within 1 year from the date of allotment. l No Exit Load is payable if Units are redeemed / switched- out after 1 year from the date of allotment. For further details, please refer to para ‘Exit Load’ on Pg 51. l PlanS & Options Regular Plan, Direct Plan. Under Each Plan : Growth & Dividend. The Dividend Option offers Dividend Payout and Reinvestment facility. l Minimum Application Amount Purchase : ` 5,000 and any amount thereafter. Additional Purchase : ` 1,000 and any amount thereafter. l Redemption Proceeds Normally despatched within 3-4 Business Days. l Segment-wise break-up of equity holding (% of net assets) Mid Cap 4.17% Small Cap 87.79% § Date of migration from Morgan Stanley Mutual Fund (Close of business hours - June 27, 14) ¥ Dedicated Fund Manager for Overseas Investments: Mr Rakesh Vyas (Total Experience: Over 10 years). HDFC Small Cap Fund (An open-ended equity scheme) SIP Performance^ - Regular Plan - Growth Option Since Inception SIP 5 year SIP 3 year SIP 1 year SIP Total Amount Invested (` ‘000) 1,120.00 600.00 360.00 120.00 Mkt Value as on July 31, 2017 (` ‘000) 2,881.40 1,080.40 503.27 142.50 Returns (Annualised) (%) 19.37 23.76 23.03 36.70 Benchmark Returns (Annualised) (%) # 15.80 22.76 21.95 37.69 Addl. Benchmark Ret. (Annualised) (%) ## 11.69 13.26 12.60 26.58 Assuming ` 10,000 invested systematically on the first Business Day of every month over a period of time. CAGR returns are computed after accounting for the cash flow by using XIRR method (investment internal rate of return) for Regular Plan - Growth Option. The above investment simulation is for illustrative purposes only and should not be construed as a promise on minimum returns and safeguard of capital. Performance^ - Regular Plan - Growth Option Date Period Scheme Returns (%) Benchmark Returns (%)# Additional Benchmark Returns (%) ## Value of ` 10,000 invested Scheme (`) Benchmark (`)# Additional Benchmark (`)## Jul 29, 16 Last 1 Year 29.31 28.00 16.56 12,949 12,817 11,665 Jul 31, 14 Last 3 Years 21.24 15.50 9.27 17,831 15,415 13,051 Jul 31, 12 Last 5 Years 22.96 19.44 14.01 28,126 24,316 19,272 Apr 03, 08 Since Inception 15.40 8.35 8.34 38,072 21,137 21,119 Returns greater than 1 year period are compounded annualized (CAGR). For performance of other schemes managed by Chirag Setalvad, please refer page 51. Different plans viz. Regular Plan and Direct Plan have a different expense structure. The expenses of the Direct Plan under the Scheme will be lower to the extent of the distribution expenses / commission charged in the Regular Plan. For Performance of Direct Plan, refer page no. 59. Face Value per Unit: ` 10 unless otherwise specified, + Industry Classification as recommended by AMFI, Data is as of July 31, 2017 unless otherwise specified. This product is suitable for investors who are seeking ~ l Capital appreciation over long term. l Investment predominantly in equity and equity related instruments of Small-Cap and Mid-Cap companies. Riskometer Investors understand that their principal will be at moderately high risk ~ Investors should consult their financial advisers if in doubt about whether the product is suitable for them. Portfolio Company Industry+ % to NAV Equity & Equity Related • Oriental Carbon & Chemicals Ltd. Chemicals 4.12 • KEC International Ltd. Construction Project 3.94 • Carborundum Universal Ltd. Industrial Products 3.88 • Aarti Industries Ltd. Chemicals 3.83 • Tube Investments of India Ltd. Auto Ancillaries 3.61 • City Union Bank Ltd. Banks 3.25 • Balkrishna Industries Ltd. Auto Ancillaries 3.12 • Dilip Buildcon Ltd. Construction 2.85 • Apar Industries Limited Industrial Capital Goods 2.77 • Swaraj Engines Ltd. Industrial Products 2.61 LG Balakrishnan & Bros Ltd. Auto Ancillaries 2.39 Federal Bank Ltd. Banks 2.39 PNC Infratech Ltd. Construction 2.29 Redington (India) Limited Transportation 2.16 NIIT Technologies Ltd. Software 2.06 KalpataruPowerTransmissionLtd. Power 2.03 Hexaware Technologies Ltd. Software 1.95 Oriental Bank of Commerce Banks 1.91 Greenply Industries Ltd. Consumer Durables 1.86 Aurobindo Pharma Ltd. Pharmaceuticals 1.79 Century Plyboards (India) Ltd. Consumer Durables 1.75 Vesuvius India Ltd. Industrial Products 1.75 Sundram Fasteners Ltd. Auto Ancillaries 1.71 Jagran Prakashan Ltd. Media & Entertainment 1.67 VIP Industries Ltd. Consumer Durables 1.65 IFB Industries Ltd. Consumer Durables 1.65 D.B. Corp Ltd. Media & Entertainment 1.59 Titagarh Wagons Ltd. Industrial Capital Goods 1.53 The Indian Hotels Company Ltd. Hotels, Resorts & Other Recreational Activities 1.49 Insecticides (India) Ltd. Pesticides 1.48 V.S.T Tillers Tractors Ltd. Auto 1.47 Banco Products (I) Ltd. Auto Ancillaries 1.44 Hindustan Construction Company Ltd. Construction Project 1.42 Vardhman Textiles Ltd. Textiles - Cotton 1.41 Sarla Performance Fibers Ltd. Textiles - Synthetic 1.40 Sadbhav Engineering Ltd. Construction Project 1.37 Great Eastern Shipping Company Ltd. Transportation 1.27 Company Industry+ % to NAV Everest Industries Ltd. Cement 1.25 Nilkamal Ltd. Industrial Products 1.18 SKF India Ltd. Industrial Products 1.16 Power Mech Projects Ltd. Construction Project 1.07 Time Technoplast Ltd. Industrial Products 1.05 Corporation Bank Banks 0.95 Atul Auto Ltd. Auto 0.93 Garware Wall Ropes Ltd. Textile Products 0.77 Mold-Tek Packaging Ltd. Industrial Products 0.71 NRB Bearing Ltd. Industrial Products 0.65 Indian Bank Banks 0.58 Avanti Feeds Ltd. Consumer Non Durables 0.42 IFGL Refractories Ltd. Industrial Products 0.39 Total 91.97 Cash, Cash Equivalents and Net Current Assets 8.03 Grand Total 100.00 • Top Ten Holdings 0.42 0.77 1.25 1.40 1.41 1.48 1.49 1.79 2.03 2.40 3.26 3.43 4.01 4.30 5.14 6.91 7.80 7.95 9.08 12.27 13.38 0 2 4 6 8 10 12 14 16 Consumer Non Durables Textile Products Cement Textiles - Synthetic Textiles - Cotton Pesticides Hotels, Resorts & Other Recreational Activities Pharmaceuticals Power Auto Media And Entertainment Transportation Software Industrial Capital Goods Construction Consumer Durables Construction Project Chemicals Banks Auto Ancillaries Industrial Products Industry Allocation of Equity Holding (% of Net Assets) ^Past performance may or may not be sustained in the future. Load is not taken into consideration for computation of performance.
  • 14. 14 July 2017 Intouch mutually l investment objective Toseeklong-termcapitalappreciationbyinvestingpredominantly in equity and equity related securities of companies engaged in or expected to benefit from the growth and development of infrastructure. l Fund Manager ¥ Srinivas Rao Ravuri (since March 20, 17) Total Experience: Over 22 years l Inception Date (Date of Allotment) March 10, 2008 NAV (as on July 31, 2017) NAV per Unit (`) Regular Plan - Growth Option 20.318 Regular Plan - Dividend Option 15.305 Direct Plan - Growth Option 21.090 Direct Plan - Dividend Option 19.329 aSSETS UNDER MANAGEMENT (`) IN CRORE As on July 31, 2017 1,379.68 Average for Month of July, 2017 1,358.15 l quantitative data Portfolio Turnover Ratio (Last 1 year) 6.01% Risk Ratio n Standard Deviation 5.610% n Beta 1.267 n Sharpe Ratio* 0.106 Computed for the 3-yr period ended July 31, 2017. Based on month-endNAV.*Riskfreerate:6.25%(Source:FIMMDAMIBOR) Total Expense Ratio (Weighted Average for the month) Excluding Goods and Service Tax on Management Fees Regular: 2.18% Direct: 1.38% l #BENCHMARK INDEX: NIFTY 500 Index l ##addl. BENCHMARK INDEX: NIFTY 50 Index l Exit Load l In respect of each purchase / switch-in of Units, an Exit Load of 1.00% is payable if Units are redeemed / switched- out within 1 year from the date of allotment. l No Exit Load is payable if Units are redeemed / switched- out after 1 year from the date of allotment. For further details, please refer to para ‘Exit Load’ on Pg 51. l PlanS & Options Regular Plan, Direct Plan. Under Each Plan : Growth & Dividend. The Dividend Option offers Dividend Payout and Reinvestment facility. l Minimum Application Amount Purchase : ` 5,000 and any amount thereafter. Additional Purchase : ` 1,000 and any amount thereafter. l Redemption Proceeds Normally despatched within 3-4 Business Days (Redemption is subject to completion of Lock-in Period, if applicable). ¥ Dedicated Fund Manager for Overseas Investments: Mr Rakesh Vyas (Total Experience: Over 10 years). HDFC Infrastructure Fund (An open-ended equity scheme) SIP Performance^ - Regular Plan - Growth Option Since Inception SIP 5 year SIP 3 year SIP 1 year SIP Total Amount Invested (` ‘000) 1,130.00 600.00 360.00 120.00 Mkt Value as on July 31, 2017 (` ‘000) 2,138.70 963.58 455.53 141.26 Returns (Annualised) (%) 13.06 19.03 15.91 34.60 Benchmark Returns (Annualised) (%) # 13.25 16.26 15.41 28.75 Addl. Benchmark Ret. (Annualised) (%) ## 11.62 13.26 12.60 26.58 Assuming ` 10,000 invested systematically on the first Business Day of every month over a period of time. CAGR returns are computed after accounting for the cash flow by using XIRR method (investment internal rate of return) for Regular Plan - Growth Option. The above investment simulation is for illustrative purposes only and should not be construed as a promise on minimum returns and safeguard of capital. Performance^ - Regular Plan - Growth Option Date Period Scheme Returns (%) Benchmark Returns (%)# Additional Benchmark Returns (%) ## Value of ` 10,000 invested Scheme (`) Benchmark (`)# Additional Benchmark (`)## Jul 29, 16 Last 1 Year 25.07 19.84 16.56 12,523 11,996 11,665 Jul 31, 14 Last 3 Years 12.10 12.38 9.27 14,092 14,195 13,051 Jul 31, 12 Last 5 Years 16.24 16.33 14.01 21,233 21,310 19,272 Mar 10, 08 Since Inception 7.84 8.95 8.21 20,318 22,387 20,992 Returns greater than 1 year period are compounded annualized (CAGR). For performance of other schemes managed by Srinivas Rao Ravuri, please refer page 51. Different plans viz. Regular Plan and Direct Plan have a different expense structure. The expenses of the Direct Plan under the Scheme will be lower to the extent of the distribution expenses / commission charged in the Regular Plan. For Performance of Direct Plan, refer page no. 60. Face Value per Unit: ` 10 unless otherwise specified, + Industry Classification as recommended by AMFI, Data is as of July 31, 2017 unless otherwise specified. This product is suitable for investors who are seeking ~ l Capital appreciation over long term. l Investment predominantly in equity and equity related securities of companies engaged in or expected to benefit from the growth and development of infrastructure. Riskometer Investors understand that their principal will be at high risk ~ Investors should consult their financial advisers if in doubt about whether the product is suitable for them. Portfolio Company Industry+ % to NAV Equity & Equity Related • State Bank of India Banks 9.60 • Larsen & Toubro Ltd. Construction Project 8.69 • ICICI Bank Ltd. Banks 7.48 • Siemens Ltd. Industrial Capital Goods 5.09 • JMC Projects (India) Ltd. Construction 3.88 • CESC Ltd. Power 3.79 • Bank of Baroda Banks 3.79 • Hindustan Construction Company Ltd. Construction Project 3.66 • Punjab National Bank Banks 3.62 • Astra Microwave Products Ltd. Telecom - Equipment & Accessories 3.00 Premier Explosives Ltd. Chemicals 2.92 Simplex Infrastructures Ltd. Construction 2.66 Centum Electronics Ltd. Industrial Capital Goods 2.51 Maruti Suzuki India Ltd. Auto 2.50 Dilip Buildcon Ltd. Construction 2.49 BEML Ltd. Industrial Capital Goods 2.45 HBL Power Systems Ltd. Consumer Non Durables 2.34 Dynamatic Technologies Ltd. Auto Ancillaries 2.08 Canara Bank Banks 2.05 B L Kashyap & Sons Ltd. Construction 2.05 Texmaco Rail & Engineering Ltd. Industrial Capital Goods 2.00 PNC Infratech Ltd. Construction 1.94 KEC International Ltd. Construction Project 1.93 MEP Infrastructure Developers Ltd. Transportation 1.66 Crompton Greaves Ltd. Industrial Capital Goods 1.41 ITD Cementation India Ltd. Construction 1.29 Vedanta Ltd. Non - Ferrous Metals 1.26 Sanghvi Movers Ltd Industrial Capital Goods 1.16 Gammon Infrastructure Projects Ltd. Construction Project 1.03 Tata Steel Ltd. Ferrous Metals 0.99 Everest Industries Ltd. Cement 0.88 Tata Motors Ltd. DVR Auto 0.85 Transformers And Rectifiers (India) Ltd. Industrial Capital Goods 0.83 SadbhavInfrastructureProjectLtd Construction Project 0.74 Sadbhav Engineering Ltd. Construction Project 0.60 Corporation Bank Banks 0.60 J.Kumar Infraprojects Ltd. Construction 0.58 Elecon Engineering Co. Ltd. Industrial Capital Goods 0.51 Swelect Energy Systems Ltd. Industrial Capital Goods 0.49 C & C Constructions Ltd. Construction 0.44 Company Industry+ % to NAV KSK Energy Ventures Ltd. Power 0.40 Oriental Bank of Commerce Banks 0.26 Rural Electrification Corporation Ltd. Finance 0.25 Pennar Engineered Bldg Systems Ltd Ferrous Metals 0.24 Jaiprakash Power Ventures Ltd. Power 0.19 Power Finance Corporation Ltd. Finance 0.15 Easun Reyrolle Ltd. Industrial Capital Goods 0.08 Total 99.41 Preference Shares Vedanta Ltd. Non - Ferrous Metals 0.16 Sub Total 0.16 Total 99.57 Cash, Cash Equivalents and Net Current Assets 0.43 Grand Total 100.00 • Top Ten Holdings 0.40 0.88 1.23 1.42 1.66 2.08 2.34 2.92 3.00 3.35 4.38 15.33 16.53 16.65 27.40 0 5 10 15 20 25 30 Finance Cement Ferrous Metals Non - Ferrous Metals Transportation Auto Ancillaries Consumer Non Durables Chemicals Telecom - Equipment & Accessories Auto Power Construction Industrial Capital Goods Construction Project Banks Industry Allocation of Equity Holding (% of Net Assets) ^Past performance may or may not be sustained in the future. Load is not taken into consideration for computation of performance.
  • 15. Intouch mutually July 2017 15 HDFC Balanced Fund (An open-ended balanced scheme) l investment objective To generate capital appreciation along with current income from a combined portfolio of equity & equity related and debt and money market instruments. l Fund Manager ¥ Chirag Setalvad (since April 2, 07) Total Experience - Over 17 years l Inception Date (Date of Allotment) September 11, 2000 NAV (as on July 31, 2017) NAV per Unit (`) Regular Plan - Growth Option 144.004 Regular Plan - Dividend Option 31.685 Direct Plan - Growth Option 149.688 Direct Plan - Dividend Option 34.515 aSSETS UNDER MANAGEMENT (`) IN CRORE As on July 31, 2017 13,824.15 Average for Month of July, 2017 13,207.81 l quantitative data Portfolio Turnover Ratio (Last 1 year) 35.07% Average Maturity * 7.41 years Modified Duration * 4.39 years Yield to Maturity * 7.12% * Computed on the invested amount for debt portfolio. Total Expense Ratio (Weighted Average for the month) Excluding Goods and Service Tax on Management Fees Regular: 1.95% Direct: 0.85% l #BENCHMARKINDEX:CRISILBalancedFund-AggressiveIndex l ##addl. BENCHMARK INDEX: NIFTY 50 Index l Exit Load l In respect of each purchase / switch-in of Units, upto 15% of the units may be redeemed without any exit load from the date of allotment. l Any redemption in excess of the above limit shall be subject to the following exit load: n Exit load of 1.00% is payable if Units are redeemed / switched-out within 1 year from the date of allotment of units. l No Exit Load is payable if Units are redeemed / switched- out after 1 year from the date of allotment. For further details, please refer to para ‘Exit Load’ on Pg 51. l PlanS & Options Regular Plan, Direct Plan. Under Each Plan : Growth & Dividend. The Dividend Option offers Dividend Payout and Reinvestment facility. l Minimum Application Amount Purchase : ` 5,000 and any amount thereafter. Additional Purchase : ` 1,000 and any amount thereafter. l Redemption Proceeds Normally despatched within 3-4 Business Days. ¥ Dedicated Fund Manager for Overseas Investments: Mr Rakesh Vyas (Total Experience - Over 10 years). Face Value per Unit: ` 10 unless otherwise specified, + Industry Classification as recommended by AMFI, Data is as of July 31, 2017 unless otherwise specified. ....Contd on next page This product is suitable for investors who are seeking ~ l Capital appreciation along with current income over long term. l Investmentpredominantlyinequityandequity relatedinstruments with balance exposure to debt and money market instruments. Riskometer Investors understand that their principal will be at moderately high risk ~ Investors should consult their financial advisers if in doubt about whether the product is suitable for them. Portfolio Company Industry+ / Rating % to NAV Equity & Equity Related • HDFC Bank Ltd. Banks 5.28 • Larsen & Toubro Ltd. Construction Project 3.84 • Reliance Industries Ltd. Petroleum Products 3.56 • ITC Ltd. Consumer Non Durables 3.06 • ICICI Bank Ltd. Banks 2.97 • State Bank of India Banks 2.51 • Housing Development Finance Corporation Ltd.£ Finance 2.34 • Tube Investments of India Ltd. Auto Ancillaries 2.31 • Aurobindo Pharma Ltd. Pharmaceuticals 2.07 Power Grid Corporation of India Ltd. Power 1.97 Voltas Ltd. Construction Project 1.96 Infosys Ltd. Software 1.89 Indusind Bank Ltd. Banks 1.65 Aarti Industries Ltd. Chemicals 1.57 Vedanta Ltd. Non - Ferrous Metals 1.45 Tata Steel Ltd. Ferrous Metals 1.40 Federal Bank Ltd. Banks 1.24 KEC International Ltd. Construction Project 1.22 Bharti Airtel Ltd. Telecom - Services 1.14 Bharat Petroleum Corporation Ltd. Petroleum Products 1.05 Hindustan Petroleum Corporation Ltd. Petroleum Products 1.03 Tata Motors Ltd. DVR Auto 1.01 Cholamandalam Investment and Finance Company Ltd. Finance 0.89 SKF India Ltd. Industrial Products 0.89 City Union Bank Ltd. Banks 0.88 Mahindra Holidays & Resorts India Ltd Hotels, Resorts & Other Recreational Activities 0.87 Axis Bank Ltd. Banks 0.83 Redington (India) Limited Transportation 0.77 The Indian Hotels Company Ltd. Hotels, Resorts & Other Recreational Activities 0.76 Balkrishna Industries Ltd. Auto Ancillaries 0.75 Bajaj Finance Ltd. Finance 0.75 PNC Infratech Ltd. Construction 0.75 Hero MotoCorp Ltd. Auto 0.69 Tamil Nadu Newsprint & Papers Ltd. Paper 0.65 Bank of Baroda Banks 0.65 Torrent Pharmaceuticals Ltd. Pharmaceuticals 0.62 VST Industries Ltd. Consumer Non Durables 0.61 MRF Ltd. Auto Ancillaries 0.59 Tata Consultancy Services Ltd. Software 0.56 Oil & Natural Gas Corporation Ltd. Oil 0.51 Greenply Industries Ltd. Consumer Durables 0.48 Kalpataru Power Transmission Ltd. Power 0.48 Avenue Supermarts Ltd. Retailing 0.45 Carborundum Universal Ltd. Industrial Products 0.45 Union Bank of India Banks 0.44 Indian Bank Banks 0.41 Atul Ltd. Chemicals 0.41 Hexaware Technologies Ltd. Software 0.39 Bharat Electronics Ltd. Industrial Capital Goods 0.39 Sadbhav Engineering Ltd. Construction Project 0.37 Zensar Technologies Ltd. Software 0.37 Navneet Education Ltd. Media & Entertainment 0.36 Rallis India Ltd. Pesticides 0.36 Kaveri Seed Company Ltd. Consumer Non Durables 0.33 IPCA Laboratories Ltd. Pharmaceuticals 0.32 NIIT Technologies Ltd. Software 0.31 Insecticides (India) Ltd. Pesticides 0.31 Allahabad Bank Banks 0.18 Atul Auto Ltd. Auto 0.18 Fag Bearings India Ltd. Industrial Products 0.17 J.Kumar Infraprojects Ltd. Construction 0.17 Lupin Ltd. Pharmaceuticals 0.15 MM Forgings Ltd. Industrial Products 0.13 Company Industry+ / Rating % to NAV Persistent Systems Limited Software 0.12 Crompton Greaves Ltd. Industrial Capital Goods 0.03 Sub Total 67.30 Preference Shares Vedanta Ltd. Non - Ferrous Metals 0.12 Sub Total 0.12 Total 67.42 Debt & Debt Related Government Securities 8.13 GOI 2045 Sovereign 1.81 8.24 GOI 2033 Sovereign 1.38 8.20 GOI 2025 Sovereign 1.36 8.32 GOI 2032 Sovereign 1.32 7.16 GOI 2023 Sovereign 1.26 7.35 GOI 2024 Sovereign 1.12 8.08 GOI 2022 Sovereign 1.00 8.15 GOI 2022 Sovereign 0.84 7.88 GOI 2030 Sovereign 0.78 7.73 GOI 2034 Sovereign 0.77 7.72 GOI 2025 Sovereign 0.76 7.68 GOI 2023 Sovereign 0.61 8.17 GOI 2044 Sovereign 0.47 8.83 GOI 2023 Sovereign 0.43 8.97 GOI 2030 Sovereign 0.42 8.40 GOI 2024 Sovereign 0.39 8.60 GOI 2028 Sovereign 0.32 8.35 GOI 2022 Sovereign 0.31 6.35 GOI 2020 Sovereign 0.27 7.80 GOI 2020 Sovereign 0.19 8.12 GOI 2020 Sovereign 0.17 8.30 GOI 2040 Sovereign 0.03 8.20 GOI 2022 Sovereign 0.02 Sub Total 16.03 Credit Exposure • Housing Development Finance Corporation Ltd.£ CRISIL - AAA 2.69 Punjab National Bank CRISIL - AA 0.72 Bank of India CRISIL - A+ 0.72 Cholamandalam Investment and Finance Company Ltd. ICRA - AA 0.56 Shriram Transport Finance Co. Ltd. CRISIL - AA+ 0.55 Tata Sons Ltd. CRISIL - AAA 0.40 State Bank of India CRISIL - AA+, AAA 0.39 Oriental Bank of Commerce ICRA - A, AA- 0.37 HDFC Bank Ltd. CRISIL - AAA 0.37 National Highways Authority of India CRISIL - AAA 0.37 Small Industries Development Bank of India CARE - AAA 0.37 Axis Bank Ltd. CRISIL - AA+ 0.37 L&T Finance Limited CARE - AA+ 0.36 LIC Housing Finance Ltd. CRISIL - AAA 0.26 Power Finance Corporation Ltd. CRISIL - AAA 0.25 Syndicate Bank CARE - AA- 0.23 ICICI Bank Ltd. CARE - AAA 0.18 IDBI Bank Ltd. ICRA - BBB- 0.17 Andhra Bank CARE - AA- 0.15 Vedanta Ltd. CRISIL - AA 0.12 Hindalco Industries Ltd. CRISIL - AA 0.08 Tata Motors Finance Ltd. CRISIL - AA 0.04 Sub Total 9.72 Cash margin / Earmarked cash for Futures & Options 0.87 Cash, Cash Equivalents and Net Current Assets 5.96 Grand Total 100.00 • Top Ten Holdings, £ Co-sponsor Outstanding exposure in derivative instruments (` in Crore) 119.72 Hedged position in Equity & Equity related instruments Outstanding derivative exposure (% age) 0.87 Equity 67.42 G-Sec 16.03 Credit Exposure 9.72 Cash, Cash Equivalents and Net Current Assets 6.83 Equity 67.42 Sovereign 16.03 AAA/AAA(SO)/A1+/A1+(SO) & Equivalent 4.91 AA+ & Below 4.81 Cash, Cash Equivalents and Net Current Assets 6.83 Portfolio Classification by Asset Class (%) Portfolio Classification by Rating Class (%)