This document provides an introduction and overview of the book "Project Management: A Managerial Approach" by Jack R. Meredith and Samuel J. Mantel. It discusses the growing use of project management in business and organizations. It positions the book as taking a managerial perspective on project management rather than a technical or specialized focus. The introduction explains that the book is intended to teach students how to manage projects from a holistic viewpoint.


![32 CHAPTER 1 / PROJECTS IN CONTEMPORARY ORGANIZATIONS
sessions, quick “chats” with other managers that end up investigated, it may no longer exist. Time and again we
taking hours, and so forth. Efficient time management—one have emphasized the importance of planning, but it is also
of the keys to successful project development—starts with apparent that there comes a limit, both to the extent and the
project managers. When they actively plan their days and time frame of the planning cycle. A survey among entrepre-
stick to a time budget, they usually find they are operating neurs, for example, revealed that only 28 percent of them
efficiently. On the other hand, when they take each problem drew up a full-scale plan (Sweet, 1994). A lesson here for
as it comes and function in an ad hoc, reactive mode, they project managers is that, like entrepreneurs, they must plan,
are likely to remain prisoners of their own schedules. but they must also be smart enough to recognize mistakes
A sure recipe for finding the time and resources needed to and change their strategy accordingly. As is noted in an old
get everything done without spending an inordinate amount military slogan, “No plan ever survives its first contact with
of time on the job or construction site is provided by Gosselin the enemy.”
(1993). The author lists six practical suggestions to help proj-
ect managers control their tasks and projects without feeling
constantly behind schedule: Project Managers in the Twenty-First Century
In our research and consulting experiences, we constantly
• Create a realistic time estimate without overextend-
interact with project managers, some with many years of
ing yourself.
experience, who express their frustration with their organi-
• Be absolutely clear about what the boss or client zations because of the lack of detailed explication of their
requires. assigned tasks and responsibilities. Year after year, manager
• Provide for contingencies (schedule slippage, loss of after manager, companies continue to make the same mis-
key team member). takes in “training” their project managers, usually through
• Revise original time estimate and provide a set of an almost ritualized baptism of fire. Project managers
options as required. deserve better. According to Rodney Turner (1993), editor
of the International Journal of Project Management:
• Be clear about factors that are fixed (specifications,
resources, and so on). Through the 90’s and into the 21st century, project-
• Learn to say “Yes, and . . .” rather than “No, but . . .” based management will sweep aside traditional func-
Negotiation is the key. tional line management and (almost) all organizations
will adopt flat, flexible organizational structures in
12. Above all, plan, plan, plan. The essence of efficient place of the old bureaucratic hierarchies . . . [N]ew
project management is to take the time to get it as right as organizational structures are replacing the old . . .
possible the first time. “It” includes the schedule, the team [M]anagers will use project-based management as
composition, the project specifications, and the budget. a vehicle for introducing strategic planning and for
There is a truism that those who fail to plan are planning winning and maintaining competitive advantage.
to fail. One of the practical difficulties with planning is that
so many of us distinguish it from other aspects of the proj- Turner presents quite a rosy future, one that is predicated
ect development, such as doing the work. Top managers are on organizations recognizing the changes they are currently
often particularly guilty of this offense as they wait impa- undergoing and are likely to continue to see in the years
tiently for the project manager to begin doing the work. ahead. In this challenging environment, project management
Of course, too much planning is guaranteed to elicit is emerging as a technique that can provide the competitive
repeated and pointed questions from top management and edge necessary to succeed, given the right manager.
other stakeholders as they seek to discover the reason why At the same time, there seems to have been a sea change
“nothing is being done.” Experienced project managers, in recent years regarding the image of project managers. The
though, know that it is vital not to rush this stage by react- old view of the project manager as essentially that of a deci-
ing too quickly to top management inquiries. The planning sion maker, expert, boss, and director seems to be giving
stage must be managed carefully to allow the project man- way to a newer ideal: that of a leader, coach, and facilitator.
ager and team the time necessary to formulate appropriate Lest the reader assume these duties are any easier, we would
and workable plans that will form the basis for the develop- assert that anyone who has attempted to perform these roles
ment process. Dividing up the tasks and starting the “work” knows from personal experience just how difficult they can
of the project too quickly is often ultimately wasteful. Steps be. As part of this metamorphosis, says Clarke (1993), the
that were poorly done are often steps that must be redone. new breed of project manager must be a natural salesper-
A complete and full investigation of any proposed proj- son who can establish harmonious customer (client) rela-
ect does take significant time and effort. However, bear in tions and develop trusting relationships with stakeholders.
mind that overly elaborate or intricate planning can be det- In addition to some of the obvious keys to project managers’
rimental to a project; by the time an opportunity is fully success—personal commitment, energy, and enthusiasm—it](https://image.slidesharecdn.com/projectmanagement-111021123807-phpapp02/85/Project-management-50-320.jpg)


![2.2 PROJECT SELECTION AND CRITERIA OF CHOICE 41
us to strip away almost all the reality from a problem, leaving only the relevant aspects of the
“real” situation for us to deal with. This process of carving away the unwanted reality from
the bones of a problem is called modeling the problem.
The model represents the problem’s structure, its form. We will use many models in this
book—graphs, analogies, diagrams, as well as flow graph and network models to help solve
scheduling problems, and symbolic (mathematical) models for a number of purposes.
Models may be quite simple to understand, or they may be extremely complex. In general,
introducing more reality into a model tends to make the model more difficult to manipulate.
If the input data for a model are not known precisely, we often use probabilistic information;
that is, the model is said to be stochastic rather than deterministic. Again, in general, stochas-
tic models are more difficult to manipulate. [Readers who are not familiar with the fundamen-
tals of decision making might find a book such as The New Science of Management Decisions
(Simon, 1977) useful. Herbert Simon was a pioneer in the science of decision making and a
Nobel Prize winner.]
We live in the midst of what has been called the “knowledge explosion.” We frequently
hear comments such as “90 percent of all we know about physics has been discovered since
Albert Einstein published his original work on special relativity”; and “80 percent of what we
know about the human body has been discovered in the past 50 years.” In addition, evidence is
cited to show that knowledge is growing exponentially. Such statements emphasize the impor-
tance of the management of change. To survive, firms should develop strategies for assessing
and reassessing the use of their resources. Every allocation of resources is an investment in
the future. Because of the complex nature of most strategies, many of these investments are
in projects.
The proper choice of investment projects is crucial to the long-run survival of every firm.
Daily we witness the results of both good and bad investment choices. In our daily news-
papers we read of Cisco System’s decision to purchase firms that have developed valuable
communication network software rather than to develop its own software. We read of Procter
and Gamble’s decision to invest heavily in marketing its products on the Internet; or prob-
lems faced by school systems when they update student computer labs—should they invest in
Microsoft®-based systems or stick with their traditional choice, Apple®. But can such im-
portant choices be made rationally? Once made, do they ever change, and if so, how? These
questions reflect the need for effective selection models.
Within the limits of their capabilities, such models can be used to increase profits, select
investments competing for limited capital resources, or improve the market position of an
organization. They can be used for ongoing evaluation as well as initial selection, and thus are
a key to the allocation and reallocation of the organization’s scarce resources.
When a firm chooses a project selection model, the following criteria, based on Souder
(1973), are most important.
1. Realism The model should reflect the reality of the firm’s decision situation, especially
the multiple objectives of both the firm and its managers, bearing in mind that without
a common measurement system, direct comparison of different projects is impossible.
The model should also take into account the realities of the firm’s limitations on facilities,
capital, personnel, and so forth, and include factors that reflect project technical and market
risks: performance, cost, time, customer rejection, and implementation.
2. Capability The model should be sophisticated enough to deal with the relevant factors:
multiple time periods, situations both internal and external to the project (e.g., strikes,
interest rate changes), and so on.
3. Flexibility The model should give valid results within the range of conditions that the
firm might experience. It should be easy to modify in response to changes in the firm’s](https://image.slidesharecdn.com/projectmanagement-111021123807-phpapp02/85/Project-management-59-320.jpg)


![58 CHAPTER 2 / STRATEGIC MANAGEMENT AND PROJECT SELECTION
Choosing a Project Selection Model
Selecting the type of model to aid the evaluation/selection process depends on the philosophy
and wishes of management. Liberatore et al. (1983) conducted a survey of 40 high-level
staff persons from 29 Fortune 500 firms. Eighty percent of their respondents report the
use of one or more financial models for R D project decision making. Although their
sample is small and nonrandom, their findings are quite consistent with the present authors’
experience.
We strongly favor weighted scoring models for three fundamental reasons. First, they
allow the multiple objectives of all organizations to be reflected in the important decision
about which projects will be supported and which will be rejected. Second, scoring models
are easily adapted to changes in managerial philosophy or changes in the environment. Third,
they do not suffer from the bias toward the short run that is inherent in profitability models
that discount future cash flows. This is not a prejudice against discounting and most certainly
does not argue against the inclusion of profits/profitability as an important factor in selection,
but rather it is an argument against the exclusion of nonfinancial factors that may require a
longer-run view of the costs and benefits of a project. For a powerful statement of this point,
see Hayes et al. (1980).
It is also interesting to note that Liberatore et al. (1983, p. 969) found that firms with a
significant amount of contract research funded from outside the organization used scoring
models for project screening much more frequently than firms with negligible levels of out-
side funding. It was also found that firms with significant levels of outside funding were much
less likely to use a payback period.
The structure of a weighted scoring model is quite straightforward. Its virtues are many.
Nonetheless, the actual use of scoring models is not as easy as it might seem. Decision mak-
ers are forced to make difficult choices and they are not always comfortable doing so. They
are forced to reduce often vague feelings to quite specific words or numbers. Multiattribute,
multiperson decision making is not simple. [For an interesting discussion of this process, see
Irving et al. (1988).]
2.5 ANALYSIS UNDER UNCERTAINTY — THE MANAGEMENT
OF RISK
During the past several years, increasing attention has been paid to the subject of managing
some of the risks inherent in most projects. The subject first appeared in PMI’s 1987 edition
of A Guide to the Project Management Body of Knowledge (Project Management Institute,
2001), more commonly referred to as PMBOK. As noted earlier, although some PMBOK
knowledge areas, such as Procurement, can largely be treated as standalone issues and dis-
PMBOK Guide
cussed in a single section or chapter, Risk is not one of them. Hence, the topic of risk will be
treated throughout this book wherever it is relevant, which is quite often. Further discussions
of risk will be found in Sections 5.6 and 6.1, and throughout Chapters 10 and 11.
For the most part, risk has been interpreted as being unsure about project task durations
and/or costs, but uncertainty plagues all aspects of the work on projects and is present in all
stages of project life cycles. In this section, we will consider uncertainty as it affects the selec-
tion process. The impact of imperfect knowledge on the way a project is organized and on its
budget and schedule will be discussed in the chapters devoted to those subjects.
Before proceeding, it is useful to discuss briefly the distinction between two words, “risk”
and “uncertainty.” The outcome of any decision depends on two things: (1) what the decision](https://image.slidesharecdn.com/projectmanagement-111021123807-phpapp02/85/Project-management-76-320.jpg)


![96 CHAPTER 2 / STRATEGIC MANAGEMENT AND PROJECT SELECTION
QUESTIONS
1. Strategically, what must Pan-Europa do to keep from
becoming the victim of a hostile takeover? What rows/ • might there be any synergies or conflicts between the
projects?
categories in Exhibit 2 will thus become critically im-
portant in 1993? What should Pan-Europa do now that • do any of the projects have nonquantitative benefits
or costs that should be considered in an evaluation?
they have won the price war? Who should lead the way
for Pan-Europa? 5. Considering all the above, what screens/factors might
you suggest to narrow down the set of most desirable
2. Using NPV, conduct a straight financial analysis of the
projects? What criteria would you use to evaluate the
investment alternatives and rank the projects. Which
projects on these various factors? Do any of the projects
NPV of the three should be used? Why? Suggest a way
fail to pass these screens due to their extreme values on
to evaluate the effluent project.
some of the factors?
3. What aspects of the projects might invalidate the rank-
6. Divide the projects into the four Project Profile Process
ing you just derived? How should we correct for each
categories of incremental, platform, breakthrough, and
investment’s time value of money, unequal lifetimes,
RD. Draw an aggregate project plan and array the
riskiness, and size?
projects on the chart.
4. Reconsider the projects in terms of:
7. Based on all the above, which projects should the
• are any “must do” projects of the nonnumeric type? management committee recommend to the Board of
• what elements of the projects might imply greater or Directors?
lesser riskiness?
The following reading describes the approach Hewlett-Packard uses to select and monitor its projects for rele-
vance to the firm’s strategic goals. The article describes the behavioral aspects of the process as well as many
of the technical tools, such as the aggregate project plan, the plan of record, and the software aids they em-
ployed. In addition, the authors give tips and identify pitfalls in the process so anyone else implementing their
approach will know what problems to watch out for.
D I R E C T E D R E A D I N G
FROM EXPERIENCE: LINKING
PROJECTS TO STRATEGY
R. L. Englund and R. J. Graham
Growth in organizations typically results from successful for their strategic emphasis helps resolve such feelings and
projects that generate new products, services, or procedures. is a corner anchor in putting together the pieces of a puzzle
Managers are increasingly concerned about getting better re- that create an environment for successful projects [6].
sults from the projects under way in their organizations and This article covers a series of steps for linking proj-
in getting better cross-organizational cooperation. One of ects to strategy. These steps constitute a process that can
the most vocal complaints of project managers is that proj- be applied to any endeavor. Included throughout are sug-
ects appear almost randomly. The projects seem unlinked gestions for action as well as guidelines to navigate many
to a coherent strategy, and people are unaware of the total pitfalls along the path. Process tools help illustrate ways to
number and scope of projects. As a result, people feel they prioritize projects. The lessons learned are from consulting
are working at cross-purposes, on too many unneeded proj- with many firms over a long time period and from personal
ects, and on too many projects generally. Selecting projects experiences in applying the lessons within Hewlett-Packard](https://image.slidesharecdn.com/projectmanagement-111021123807-phpapp02/85/Project-management-114-320.jpg)

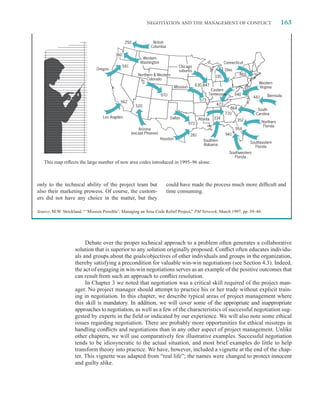
![98 CHAPTER 2 / STRATEGIC MANAGEMENT AND PROJECT SELECTION
explicit commitment from all these people to participate projects on a continuum allows checking for completeness,
actively in the process and to use the resulting plan when gaps, opportunities, and compliance with strategy. This
making related decisions. Be aware that behavioral issues might also be a good time to encourage “out-of-the-box”
become super urgent. This process hits close to home and thinking about new ways to organize the work. Use cre-
may have a severe impact on projects that people care per- ative discussion sessions to capture ideas about core com-
sonally about. Uncertainty and doubt are created if manage- petences, competitive advantage, and the like to determine
ment does not tread carefully and pay attention to people a set of categories most effective for the organization. For
concerns. example, the categories might be:
The team begins by listing all projects proposed and
under way in the organization. Many times this step is a Evolutionary or derivative—sustaining, incremental,
revelation in itself. A usual reaction is, “I didn’t realize enhancing.
we had so many projects going on.” The intent is to sur- Platform—next generation, highly leveraged; and
vey the field of work and begin the organizing effort, so Revolutionary or breakthrough—new core product,
avoid going into detailed discussion about specific projects process, or business.
at this point.
The team clarifies or develops the goals expected from The actual products in Figure 2 were introduced to the
projects. Be careful not to get constrained through consid- market over time in alphabetical order and positioning
ering only current capabilities. Many teams get sidetracked shown. Although the figure represents a retrospective view,
by statements such as “We don’t know how to do that,” ef- it illustrates a successful strategy of sequencing projects and
fectively curtailing discussion on whether the organiza- products. There is a balanced mix of breakthrough products,
tion ought to pursue the goal and develop or acquire the such as A, followed by enhancements, B through E, before
capability. Rather, the discussions at this stage center around moving on to new platforms, F through H, and eventually
organizational purpose, vision, and mission. This is a cru- developing a new architecture and product family with L.
cial step that determines if the rest of the project selection At the time, this strategy was improvisational [1]; it now
process can be successful. In the authors’ experience, those represents a learning opportunity for planning new portfo-
organizations with clear, convincing, and compelling vi- lios. No one area of the grid is overpopulated, and where
sions about what they should be doing move ahead rapidly. large projects exist there are not too many of them.
Any lack of understanding or commitment to the vision by a Another reason to organize projects into these “strategic
member of the team leads to frustration, wheel spinning, and buckets” is to better realize what business(es) the organiza-
eventual disintegration of the whole process. This pattern is tion is in. Almost every group the authors work with get
so prevalent that clarity of the goal or strategy is applied as a caught in the “tyranny of the OR” instead of embracing the
filter before agreeing to facilitate teams through the process. “genius of the AND” [2]. In trying to do too many projects
Organize the projects into categories that will later make and facing the need to make tradeoffs among them, the de-
it easier to facilitate a decision-making process. Wheel- cision becomes this OR that. In reality, most organizations
wright and Clark [14] suggest using grids where the axes need a balanced portfolio that creates complete solutions
are the extent of product change and the extent of process for their customers. They need to do this AND that. The
change. Some organizations use market segments. The way to achieve this goal is to set limits on the size of each
benefit to this effort is that seeing all projects and possible category and then focus efforts on selecting the best set of
Figure 2 Bubble diagram of a product grid for one HP
division. Size of bubble size of project.](https://image.slidesharecdn.com/projectmanagement-111021123807-phpapp02/85/Project-management-116-320.jpg)
![DIRECTED READING 99
projects within each category. The collective set of catego- the success of multiple businesses a 10. Most likely all pro-
ries becomes the desired mix, a way of framing the work of posed projects meet meaningful specifications and provide
the organization. The ideal percentage that constitutes the value to the organization. The task is to develop tough cri-
size of each category can be determined from the collective teria to select the best of the best.
wisdom of the team or perhaps through experimentation. Some organizations use narratives to describe how
The organization can learn the right mix over time but only each project contributes to the vision; others use numeri-
if it makes a concerted effort to do so. cal scores on whether one project is equal, moderate, or
Within each category, determine criteria that can as- strongly better than another. It is also helpful to set thresh-
sess the “goodness”—quality or best fit—of choices for olds or limits for projects that will be considered for the
the plan. A criterion is a standard on which a comparative plan. These help to screen out projects so that later prioriti-
judgment or decision may be based. Because the types of zation efforts can focus on fewer projects.
projects and the objectives within categories may be quite Writing a thorough description of each criterion helps
different, develop unique criteria for each category or have ensure understanding of the intent and expectations of data
a core set of criteria that can be modified. Many teams that must be supplied to fulfill it. One team of three or four
never get to the point of developing or clarifying criteria, people at HP spent 5 days working only on the criteria they
and they usually want to discuss projects before agreeing were to use for decision-making. And this was only the be-
on criteria; reversing the order is much more effective. ginning; they next involved customers in the same discus-
Several works on research and development project se- sion before reaching consensus and beginning to evaluate
lection [8, 9, 12] provide a robust set of criteria for consid- choices. An “Aha” occurred when people found they were
eration. Examples include strategic positioning, probability wrong to assume that everyone meant the same thing by
of success, market size, and availability of staff. Most im- terms such as packaging; some used wider definitions than
portant is to identify the criteria that are of greatest signifi- others did, and the misunderstanding only surfaced through
cance to the organization; fewer are better. However, teams group discussion. Asked if the selection process ever failed
usually need to brainstorm many criteria before focusing the team, its leader replied, “If the results didn’t make sense,
on the few. it was usually because the criteria weren’t well defined.”
The role of each criterion is to help compare projects, Unfortunately, most teams do not exhibit the same patience
not specify them. Select criteria that can measurably com- and discipline that allowed this team to be successful.
pare how projects support the organizational strategy. For Before moving to the next step, the team should estab-
example, one criterion may be degree of impact on HP lish relative importance among criteria. Assign a weight-
business as interpreted by a general manager. On a scaling ing factor for each criterion. All criteria are important but
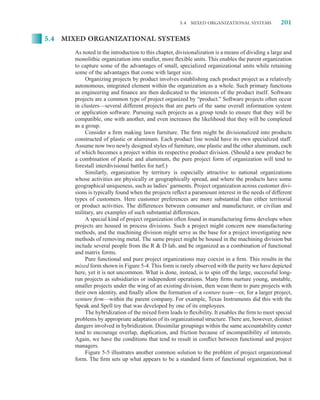
model from 1 to 10, small impact scores a 2, strong a 6, some more so than others. The example in Figure 3 is the
critical to the success of one business an 8, and critical to result of one team’s brainstorming session that ultimately
Customer Satisfaction (28%) Employee Satisfaction (7%)
• Improves service levels • Improves employee knowledge
• Results in more consistent and accurate • Increases employee efficiency or
information/transactions effectiveness
• Helps ensure services are delivered as • Improves work/life balance promised
expected • Positive impact to employee survey
• Helps balance workload
Business Value (46%) Process Effectiveness (19%)
• Achieves results that are critical for a • Enables employees to do things right
specific window of opportunity the first time
• Minimizes risk for implementation and • Increases the use of technology for
ongoing sustainability service delivery
• Improves integration and relationships • Reduces manual work and non-value
with partners added activities
• Provides a positive ROI in 2 yrs • Increases employee self-sufficiency
• Aligns with business goals
Figure 3 Sample criteria and weighting, plus subcriteria, developed by one HP team.](https://image.slidesharecdn.com/projectmanagement-111021123807-phpapp02/85/Project-management-117-320.jpg)
![100 CHAPTER 2 / STRATEGIC MANAGEMENT AND PROJECT SELECTION
led to selecting four criteria. Breakout groups subsequently justified by current business strategies; maybe the projects
defined each criterion with subcriteria. They also devised were conceived based on old paradigms about the business.
scoring methods to apply the criteria. Collectively they then The team can save discussion time by identifying must-do
determined the respective weighting or importance of each projects or ones that require simple go/no-go decisions,
criterion (see the Process Tools section for how they did such as legal, personnel, or environmental projects. These
this). Unlike threshold criteria that “gate” whether a project fall right through the screens and into the allocation pro-
is go or no-go, all projects have to satisfy selection criteria cess. Determine if some projects can be postponed until
to some extent. Weighting of criteria is the technique that others are complete or until new resources or funding be-
can optimize and determine the best of the best. Another come available. Can project deliverables be obtained from
“Aha” that helped teams get through the hurdle to develop a supplier or subcontractor rather than internally? Involve
effective criteria is when they realized the task at this point customers in discussions. The team constantly tests project
is “weighting, not gating.” proposals for alignment with organizational goals.
It is the authors’ experience that criteria, while uni- It is not necessary to constrain the process by using
versally desired, are usually lacking or not formalized. the same criteria across all categories of projects. In fact,
One benefit of effective criteria is the shaping effect it has some teams found that different criteria for each category
on behavior in the organization. When people know how of projects was more effective. Also, consider adjusting
projects will be scored, they tend to shape proposals in pos- the weighting of criteria as projects move through their
itive ways to meet the criteria better. A pitfall is when peo- life cycles. Kumar et al. [7] documented research show-
ple play games to establish criteria that support personal ing that the most significant variable for initial screening
agendas. Then it is up to the leader to identify and question of projects is the extent to which “project objectives fit the
these tactics. Remind people to support the greater good organization’s global corporate philosophy and strategy.”
of the organization. Significant effort could be devoted to Other factors, such as available science and technology,
the behavioral aspects that become relevant when deciding become significant later during the commercial evaluation
upon criteria; suffice to say, be warned that this is a touchy stage. A big “Aha” experienced by some teams when con-
area to approach with sensitivity and persuasiveness. fronted with this data is that they usually did it the other
way around. That explains why they got into trouble—by
What the Organization Can Do. The next step for the focusing on technology or financial factors before deter-
team is to gather data on all projects. Use similar factors mining the link to strategic goals.
when describing each project in order to ease the evalua- Cooper (and others before him) report that top-performing
tion process. Engage people in extensive analysis and de- companies do not use financial methods for portfolio plan-
bate to get agreement on the major characteristics for each ning. Rather, they use strategic portfolio management meth-
project. This is a time to ask basic questions about product ods where strategy decides project selection [3]. This lesson is
and project types and how they contribute to a diversified still a hotly debated one, especially for those who cling to net
set of projects. Reexamine customer needs, future trends, present value as the single most important criterion. The diffi-
commercial opportunities, and new markets. The person culty lies in relying upon forecast numbers that are inherently
consolidating the data should challenge assertions about fictitious. The authors’ experience is that teams get much bet-
benefits and costs instead of accepting assumptions that ter results tapping their collective wisdom about the merits of
may have been put together casually. It is important for each project based upon tangible assessments against strategic
each member of the team to assess the quality of the data, goals. Using computed financial numbers more often leads to
looking closely at sources and the techniques for gathering arguments about computation methods and reliability of the
the data. When putting cost figures together, consider using data, resulting in unproductive team dynamics.
activity-based costing models instead of traditional models The next part of gathering data is to estimate the time
based on parts, direct labor, and overhead. Activity-based and resources required for each potential and existing proj-
costing includes the communications, relationship building, ect. Get the data from past projects, statistical projections,
and indirect labor costs that usually are required to make a or simulations. The HP Project Management Initiative
project successful. particularly stresses in its organizational initiatives to get
The team needs to constantly apply screening criteria to accurate bottom-up project data from work breakdown
reduce the number of projects that will be analyzed in de- structures and schedules. Reconcile this data with top-down
tail. Identify existing projects that can be canceled, down- project goals. Document assumptions so that resource re-
scaled, or reconceived because their resource consumption quirements can be revisited if there are changes to the basis
exceeds initial expectations, costs of materials are higher for an assumption. For new or unknown projects, make a
than expected, or a competitive entry to the market changed best estimate, focusing first on the investigation phase with
the rules of the game. The screening process helps elimi- the intent to fund only enough work to determine feasibil-
nate projects that require extensive resources but are not ity. The team can revisit the estimates when more infor-](https://image.slidesharecdn.com/projectmanagement-111021123807-phpapp02/85/Project-management-118-320.jpg)

![102 CHAPTER 2 / STRATEGIC MANAGEMENT AND PROJECT SELECTION
Finally, the team is ready to decide which projects Project managers at HP describe one benefit of the POR
to pursue. Be prepared to do fewer projects and to com- process as identifying gaps between required and actual
mit complete resources required by projects that are resources. For flexible changes, the process gets all people
selected. Decide on a mix of projects consistent with into the communications loop. If people want to add some-
business strategy, such as 50% platform projects, 20% thing, the management team has to decide what should be
derivative projects, 10% breakthrough projects, and deleted. The process helps two divisions that work together
10% partnerships. Note that these total only 90%; tak- agree on one prioritized list instead of two. They utilize di-
ing some lessons from financial portfolio management, rect electronic connections for bottom-up entry of projects
diversify the set of projects by investing in some specu- and resources by all project managers into a centralized
lative projects. The team may not be sure which markets administration point.
or technologies will grow, so buy an “option” and make
a small investment to investigate the possibilities. In- Implement the Plan. No job is complete until it is acted
clude experimental projects. It is also important to leave upon. The team needs to “evangelize” all others in the orga-
a small percent of development capacity uncommitted nization to use the aggregate project plan or POR to guide
to take advantage of unexpected opportunities and to people who plan work, make decisions, and execute projects.
deal with crises when they arise. Although it may be countercultural to do so, do not starve
Wheelwright and Clark [14] cite an organization that committed projects of the resources they need. The team or the
reduced the number of its development projects from 30 responsible upper managers need to enforce the plan by fully
to 11: “The changes led to some impressive gains . . . as staffing committed projects; that now becomes possible be-
commercial development productivity improved by a factor cause fewer projects are happening simultaneously. Also, use
of three. Fewer products meant more actual work got done, the plan to identify opportunities for leverage across projects
and more work meant more products.” Addressing an inter- or for process reengineering. Match people skills to project
nal project management conference, an HP Executive Vice categories to tap their strengths and areas for contribution.
President emphasized the need to focus on doing fewer proj- The team or a program management office needs to
ects, especially those that are large and complex: “We have maintain the plan in a central place, such as a project office
to be very selective. You can manage cross-organizational or online. Make it known to, and accessible by, all people
complex programs if you don’t have very many. If you have in the organization doing projects, subject to confidentiality
a lot of them with our culture, it just won’t work. First of all, requirements. All the work to this point may go for naught
we need to pick those opportunities very, very selectively. We if the process, the steps, and the results are not widely com-
need to then manage them aggressively across the company. municated.
That means have joint teams work together, strong project The same people who develop the plan are also the ones
management and leadership, constant reviews, a frame- who can best update it periodically, perhaps quarterly or
work, a vision, a strong owner—all those things that make as changes occur. Use tools such as an online shared da-
a program and project successful.” Subsequently, a number tabase to gather data directly from project managers about
of organizations sought help from the HP Project Manage- resources needed for each project. This system can be used
ment Initiative to systematically reduce 120 projects down both to gather data when developing the plan and to update
to 30. Another organization went from 50 projects down it. View the plan as a “living document” that accurately re-
to 17. It appears counter-intuitive, but by prioritizing and flects current realities.
more carefully selecting projects, organizations actually The challenge for HP and many companies is to “mas-
get more projects completed. ter both adaptive innovation and consistent execution . . .
Figure 5 illustrates a document that captures the out- again and again and again . . . in the context of relentless
put of this process. Record projects that are fully funded change. . . . Staying on top means remaining poised on
in an aggregate project plan (in-plan). In a separate section the edges of chaos and time . . . These edges are places of
or another document, list projects for future consideration adaptive behavior. They are also unstable. This instability
(out-plan); also capture and communicate reasons for de- means that managers have to work at staying on the edge”
laying or not funding projects. The plan of record (POR) is [1]. The advice is clear: the plan is indispensable as a stra-
both a process and a tool used by some organizations at HP tegic guideline, but don’t fall in love with it! Be prepared
to keep track of the total list of projects. It lists all projects to adapt it and to communicate the changes.
under way or under consideration by the entity. If a project
is funded and has resources assigned, it has achieved in- Process Tools
plan status. Projects below the cutoff line of available re- One tool that can assist in the decision-making process is
sources or that have not yet achieved priority status are on the AHP [10]. Because of the interactions among many
the out-plan. The figure also categorizes the projects and factors affecting a complex decision, it is essential to iden-
specifies the desired mix. tify the important factors and the degree that they affect](https://image.slidesharecdn.com/projectmanagement-111021123807-phpapp02/85/Project-management-120-320.jpg)

![104 CHAPTER 2 / STRATEGIC MANAGEMENT AND PROJECT SELECTION
each other before a clear decision can be made. The AHP computations. As an alternative, a spreadsheet could be
helps structure a complex situation, identify its criteria and constructed to normalize the numbers.
other intangible or concrete factors, measure the interac- This process appears complex and analytical but is
tions among them in a simple way, and synthesize all the easy when the software handles the computations, and the
information to obtain priorities. The priorities then can be management team concentrates on the comparisons. It is
used in a benefit-to-cost determination to decide which thorough in guiding the team to consider all criteria, both
projects to select. The AHP organizes feelings and intuition emotional and logical, and to apply them to all projects.
alongside logic in a structured approach to decision- One team rejected the process as too analytical, so be aware
making—helpful in complex situations where it is difficult that it does not work for everyone.
to comprehend multiple variables together. An individual The key benefit in doing this process is the improved
or team focuses on one criterion at a time and applies it quality of dialogue that occurs among the management
step by step across alternatives. A number of sites across team members. In facilitating a number of teams at HP
HP find value in using AHP. through this process, each one achieved far more progress
In another example, a team got together to choose than they thought possible. People admit that they become
among a set of services they will offer to customers. More addicted to the AHP process. They immediately buy the
choices were available than the organization had capacity software. The systematic approach is feasible whether se-
to support. After defining organizational strategy or prod- lecting products for a product line, projects that comprise
uct goals, the first task was to identify which criteria to a portfolio, or the best supplier or candidate for a job. In
enter into the decision-making process. After give-and-take reality, the discussions are more valuable than the analysis.
discussion, they decided that the criteria were customer The process in this case provides the discipline that makes
satisfaction, business value, process effectiveness, and em- the dialogue happen.
ployee satisfaction. Frame [5] offers an alternative “poor man’s hierarchy.”
Next, the criteria were ranked according to priority by He puts selection criteria along the side as well as across
making pairwise comparisons between them. Which is the top of a grid. If the criterion on the side is preferred to
the more desirable criterion and by how much, customer the one on the top, put a 1 in the cell. If the criterion on top
satisfaction or business value? Process effectiveness or is preferred, put a 0 in the cell. Diagonals are blanked out
employee satisfaction? Business value or process effective- where criteria would be compared to themselves. Below
ness? These questions were asked about all possible pairs. the diagonal, put the opposite value from corresponding
Each potential project or service then was scored under- cells above the diagonal. Then add up the numbers across
neath each criterion, and decisions were made about which the rows to get total scores, which provide a rank order.
projects to include in the portfolio, based upon existing One team at HP modified this process to replace the 1s and
resources. This team went on to create a POR similar to 0s with an actual count of how 18 people voted in each
Figure 5. pairwise comparison of alternatives. Again, they added up
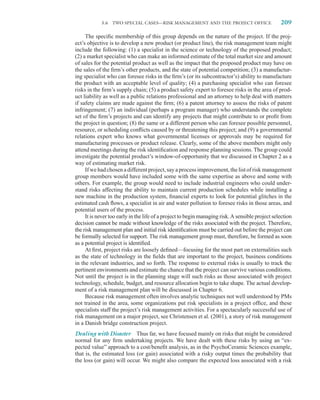
A detailed explanation for computing the priority scores the rows and normalized the results for a priority order and
and the final rank ordering list can be quite complex, in- weighted ranking (Figure 6).
volving eigenvalues and eigenvectors, so it is much easier This simplified hierarchy is especially helpful for
to get a software package (Expert Choice [4]) that does the weighting criteria. It can be used for prioritizing projects
Total
Business Customer Technology Employee Votes %
Business *** 16 16 18 50 46
Customer 2 *** 13 15 30 28
Technology 2 5 *** 14 21 19
Employee 0 3 4 *** 7 7
Figure 6 A simplified hierarchy used by one HP team to weight criteria.](https://image.slidesharecdn.com/projectmanagement-111021123807-phpapp02/85/Project-management-122-320.jpg)
![DIRECTED READING 105
when applied to one criterion at a time. It becomes bulky When the effort appears too massive, one approach is to
and less useful when applied to multiple projects over mul- go after the low-hanging fruit. Start with one of the more
tiple criteria. pressing issues and use the general concepts of this model
to address it. Still have a vision for what the organization
Barriers to Implementation ultimately can achieve but understand that patience and
pacing are necessary to get there. Consider also that this
Now for a reality check. The model depicted in this article process is hierarchical—it can be applied singularly or col-
is thorough, and it integrates objective and subjective data. lectively, up or down the organization.
When all is said and done, however, people may throw out For people who get frustrated when all linkages are not
the results and make a different decision. Sometimes the present, the authors urge teams and individuals to “just do
reason is a hunch, an instinct, or simply a desire to try some- it.” Small changes in initial conditions have enormous con-
thing different. Sometimes people have a pet project and sequences. Eventually successes or small wins are noticed.
use the process to justify its existence, or a hidden agenda The practices start to permeate an organization. This can
may be at play—perhaps the need to maneuver among col- happen in the middle, move up, and then over to other orga-
leagues, trading projects for favors. Politics at this stage nizations. Incidentally, a corporate group like HP’s Project
cannot be ignored, nor are they likely to disappear. It is im- Management Initiative helps facilitate this transformation.
perative for leaders to become skilled in the political process. We do this by acting as a conduit for success stories and
Any attempt at leading change in how an organization links best practices.
projects to strategy is bound to meet resistance. The concept Over the long run, we believe that organizations that
receives almost unanimous intellectual support. Implement- follow a process similar to the one described increase their
ing it into the heart and soul of all people in the organization odds for greater success. This happens because teams of
is another story. It goes against the cultural norms in many people following a systematic process and using convinc-
organizations and conjures up all kinds of resistance if the ing data to support their arguments more often produce
values it espouses are not the norm in that organization. The better results than individuals. Their projects have more
path is full of pitfalls, especially if information is presented visibility, and the quality of dialogue and decision-making
carelessly or perceived as final when it is work in process. improve. The power of using criteria that are tightly linked
Some people resist because the process is too analyti- with strategy and known by everyone in the organization is
cal. Some want decision-making to be purely interactive, the mitigating effect it has to guide behavior in constructive
intuitive, or the purview of a few people. A complete pro- ways. Having a process means it can be replicated and im-
cess cannot be forced upon people if the organization has proved over time until it is optimized. It also means other
more immediate concerns or unresolved issues. Resistance people can learn the process and coach others, thereby cre-
occurs when there is no strategy, the strategy is unclear, or ating a learning organization.
people are uncomfortable with the strategy. Work on the
process may come to a standstill when people realize how
much work is involved to fully link projects to strategy. If References
the pain is not great enough with the status quo, people are
1. Brown, S. L., and K. M. Eisenhardt. Competing on
not going to be ready to change.
the Edge: Strategy as Structured Chaos. Boston: Har-
And if people sense that the leader does not authentically
vard Business School Press, 1998.
believe in the elements, such as the goals, the process, or the
tools, they are hesitant to follow with any enthusiasm. When 2. Collins, J. C. and J. I. Porras. Built to Last: Success-
the leader lacks integrity and exhibits incongruity between ful Habits of Visionary Companies. New York: Harper-
words and actions, people may go through the motions but Collins, 1994.
do not exert an effort that achieves meaningful results. 3. Cooper, R. G., S. J. Edgett, and E. J. Kleinschmidt.
Portfolio Management for New Products. Reading,
Enablers for Effective Implementation MA: Addison-Wesley, 1998.
4. “Expert Choice,” Pittsburgh, PA: Expert Choice Inc.
It is possible to lead people through this change process if
(see www.expertchoice.com).
the leader asks many questions, listens to the concerns of
all people involved, and seeks to build support so that peo- 5. Frame, J. D. The New Project Management: Tools for
ple feel they have an active role in developing the process an Age of Rapid Change, Corporate Reengineering,
[9]. A flexible process works better than a rigid one. Cul- and Other Business Realities. San Francisco: Jossey-
tivate “champions” who have the credibility and fortitude Bass Publishers, 1994.
to carry the process across the organization. Believe that 6. Graham, Robert J. and Randall L. Englund. Cre-
change is possible. ating an Environment for Successful Projects: The](https://image.slidesharecdn.com/projectmanagement-111021123807-phpapp02/85/Project-management-123-320.jpg)


![DIRECTED READING 157
QUESTIONS
1. What is the project Mr. Rutland is trying to manage? Has 6. What should Mr. Rutland do? Include the following
it stayed the same? issues:
2. Identify the various stakeholders in the project, includ-
• Budget: acquiring adequate resources
– philanthropic organizations
ing the competition. – governmental agencies
– donations
3. Of the skills mentioned in the chapter that a project man-
– memberships
ager needs, which are most important here? Why?
– visitors
4. What credibility does Mr. Rutland have? Is he a leader? • Budget: expenditures (consider Paramount theatre)
• Performance: services/activities to offer
5. What cultures are relevant to this project? Describe the • Competition
project environment. • Schedule: deadlines, windows, milestones
The following reading integrates two views about the requirements for good project managers. One view concerns the per-
sonal and managerial characteristics of PMs and their ability to lead a team, regardless of the project. The other view consid-
ers the critical problems in the project in question and the PM’s talents relative to these problems. A survey is first described
and then the critical problems that projects face are identified from the survey responses. Next, the skills required of project
managers, as indicated by the survey respondents, are detailed. Last, the skills are related back to the critical project problems
for an integrated view of the requirements for a successful project manager.
D I R E C T E D R E A D I N G
WHAT IT TAKES TO BE
A GOOD PROJECT MANAGER
B. Z. Posner
Selecting a good project manager is not a simple task. However, Daniel Roman [2] maintains that it would
Being an effective project manager is an ongoing challenge. take an extraordinary individual to have all of these criti-
The complex nature and multifaceted range of activities cal personal characteristics. A more practical solution, he
involved in managing projects precludes easily identifying suggests, would be to determine the critical problems faced
managerial talent and continually stretches the capabilities by project managers and to select a person who can handle
of talented project managers. Two seemingly contradictory such difficulties. The shortcoming with this second per-
viewpoints have been advanced about what is required to be spective, argue those like Michael Badaway [3], is that the
a good project manager. primary problems of project managers are really not techni-
One perspective prescribes a set of personal charac- cal ones. The reason managers fail at managing projects,
teristics necessary to manage a project [1]. Such personal he contends, is because they lack critical organization and
attributes include aggressiveness, confidence, poise, deci- management skills.
siveness, resolution, entrepreneurship, toughness, integrity, Scholars like Roman and Badaway—as well as
versatility, multidisciplinarity, and quick thinking. practitioners—may actually be raising different issues. On
the one hand, good project managers understand the critical
problems which face them and are prepared to deal with
them. On the other hand, managing projects well requires
“What It Takes to Be A Good Project Manager.” Project Manage- a set of particular attributes and skills. But, are these two
ment Journal, March 1987. ©1987 by the Project Management Insti- viewpoints really at odds with one another? In this study
tute. Reprinted by permission. they were discovered to be two sides of the same coin!](https://image.slidesharecdn.com/projectmanagement-111021123807-phpapp02/85/Project-management-175-320.jpg)
![158 CHAPTER 3 / THE PROJECT MANAGER
Study of Project Manager Problems and Skills about as often as the general inadequate resource lament.
Typically, the problem of time was expressed as “having to
Questionnaires were completed by project managers during meet unrealistic deadlines.”
a nationwide series of project management seminars. Proj- That resources are inadequate is caused by many factors,
ect managers attending these seminars came from a variety not the least of which being that resources are generally lim-
of technology-oriented organizations. Responses to the sur- ited and costly. Before this hue is dismissed by veteran proj-
vey instrument were both voluntary and confidential. ect managers as just so much bellyaching—”after all, there
Information about the respondents and the nature of their are never enough resources to go around”—it is impor-
projects was collected. The typical project manager was a tant to examine the cause(s) of this problem. Respondents
37-year-old male, had nine people reporting to him, and pointed out that resource allocation problems were usually
was responsible for a small to moderate size project within created by senior management’s failure to be clear about
a matrix organization structure. More specifically, there project objectives, which in turn resulted in poor planning
were 189 men and 98 women in the sample (N 287) and efforts. These two problems—lack of clear goals and effec-
their ages ranged from 22 to 60 years of age (X 37.4, tive planning—were specifically mentioned by more than
S.D. 8.3). Fifty-six percent indicated that they were the for- 60 percent of the respondents. It is painfully obvious that
mal manager of the project. The size of their immediate proj- vague goals and insufficient planning lead to mistakes in
ect group ranged from 2 to over 100 people (median 8.9). allocating the resources needed by project managers.
Fifty-nine percent reported that they worked primarily on
small projects (involving few people or functions, with a
short time horizon) as compared to large projects (involving Table 1. Project Management Problems
many people or functions, with a long time horizon). More 1. Resources inadequate (69)
than 63 percent indicated they were working within a matrix 2. Meeting (“unrealistic”) deadlines (67)
organization structure. No information was collected about 3. Unclear goals/direction (63)
the specific nature (e.g., new product development, R D, 4. Team members uncommitted (59)
MIS) of their projects. 5. Insufficient planning (56)
Two open-ended questions were asked (their order was 6. Breakdown of communications (54)
randomized). The first asked about the skills necessary 7. Changes in goals and resources (42)
to be a successful project manager. The second question 8. Conflicts between departments or functions (35)
investigated the most likely problems encountered in man-
Note: Numbers in parentheses represent percentage of project
aging projects. Responses to these questions were content
managers whose response was included in this cluster.
analyzed. Content analysis is a systematic approach to
data analysis, resulting in both qualitative assessments and The three most significant problems reported by first-
quantitative information. Each respondent comment was line research, development, and engineering supervisors
first coded and then recoded several times as patterns of in Lauren Hitchcock’s [4] study parallels those identified
responses became apparent. The two questions were: by project managers. He found “insufficient definition of
policy from top downward, how to define the goal of a prob-
1. What factors or variables are most likely to cause you
lem, and budgeting and manpower assignments” to be the
problems in managing a project?
major problems confronting supervisors. It remains true
2. What personal characteristics, traits, or skills make for that senior management needs to articulate clearly where
“above average” project managers? What specific behav- the project should be going, why, and what it expects from
iors, techniques, or strategies do “above average” project project personnel.
managers use (or use better than their peers)? When project goals are not clear, it is difficult (if not
impossible) to plan the project efficiently. The lack of plan-
Problems in Managing Projects. There were nearly ning contributes directly to unrealistic resource allocations
900 statements about what factors or variables created and schedules. People assigned to the project are unlikely,
“problems” in managing a project. Most of these state- therefore, to commit energetically to the endeavor. The lack
ments could be clustered into eight categories as shown in of commitment (and poor motivation) among project person-
Table 1. Inadequate resources was the issue most frequently nel was reported as emerging more from the problems already
mentioned as causing problems in managing a project. “No mentioned than from issues associated with the project’s tech-
matter what the type or scope of your project,” wrote one nology or organizational structure (e.g., matrix form).
engineering manager, “if insufficient resources are allocated The communication breakdowns (problems which occur
to the project, you have to be a magician to be successful.” during the life of a project) were often referred to as “inevi-
Not having the necessary budget or personnel for the project table.” These breakdowns occur as a result of the ambigu-
was a frequent complaint. However, the specific resource of ity surrounding the project, but also result from difficulties
time—and generally the lack thereof—was mentioned just in coordinating and integrating diverse perspectives and](https://image.slidesharecdn.com/projectmanagement-111021123807-phpapp02/85/Project-management-176-320.jpg)


![164 CHAPTER 4 / NEGOTIATION AND THE MANAGEMENT OF CONFLICT
4.1 THE NATURE OF NEGOTIATION
The favored technique for resolving conflict is negotiation. What is negotiation? Wall (1985,
preface) defines negotiation as “the process through which two or more parties seek an accept-
able rate of exchange for items they own or control.” Dissatisfied with this definition, he spends
part of a chapter extending and discussing the concept (Chapter 1), without a great deal of
improvement. Cohen (1980, p. 15) says that “Negotiation is a field of knowledge and endeavor
that focuses on gaining the favor of people from whom we want things.” Other authors define
negotiation differently, but do not appreciably extend Cohen’s definition. Even if no single
definition neatly fits all the activities we label “negotiation,” we do recognize that such terms as
“mediate,” “conciliate,” “make peace,” “bring to agreement,” “settle differences,” “moderate,”
“arbitrate,” “adjust differences,” “compromise,” “bargain,” “dicker,” and “haggle” (Roget’s
International Thesaurus, 1993) are synonyms for “ negotiate” in some instances.
Most of the conflicts that involve the organization and outsiders have to do with property
rights and contractual obligations. In these cases, the parties to negotiation see themselves as
opponents. Conflicts arising inside the organization may also appear to involve property rights
and obligations, but they typically differ from conflicts with outsiders in one important way:
As far as the firm is concerned, they are conflicts between allies, not opponents. Wall (1985,
pp. 149–150) makes this point neatly:
Organizations, like groups, consist of interdependent parts that have their own values,
interests, perceptions, and goals. Each unit seeks to fulfill its particular goal . . . and
the effectiveness of the organization depends on the success of each unit’s fulfillment
of its specialized task. Just as important as the fulfillment of the separate tasks is the
integration of the unit activities such that each unit’s activities aid or at least do not
conflict with those of the others.
One of the ways in which organizations facilitate this integration is to establish “lateral rela-
tions [which] allow decisions to be made horizontally across lines of authority” (Wall, 1985,
p. 150). Because each unit will have its own goals, integrating the activities of two or more
units is certain to produce the conflicts that Wall says should not take place. The conflicts
may, however, be resolved by negotiating a solution, if one exists, that produces gains (or
minimizes losses) for all parties. Raiffa (1982, p. 139) defines a Pareto-optimal solution to
the two-party conflict and discusses the nature of the bargaining process required to reach
optimality, a difficult and time-consuming process. While it is not likely that the conflicting
parties will know and understand the complex trade-offs in a real-world, project management,
many-persons/many-issues conflict (see Raiffa, 1982, Chapters 17–23), the general objective
is to find a solution such that no party can be made better off without making another party
worse off by the same amount or more—i.e., a Pareto-optimal solution.
The concept of a Pareto-optimal solution is important. Approaching intraproject conflicts
with a desire to win a victory over other parties is inappropriate. The PM must remember that
she will be negotiating with project stakeholders many times in the future. If she conducts a
win-lose negotiation and the other party loses, from then on she will face a determined adver-
sary who seeks to defeat her. This is not helpful. The proper outcome of this type of negotia-
tion should be to optimize the outcome in terms of overall organizational goals. Although it is
not always obvious how to do this, negotiation is clearly the correct approach.
During the negotiation process, an ethical situation often arises that is worth mentioning.
Consider the situation where a firm requests an outside contractor to develop a software pack-
age to achieve some function. When the firm asks for a specific objective to be accomplished,
it frequently does not know if that is a major job or a trivial task because it lacks technical
competence in that area. Thus, the contractor has the opportunity to misrepresent the task to](https://image.slidesharecdn.com/projectmanagement-111021123807-phpapp02/85/Project-management-182-320.jpg)


![174 CHAPTER 4 / NEGOTIATION AND THE MANAGEMENT OF CONFLICT
The more complex the project, the more difficult it is to trace and estimate the impact of
all the delays, and the more resources that must be consumed to get things back on schedule.
Throughout this book we have referred to the PM’s job of managing time/cost/performance
trade-offs. Maintaining the project schedule is precisely an exercise in managing trade-offs, but
adding to the project’s cost or scaling down the project’s technical capabilities in order to save
time are trade-offs the PM will not take if there is any viable alternative. The PM’s ability to
make trade-offs is often constrained by contract, company policy, and ethical considerations.
In reality, trade-off decisions are extremely difficult.
Like schedule conflicts, technical conflicts are frequent and serious during the main pro-
gram stage. Also like schedule conflicts, the source of technical conflict is somewhat different
than in earlier stages. Just as a computer and a printer must be correctly linked together in
order to perform properly, so must the many parts of a project. These linkages are known as
interfaces. The number of interfaces increases rapidly as the project gets larger, which is to
say that the system gets more complex. As the number of interfaces increases, so does the
probability that problems will arise at the interfaces. The need to manage these interfaces and
to correct incompatibilities is the key to the technical conflicts in the main program phase.
Project Phase-out
As in the main program stage, schedule is the major source of conflict during project phase-
out. If schedule slippage has occurred in the main program stage (and it probably has), the
consequences will surely be felt in this final stage. During phase-out, projects with firm dead-
lines develop an environment best described as hectic. The PM, project team, and functional
groups often band together to do what is necessary to complete the project on time and to
specification. Cost overruns, if not outrageously high, are tolerated—though they may not be
forgiven and they will certainly be remembered.
Technical problems are comparatively rare during phase-out because most have been solved
or bypassed earlier. Similarly, working interfaces have been developed and put in place. If the
project involves implementing a technology in an outside client’s system, technical conflicts will
probably arise, but they are usually less intense.
Thamhain et al. (1975b, p. 41) note that personality conflicts are the second-ranked source
of conflict during phase-out. They ascribe these conflicts to interpersonal stress caused by the
pressure to complete the project, and to individuals’ natural anxiety about leaving the proj-
ect either to be assigned to another, or be returned to a functional unit. In addition, we have
observed conflict, sometimes quite bitter, focused on the distribution of the project’s capital
equipment and supplies when the project is completed. Conflict also arises between projects
phasing out and those just starting, particularly if the latter need resources or personnel with
scarce talents being used by the former.
The way in which Thamhain et al. have defined conflict as having its source in differences
about goals/expectations, uncertainty about authority, and interpersonal problems, precludes
identifying conflict as occurring between discipline-oriented and problem-oriented team
members. Recall our discussions of Hughes (1998) and de Laat (1994). We do not argue that
Thamhain et al. are in error, but merely that their classification does not specifically include a
type of conflict we feel is both frequent and important. Much of the conflict identified during
our discussion of planning in Chapter 6, it seems to us, is due to discipline/problem-orientation
differences. A clear example comes from an interview recorded during Pelled et al.’s (1994,
p. 23) research on conflict in multifunctional design teams. One team member speaking of
another said, “He will do whatever he thinks is right to get his [own] job done, whether or
not it’s good for [the company] or anyone else.” In context, it is clear that this conflict was
between a problem-oriented individual and one who was discipline oriented.](https://image.slidesharecdn.com/projectmanagement-111021123807-phpapp02/85/Project-management-192-320.jpg)


![208 CHAPTER 5 / THE PROJECT IN THE ORGANIZATIONAL STRUCTURE
the future. Unfortunately, the literature of project risk management rarely mentions the value
of system memory. (An exception to this generalization is Royer (2000) and the latest version
PMBOK Guide of PMBOK.)
The identification of potentially serious risks can be done in a number of ways, but the
following method is straightforward and extensively used, particularly in engineering analysis.
Risk Identification through Failure Mode and Effect Analysis (FMEA) FMEA (Stama-
tis, 2003) is the application of a scoring model such as those used for project selection in
Chapter 2. It is easily applied to risk by using six steps.
1. List possible ways a project might fail.
2. Evaluate the severity (S) of the consequences of each type of failure on a 10-point scale
where “1” is “no effect” and “10” is “very severe.”
3. For each cause of failure, estimate the likelihood (L) of its occurrence on a 10-point scale
where “1” is “remote” and 10 is “almost certain.”
4. Estimate the ability to detect (D) a failure associated with each cause. Using a 10 point scale,
“1” means detectability is almost certain using normal monitoring/control systems and “10”
means it is practically certain that failure will not be detected in time to avoid or mitigate it.
5. Find the Risk Priority Number (RPN) where RPN S L D.
6. Consider ways to reduce the S, L, and D for each cause of failure with a significantly
high RPN.
An Added Note on Risk Identification The risks faced by a project are dependent on
the technological nature of the project, as well as on the many environments in which the
project exists. [Recall that we use the word “environment” to refer to anything outside a sys-
tem (the project) that can affect or be affected by the system.] Indeed, the manner in which
the process of risk management is conducted depends on how one or more environments
impact the project. The corporate culture is one such environment. So consider, for instance,
the impact of a strong corporate “cost-cutting” emphasis on how risk managers identify and
deal with risks in the areas of personnel and resource allocation. Note that this refers to the
process of risk management—carrying out the six or seven subprocesses—not merely to the
identification of risks.
The need to consider the many environments of almost any project is clear when one
examines the recent articles on risk management. It is typical to consider only the internal
environment of the project, e.g., the technical and interpersonal risks, and occasionally, nega-
tive market risks for the project. Articles on risks in IT and software projects rarely go beyond
such matters—Jiang et al. (2001) is an example. This is a thoughtful development of a model
for generating numerical measures for IT project risks. The specific user of the IT and the
institutional setting of the project are considered, but competitors, the IT market, user indus-
tries, the legal environment, and several other relevant environments are ignored.
Organizing for Risk Management The mere existence of a set of activities that must be
undertaken in order to manage risk implies that some sort of organization is required to do
the work of risk management. Because any individual firm might undertake a wide variety of
projects based on different technologies, developed for different markets, subject to potential
regulation by different levels of government, and with different stakeholders, no single risk
management unit can be expected to deal with all projects. Routine machine repair and
maintenance projects (if they are similar in size and scope to one another) might have one
risk management group for all such projects. In general, however, a unique risk management
group is formed for each project.](https://image.slidesharecdn.com/projectmanagement-111021123807-phpapp02/85/Project-management-226-320.jpg)


![C H A P T E R
6
Project Activity Planning
This chapter initiates our discussions of Time and Quality Management, PMBOK knowledge
areas 3 and 5, respectively. Time management is an extensive topic which is further discussed
PMBOK Guide
in Chapters 8, 10, and 11. Quality management will also be discussed further in Chapter 12.
In the Reader’s Digest (March 1998, p. 49) Peter Drucker is quoted on planning: “Plans
are only good intentions unless they immediately degenerate into hard work.” To make such
a transformation possible is no easy task. Inadequate planning is a cliché in project manage-
ment. Occasionally, articles appear in project management periodicals attesting to the value
of good planning. Project managers pay little attention. PMs say, or are told, that planning
“takes too much time,” “customers don’t know what they want,” “if we commit we will be
held accountable,” and a number of similar weak excuses (Bigelow, 1998, p. 15). Tom Peters,
well-known seeker of business excellence, was quoted in the Cincinnati Post: “Businesses
[believe] a lot of dumb things. . . . The more time you spend planning, the less time you’ll need
to spend on implementation. Almost never the case! Ready. Fire. Aim. That’s the approach
taken by businesses I most respect.” We strongly disagree and, as we will report below (and
in Chapter 13), there is a great deal of research supporting the view that careful planning is
solidly associated with project success—and none, to our knowledge, supporting the opposite
position. On the other hand, sensible planners do not kill the plan with overanalysis. This
leads to a well-known “paralysis by analysis.” In an excellent article, Langley (1995) finds a
path inbetween the two extremes.
Thus far, we have dealt with initiating a project. Now we are ready to begin the process
of planning the work of the project in such a way that it may be translated into “hard work”
that actually leads to a successful completion of the project. There are several reasons why
we must use considerable care when planning projects. The primary purpose of planning, of
course, is to establish a set of directions in sufficient detail to tell the project team exactly what
must be done, when it must be done, what resources will be required to produce the deliver-
ables of the project successfully, and when each resource will be needed.
As we noted in Chapter 1, the deliverables (or scope, or specifications, or objectives)
of a project are more than mere descriptions of the goods and/or services we promise to
deliver to the client at a quality level that will meet client expectations. The scope of a project
also includes the time and cost required to complete the project to the client’s satisfaction.
239](https://image.slidesharecdn.com/projectmanagement-111021123807-phpapp02/85/Project-management-257-320.jpg)


![6.5 INTERFACE COORDINATION THROUGH INTEGRATION MANAGEMENT 267
6.5 INTERFACE COORDINATION THROUGH INTEGRATION
MANAGEMENT
This section covers the PMBOK knowledge area 1 concerning Project Integration Manage-
ment. Unlike the more extensive knowledge areas such as Risk, or Communication, this topic
PMBOK Guide
can be treated in a standalone fashion in this single section.
The most difficult aspect of implementing the plan for a complex project is the coor-
dination and integration of the various elements of the project so that they meet their joint
goals of performance, schedule, and budget in such a way that the total project meets
its goals.
As projects become more complex, drawing on knowledge and skills from more areas of
expertise—and, thus, more subunits of the parent organization as well as more outsiders—the
problem of coordinating multidisciplinary teams (MTs) becomes more troublesome. At the
same time, and as a result, uncertainty is increased. As the project proceeds from its initiation
through the planning and into the actual process of trying to generate the project’s deliver-
ables, still more problems arise. One hears, “Why didn’t you tell us that when we could have
done something about it?” One hears, “We tried to tell you that this would happen, but you
didn’t pay any attention to us.” These, as well as less printable remarks, are what one hears
when the members of an MT do not work and play well together—in other words, when the
various individuals and groups working on the project are not well integrated. Rather than
operating as a team, they work as separate and distinct parts, each of which has its own tasks
and is not much interested in the other parts.
The intricate process of coordinating the work and timing of the different groups is
called integration management. The term interface coordination is used to denote the pro-
cess of managing this work across multiple groups. The linear responsibility chart discussed
above is a useful aid to the PM in carrying out this task. It displays the many ways the mem-
bers of the project team (which, as usual, includes all of the actors involved, not forgetting
the client and outside vendors) must interact and what the rights, duties, and responsibilities
of each will be.
An early approach to this problem was developed by Benningson (1972). Called TREND
(Transformed Relationships Evolved from Network Data), the analysis was designed to illus-
trate important linkages and dependencies between work groups. The aim was to alert the PM
to potential problems associated with cross-functional interfaces and to aid in the design of
effective ways to avoid or deal with potential interface problems. Benningson added inter-
dependence, uncertainty, and prestige to the mix. The precise way in which these elements
were attached to the relationships delineated in the project plan is best seen by reference to
Benningson (1972). (A brief explanation of TREND also appeared in the third edition of this
work, pp. 221–24.) A key point is that mapping all dependencies in the project can show a
complete description of project interfaces.
Recent work on managing the interfaces focuses on the use of MTs to plan the project as
well as design the products/services the project is intended to produce. There is general agree-
ment that MT has a favorable impact on product/service design and delivery. As we noted in
Chapter 4, Section 4.3, the Chrysler Corporation’s use of concurrent engineering (CE), one
form of MT, not only resulted in excellent design, it also produced major economic benefits
by shortening the design cycle. Work by Hauptman et al. (1996, p. 161) shows that CE has
had a “favorable impact . . . on attainment of project budget goals, but achieves this without
any adverse impact on quality, cost or schedule.” [Note: this entire issue of IEEE Transactions
on Engineering Management is devoted to CE.] The process also was associated with higher
levels of team job satisfaction.](https://image.slidesharecdn.com/projectmanagement-111021123807-phpapp02/85/Project-management-285-320.jpg)


![CASE 285
1. Periodic status checking will be performed monthly. on time and within the budgeted funds. As is so often
2. Labor costs will be collected manually and estimated the case, the existence of a formal plan and continuing
where necessary from discussion with Group reference to it made it possible to deal with changes of
engineering management. scope. Initial reaction to the educational package was so
3. Out-of-pocket costs will be collected through favorable that the population of attendees was increased
commitments and/or invoice payment records. by Group executives and engineering managers.
4. Monthly status reports will be issued by the PMC To deliver on time and within budget, but to deliver
Program project manager including: a product which does not serve the client’s needs is
a. Cost to date summaries. also unsatisfactory. Did this PMC Program achieve
b. Cost variances. the “General Objectives” of Figure 5? As is so often
c. Schedule performance relative to schedule in the case in managerial systems and educational pro-
Gantt format. grams, we are forced to rely on the perceptions of the
d. Changes in scope or other modifications to plan. clients. In this PMC Program, the clients are Cor-
5. Informal control will be exercised through milestone porate Management, Group Management, and most
anticipation by the PMC Program project manager. importantly, the Managers of Engineering and their
Figure 10 Control system. staffs. In the short run, the latter two operational cli-
ents are primary. In addition to informal feedback
from them, formal feedback was obtained in the form
Milestones and Schedule Subdivisions of Impact Statements (item number 4000 in the WBS
Milestones and Schedule Subdivisions are a part of of Figure 5). The Impact Statements concerned the
the control system. Of the set of events which can be, impact of the PMC Program on the concerned orga-
milestones form a limited subset of events, in practice nization (“How many labor-hours are expected to be
rarely exceeding 20 at any given level. The milestones devoted to the PMC System?) and response to the
are predetermined times (or performance states) at which PMC Program (“Has this been of value to you in
the feedback loop of control described above (Figure 9) doing your job better?”).
should be exercised. Other subdivisions of the project Clearly, the response of perceived value from the
are possible, milestones simply being a subdivision by operating personnel was positive. Can we measure the
events. Periodic time subdivisions may be made, or divi- improvement which we believe to be taking place in
sion into phases, one of the most common. Figure 11 the implementation of capital and other projects? It may
shows the milestones for the PMC Program. be years before the impact (positive or negative) can be
evaluated, and even then there may be such confounding
Summary with internal and external variables that no unequivocal,
quantified response can be defined.
The Heublein PMC Program met the conditions for At this point we base our belief in the value of the
a successful project in the sense that it was completed PMC Program on the continuing flow—starting with
Impact Statements—of positive perceptions. The follow-
ing is an example of such a response, occurring one year
Date Description after the exposure of the respondent:
09/05/79 Program plan approved by both Corporate
Groups . . . find attached an RD Project Tracking Dia-
09/26/79 Reporting and control system approved by gram developed as a direct result of the [PMC]
Corporate and Groups seminar . . . last year. [In the seminar we called it]
10/05/79 Organizational impact analysis report issued a Network Analysis Diagram. The Product Devel-
11/07/79 Basic project planning and control seminars opment Group has been using this exclusively to
completed track projects. Its value has been immeasurable.
03/24/80 Final procedures manual approved Since its inception, fifteen new products have gone
Technical Seminars completed through the sequence. . . .
Computer support systems survey completed
06/30/80 Final impact assessment report issued
Figure 11 Milestones.](https://image.slidesharecdn.com/projectmanagement-111021123807-phpapp02/85/Project-management-303-320.jpg)


![310 CHAPTER 7 / BUDGETING AND COST ESTIMATION
150
Additional time used for learning
125
Time as charged without
allowance for learning
100
Time (hours)
75
(70)
50
25
0
0 4 8 12 16 20 24 28 32 36
Figure 7-4 Effects of ignoring learning curve. Number of units
A Special Case of Learning—Technological Shock
If the parent organization is not experienced in the type of project being considered for selec-
tion, performance measures such as time to installation, time to achieve 80 percent efficiency,
cost to install, and the like are quite uncertain and often will be seriously underestimated. It is
interesting to observe that an almost certain, immediate result of installing a new, cost-saving
technology is that costs rise. Sometimes we blame the cost increases on resistance to change,
but a more sensible explanation is that when we alter a system, we disturb it and it reacts in
unpredictable ways. A steelmaker recalling the installation of the then new technology for
manufacturing tinplate by electrolysis remarked, “We discovered and installed the world’s
first electrolytic method for making scrap. It took a year before we had that line running the
way it was designed.” Of course, if the organization is experienced, underestimation is not
likely to be a serious problem. The Reliance Electric Company undertook several “18-month”
plant construction projects that they predicted, accurately, would require 36 months to build
from decision to the point when the plant was capable of operating at or above three-fourths
capacity. (Note the potential for ethical problems here.) To the extent possible, past knowledge
of system actions and reactions should be built into estimates of future project performance.
Other Factors
Depending on the reference, anywhere from about three-fifths to five-sixths of projects fail
to meet their time, cost, and/or specification objectives (see, for example, Frame, 1998).
The record of Information Technology (IT) projects is particularly poor, according to arti-
cle after article in the journals of the Project Management Institute. Possibly the problem is
that Dilbert’s pointy-haired boss sets arbitrary and impossible goals. Possibly scope-creep
impacts all projects [though cost overruns are not necessarily associated with changing scope
(Christensen et al., 1998)]. Possibly PMs use wildly optimistic estimates in order to influence](https://image.slidesharecdn.com/projectmanagement-111021123807-phpapp02/85/Project-management-328-320.jpg)


![8.2 NETWORK TECHNIQUES: PERT (ADM) AND CPM (PDM) 351
Feb 03, '02 Feb 10, '02
ID Task Name Duration Predecessors W T F S S M T W T F S S M T W
1 1 5 days
2 2 2 days 1 FS + 2 days
3
4 4 5 days
5 5 4 days 4 SS + 2 days
6
7 7 5 days
8 8 4 days 7 FF + 1 day
9
10 10 5 days
11 11 4 days 10 SF + 7 days
Task Rolled Up Task External Tasks
Project: Project 1 Progress Rolled Up Milestone Project Summary
Date: 02/04/2002 Milestone Rolled Up Progress Group By Summary
Summary Split
Page 1
Figure 8-17 Precedence diagramming conventions.
days,” Activity 2 would be scheduled to start at least two days after the completion of
Activity 1, as shown in Figure 8-17. For instance, if Activity 1 was the pouring of a
concrete sidewalk, Activity 2 might be any activity that used the sidewalk.
• Start to Start Activity 5 cannot begin until Activity 4 has been underway for at least
two days. Setting electrical wires in place cannot begin until two days after framing
has begun.
• Finish to Finish Activity 7 must be complete at least one day before Activity 8
is completed. If Activity 7 is priming the walls of a house, Activity 8 might be the
activities involved in selecting, purchasing, and finally delivering the wallpaper. It is
important not to hang the paper until the wall primer has dried for 24 hours.
• Start to Finish Activity 11 cannot be completed before 7 days since the start of Activ-
ity 10. If Activities 10 and 11 are the two major cruising activities in a prepaid weeklong
ocean cruise, the total time cannot be less than the promised week. The S–F relationship
is rare because there are usually simpler ways to map the required relationship.
Precedence diagramming is an AON network method that easily allows for these leads and
lags within the network. MSP handles leads and lags without problems. Network node times
are calculated in a manner similar to AON/AOA times. Because of the lead and lag restrictions,
it is often helpful to lay out a Gantt chart to see what is actually happening. The richer set of
precedence relationships allowed by AON is pertinent for a variety of projects, particularly
construction projects. [For more details on this technique, see Al-Hammed et al. (1998).] Most
current project management software will allow leads, lags, delays, and other constraints in the
context of their standard AON network and Gantt chart programs.](https://image.slidesharecdn.com/projectmanagement-111021123807-phpapp02/85/Project-management-369-320.jpg)


![8.3 RISK ANALYSIS USING SIMULATION WITH CRYSTAL BALL® 365
the true variance of the distribution and found the differences to be quite small, consistently
under 5 percent.
It is important to repeat that some managers do not have confidence in making estimates
at the 99 percent level and prefer the 90 or 95 percent levels. If estimates are made at these
levels, however, use of the traditional calculation for variance ({[b a]/6}2) will result in
a serious underestimation of path variances and introduce considerable error into estimates
of the probabilities of completing projects by specific dates. But again, we caution read-
ers that nothing will help the PM manage risk if the input data are biased or carelessly
developed.
8.3 RISK ANALYSIS USING SIMULATION
WITH CRYSTAL BALL®*
As we have emphasized often in this book, life with projects is characterized by uncertainty.
The time required to carry out an activity, the cost and availability of a resource, the success
of a research experiment, the wishes of the client, and the actions of a competitor, as well
as the vagaries of the weather, ups and downs of interest rates, and the dyspepsia of a senior
manager are typical of the things that can upset the most carefully planned and managed
project. While it is possible through careful preplanning to reduce somewhat the degree of
uncertainty surrounding any project, uncertainty can never be eliminated. We can, however,
manage the uncertainty so as to reduce the impact of the ambiguities existing in our uncer-
tain world.
As we noted in Section 2-4 in Chapter 2, one method of managing the uncertainty is to
perform risk analysis on such data as we have involved in our managerial decisions. This
requires us to make assumptions about the probability distributions of the variables and
parameters affecting our decisions. These assumptions allow us to adopt Monte Carlo simu-
lation models and evaluate the impact of given managerial decisions. The decision is mod-
eled mathematically. Individual values for each variable in the model are selected at random
from the probability distributions we specified, and the outcome of the model is calculated.
This process is repeated many times, and the model’s output for each repetition is used to
construct a statistical distribution of all of the outcomes. This distribution shows the risk
profile of the decision. The risk profile is considered along with the parent organization’s
strategies and policies, the wishes of the client, and many other factors when making the
decision.
In Chapter 2, we used Crystal Ball® (CB) to simulate a decision process that measured
whether or not a project was above an organization’s hurdle rate of return. We have noted seve-
ral times that the same kind of simulation might be used to manage the uncertainty involved in
deciding at what level to budget a project. We can now examine its use in scheduling projects.
Let us reconsider the data we have previously analyzed from Table 8-1. The analytical approach
to finding the duration of the critical path of the network as well as path times for the network’s
other paths is based on our assumption that the probability distribution used for activity times
was best described as a beta distribution. CB can use the beta distribution to generate random
numbers for a simulation, but for each assumption cell we must be able to specify two shape-
variables for the beta distribution, and this, in turn, requires an advanced understanding of statis-
tical topics beyond our scope. Remember that the problem we are attacking here is the process
*Occasionally, particular sections will be shaded, meaning that they can be skipped without loss of continuity.](https://image.slidesharecdn.com/projectmanagement-111021123807-phpapp02/85/Project-management-383-320.jpg)


![370 CHAPTER 8 / SCHEDULING
Forecast: Project Completion Time
Edit Preferences View Run Help
1,000 Trials Cumulative Chart 1 Outlier
1.000 1000
.750 750
Probability
Frequency
.500 500
.250 250
.000 0
33.82 40.70 47.59 54.47 61.35
Days
– Infinity Certainty 76.30 % 52.00
Figure 8-31 CB cumulative probability chart of project completion time.
condition that all other activities would simultaneously maintain the required small values.]
The project could, of course, be delayed for far more than 70 days, but that would be caused
by some external, catastrophic event not contemplated when generating the original time
estimates. (The possibility that this type of event may occur is precisely why we will advise
PMs to continue to update risk identification, assessment, and analysis as long as the project
is underway.)
Traditional Statistics or Simulation?
The PM no longer has much choice about dealing with uncertainty. When the first edition
of this book was written in 1985, three-time PERT/CPM was used by a few hardy souls, but
uncertainty was more or less ignored by a large majority of those involved with projects.
“Allowances for contingencies” were made as a sort of insurance against time and budget
overruns, but little more attention was paid to risk. Times have changed. Formal risk manage-
ment systems are now standard practice in many firms, and risk management is used by many
others on specific types of projects that are considered “risky.” The management of risk is not
an issue. The only issue is how to do it.
The subject of project scheduling brings the problem of choosing the methods used to per-
form quantitative risk analysis into focus. The standard statistical methods were explained and
demonstrated in the subsection on “Uncertainty in Project Completion Time,” in this chapter.
Following the section on traditional methods, we demonstrated and discussed simulation as a
way of accomplishing essentially the same analysis. For a number of reasons, we suggest that
simulation is the preferred method—but only after the analyst has a good understanding of
the traditional statistical approach.
Both methods require that the three time estimates be made and that the TE be found for
each activity. TE (and variance) is easily calculated on almost any commercially available
spreadsheet. Using statistics, TE and variance must also be found for each path—again, easily
done by computer. Most real projects, however, are larger than the hypothetical projects we
used to explain and illustrate the techniques of project management. When dealing with larger
projects and their many paths, it is difficult merely to find those paths that may be critical](https://image.slidesharecdn.com/projectmanagement-111021123807-phpapp02/85/Project-management-388-320.jpg)


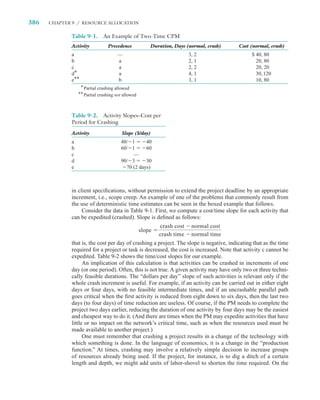


![396 CHAPTER 9 / RESOURCE ALLOCATION
EF = 20 EF = 35
d, 15
2 6
[0,2]
j,
[4 , 20
0
e, 1,1]
8
]
[0
,0
a
,6
EF = 20 [2
]
1 b, 20 3 f, 14 7 EF = CRIT. TIME = 43
[2,1] [1,1]
g,
c, 3,1] [1,0 4
[6 18
10
[
]
]
i,
,3
4 5h, 11
[0,2]
EF = 10 EF = 24
Figure 9-4 The AOA network of Table 8-2.
Because the project action plan is the source of information on activity precedences, dura-
tions, and resources requirements, it is the primary input for both the project schedule and its
budget. The action plan links the schedule directly to specific demands for resources. Thus,
the AOA network technique can be modified to generate time-phased resource requirements.
A Gantt chart could be adapted, but the AOA diagram, particularly if modified to illustrate
slacks as in Figure 9-1, will be helpful in the analysis used for resource leveling. Let us illus-
trate with the AON network used as an example in the previous chapter, but converted to an
AOA diagram. The AOA network (from Table 8-2) is illustrated in Figure 9-4, and resource
usage is illustrated for two hypothetical resources, A and B, on the arcs. The expected activ-
ity time is shown above the arc, and resource usage is shown in brackets just below the arc,
with the use of A shown first and B second—e.g., [5, 3] would mean that five units of A and
three units of B would be used on the activity represented by the arc. Figure 9-5 shows the
“calendarized” AOA diagram, similar to the familiar Gantt chart. Resource demands can now
be summed by time period across all activities.
The loading diagram for resource A is illustrated in Figure 9-6a, and that for resource
B in Figure 9-6b. The loads are erratic and vary substantially over the duration of the proj-
ect. Resource A, used in tasks a, b, and c, has a high initial demand that drops through the
a d j
1 2 6 7
(4, 0) (0, 2) (0, 6)
e
3
(2, 1)
f
3
(1, 1)
b g i
1 3 5
(2, 1) (1, 0) (6, 3)
c dummy
1 4
(3, 1)
h
4
(0, 2)
0 5 10 15 20 25 30 35 40 45
Days
Figure 9-5 Modified AOA diagram showing activity slack and resource usage (from Figure 9-4).](https://image.slidesharecdn.com/projectmanagement-111021123807-phpapp02/85/Project-management-414-320.jpg)


![9.4 RESOURCE LEVELING 399
2
2
a,
[2]
c, 5
1 4
b, [4]
3
[2]
3
(a)
a
8
a
Workers
Activity
b 6
4 c c
c
2 c
b b
0
1 2 3 4 5 1 2 3 4 5
Days Days
(b)
a
8
Workers
Activity
b 6
a b
4
c
2 c
0
1 2 3 4 5 1 2 3 4 5
Days Days
(c)
Figure 9-7 (a) The network. (b) Before resource leveling. (c) After resource leveling.
delayed f one day), and increase usage by one unit beginning on day 35, continuing to the
end of the project. This action increases peak use of B from nine to ten units.
It is important to emphasize that if the network under consideration is more complex and
the number of resources to be leveled is realistically large, a manual leveling process is out
of the question. Computer-aided leveling is not only mandatory, it is also helpful because it
allows the PM to experiment with various patterns of resource usage through simulation. In
the next section, we raise the most general problem of minimizing resource usage while still
achieving various completion dates—or the inverse problem, minimizing completion times
while operating with specified limits on resources.](https://image.slidesharecdn.com/projectmanagement-111021123807-phpapp02/85/Project-management-417-320.jpg)


![9.5 CONSTRAINED RESOURCE SCHEDULING 403
Producing a Video Tape
March April May
WBS Task Name Duration Start Finish
2/24 3/3 3/10 3/17 3/24 3/31 4/7 4/14 4/21 4/28 5/5 5/12 5/19 5/26
1 Project approval 0 days 03/01/02 03/01/02
03/01
2 Script writing 14 days 03/01/02 03/20/02
03/20 Script Writer
3 Schedule shoots 17 days 03/01/02 03/25/02
03/14
3.1 Begin scheduling 0 days 03/01/02 03/01/02
03/01
3.2 Propose shoots 5 days 03/01/02 03/07/02
03/07 Producer. Client, Script Writer
3.3 Hire secretary 12 days 03/01/02 03/18/02
03/07 Producer
3.4 Schedule shoots 5 days 03/19/02 03/25/02
03/14 Secretary
3.5 Scheduling complete 0 days 03/25/02 03/25/02
03/14
4 Script approval 8 days 03/21/02 04/01/02
03/27 Client, Producer
5 Revise script 5 days 04/02/02 04/08/02
04/03 Producer, Script Writer
6 Shooting 10 days 04/09/02 04/22/02
04/17 Editor, Client. Production Staff [300%]
7 Editing 7 days 04/23/02 05/01/02
04/26 Editor, Editing Staff, Editing Room
8 Final approval 2 days 05/02/02 05/03/02
05/03 Client, Producer, Editor
9 Deliver video to client 0 days 05/03/02 05/03/02
05/03
Project: Producing a Video Tape Critical Task Critical Milestone Summary
Project Manager: S. Spielberg
Start Date: 03/01/02 Noncritical Task Noncritical Milestone
Critical Tasks Highlighted
Figure 9-10 MSP Gantt chart of video tape project showing resource needs.
Heuristic Methods
Heuristic approaches to constrained resource scheduling problems are in wide, general use
for a number of reasons. First, they are the only feasible methods of attacking the large, non-
linear, complex problems that tend to occur in the real world of project management. Second,
while the schedules that heuristics generate may not be optimal, they are usually quite good—
certainly good enough for most purposes. Commercially available computer programs handle
large problems and have had considerable use in industry. Further, modern simulation tech-
niques allow the PM to develop many different schedules quickly and to determine which, if
any, are significantly better than current practice. If a reasonable number of simulation runs
fail to produce significant improvement, the PM can feel fairly confident that the existing
solution is a good one.
Most heuristic solution methods start with the PERT/CPM schedule and analyze
resource usage period by period, resource by resource. In a period when the available
supply of a resource is exceeded, the heuristic examines the tasks in that period and
allocates the scarce resource to them sequentially, according to some priority rule. The
major difference among the heuristics is in the priority rules they use. Remember that
the technological necessities always take precedence. Some of the most common priority
rules are:
As Soon as Possible The default rule for scheduling. This provides the general
solution for critical path and time.
As Late as Possible All activities are scheduled as late as possible without delaying
the project. The usual purpose of this heuristic is to defer cash outflows as long as
possible.](https://image.slidesharecdn.com/projectmanagement-111021123807-phpapp02/85/Project-management-421-320.jpg)


![10.3 EARNED VALUE ANALYSIS 451
Any other names/acronyms will be identified with the author(s). A history of earned value
from its origin in PERT/Cost together with its techniques, advantages, and disadvantages is
reported in a series in PM Network starting with Flemming et al. (1994).
A serious difficulty with comparing actual expenditures against budgeted or baseline
expenditures for any given time period is that the comparison fails to take into account the
amount of work accomplished relative to the cost incurred. The earned value of work per-
formed (value completed) for those tasks in progress is found by multiplying the estimated
percent physical completion of work for each task by the planned cost for those tasks. The
result is the amount that should have been spent on the task thus far. This can then be com-
pared with the actual amount spent.
Making an overall estimate of the percent completion of a project without careful study
of each of its tasks and work units is not sensible—though some people make such estimates
nonetheless. Instead, it is apparent that at any date during the life of a project the following
general condition exists: Some work units have been finished, and they are 100 percent com-
plete; some work units have not yet been started, and they are 0 percent complete; other units
have been started but are not yet finished, and for this latter group we may estimate a percent
completion.
As we said, estimating the “percent completion” of each task (or work package) is non-
trivial. If the task is to write a piece of software, percent completion can be estimated as the
number of lines of code written divided by the total number of lines to be written—given that
the latter has been estimated. But what if the task is to test the software? We have run a known
number of tests, but how many remain to be run?
There are several conventions used to aid in estimating percent completion:
• The 50–50 rule Fifty percent completion is assumed when the task is begun, and the
remaining 50 percent when the work is complete. This seems to be the most popular
rule, probably because it is relatively fair and doesn’t require the effort of attempting to
estimate task progress. Since it gives credit for half the task as soon as it has begun, it is
excessively generous at the beginning of tasks, but then doesn’t give credit for the other
half until the task is finally complete, so is excessively conservative toward the end of
tasks, thereby tending to balance out on an overall basis.
• The 0–100 percent rule. This rule allows no credit for work until the task is com-
plete. With this highly conservative rule, the project always seems to be running late,
until the very end of the project when it appears to suddenly catch up. Consequently,
the earned value line will always lag the planned value line on the graph.
• Critical input use rule. This rule assigns task progress according to the amount of a
critical input that has been used. Obviously, the rule is more accurate if the task uses
this input in direct proportion to the true progress being made. For example, when
building a house, the task of building the foundation could be measured by the cubic
yards (or meters) of concrete poured, the task of framing the house could relate to the
linear feet (meters) of lumber used, the roofing task could relate to the sheets of 4 8
foot plywood used, and the task of installing cabinets might be measured by the hours
of skilled cabinet labor expended.
• The proportionality rule. This commonly used rule is also based on proportionali-
ties, but uses time (or cost) as the critical input. It thus divides actual task time-to-date
by the scheduled time for the task [or actual task cost-to-date by total budgeted task
cost] to calculate percent complete. If desirable, this rule can be subdivided accord-
ing to the subactivities within the task. For example, suppose progress on a task is
dependent on purchasing (or building) a large, expensive machine to do a long and
difficult task, but the machine itself does not make any substantial task progress.](https://image.slidesharecdn.com/projectmanagement-111021123807-phpapp02/85/Project-management-469-320.jpg)


![11.2 THREE TYPES OF CONTROL PROCESSES 487
should not be punitive or intimidating. As we pointed out in Chapter 10, punitive meetings do
far more damage than good.
Postcontrol
Postcontrols (also known as postperformance controls or reviews, or postproject controls or
reviews) are applied after the fact. One might draw parallels between postcontrol and “locking the
barn after the horse has been stolen,” but postcontrol is not a vain attempt to alter what has already
occurred. Instead, it is a full recognition of George Santayana’s observation that “Those who can-
not remember the past are condemned to repeat it.” Cybernetic and go/no-go controls are directed
toward accomplishing the goals of an ongoing project. Postcontrol is directed toward improving
the chances for future projects to meet their goals. The PMBOK recognizes the value of what is
PMBOK Guide called “Organizational Process Assets” (OPA) and contains the formal policies, procedures, and
guidelines applying to projects. In the Project Time Management chapter, for example, the OPA
also contains “The lessons-learned knowledge base [that] contains historical information regard-
ing activities lists used by previous similar projects that can be considered when defining project
schedule activities.” (See Project Management Institute, 2004.)
Postcontrol is applied through a relatively formal document that is usually constructed
with four distinct sections.
The Project Objectives The postcontrol report will contain a description of the objectives
of the project. Usually, this description is taken from the project proposal, and the entire pro-
posal often appears as an appendix to the postcontrol report. As reported here, project objec-
tives include the effects of all change orders issued and approved during the project.
Because actual project performance depends in part on uncontrollable events (strikes,
weather, failure of trusted suppliers, sudden loss of key employees, and other acts of God), the
key initial assumptions made about risks during preparation of the project budget and sched-
ule should be noted in this section. A certain amount of care must be taken in reporting these
assumptions. They should not be written with a tone that makes them appear to be excuses
for poor performance. At the same time, it is useful to remember that brevity is a virtue when
writing postcontrol reports on routine projects unless the uncontrollable events are apt to
occur with some frequency. While it is clearly the prerogative, if not the duty, of every PM to
protect him- or herself politically, he or she should do so in moderation to be effective.
Milestones, Checkpoints, and Budgets This section of the postcontrol document starts
with a full report of project performance against the planned schedule and budget. This can
be prepared by combining and editing the various project status reports made during the proj-
ect’s life. Significant deviations of actual schedule and budget from planned schedule and
budget should be highlighted. Explanations of why these deviations occurred will be offered
in the next section of the postcontrol report.
The Final Report on Project Results When significant variations of actual from planned
project performance are indicated, no distinction is made between favorable and unfavorable
variations. Like the tongue that invariably goes to the sore tooth, project managers focus
their attention on trouble. While this is quite natural, it leads to complete documentation on
why some things went wrong and little or no documentation on why some things went par-
ticularly well. Both sides, the good and the bad, should be chronicled here.
Not only do most projects result in outputs that are more or less acceptable, most projects
operate with a process that is more or less acceptable. The concern here is not on what the
project did but rather on how it did it. Basically descriptive, this part of the final report should
cover project organization, an explanation of the methods used to plan and direct the project,
and a review of the communication networks, monitoring systems, and control methods, as
well as a discussion of intraproject interactions between the various working groups.](https://image.slidesharecdn.com/projectmanagement-111021123807-phpapp02/85/Project-management-505-320.jpg)


![12.2 THE PROJECT AUDIT 527
Depth of the Audit
There are several practical constraints that may limit the depth of the project auditor’s inves-
tigation. Time and money are two of the most common (and obvious) limits on the depth
of investigation and level of detail presented in the audit report. Of course, there are costs
associated with the audit/evaluation process over and above the usual costs of the professional
and clerical time used in conducting the audit. Accumulation, storage, and maintenance of
auditable data are important cost elements. Remember that such storage may be critically
important in meeting the test of “due diligence” noted in Chapter 11. (Remember, too, that
destruction of business data may be illegal under certain circumstances.)
Also serious, but less quantifiable, are two often overlooked costs. First, no matter how
skilled the evaluator, an audit/evaluation process is always distracting to those working on the
project. No project is completely populated with individuals whose self-esteem [defined by
Ambrose Bierce (1991) as “an erroneous appraisement”] is so high that evaluation is greeted
without anxiety. Worry about the outcome of the audit tends to produce an excessive level of self-
protective activity, which, in turn, lowers the level of activity devoted to the project. Second, if the
evaluation report is not written with a “constructive” tone, project morale will suffer.* Depend-
ing on the severity of the drop in morale, work on the project may receive a serious setback.
It is logical to vary the depth of the investigation depending on circumstances and needs
unique to each project. While an audit can be performed at any level the organization wishes,
three distinct levels are easily recognized and widely used: the general audit, the detailed
audit, and the technical audit. The general audit is normally most constrained by time and
resources and is usually a brief review of the project, touching lightly on the six concerns
noted earlier. A typical detailed audit is conducted when a follow-up to the general audit is
required. This tends to occur when the general audit has disclosed an unacceptable level of
risk or malperformance in some part(s) of the project.
At times, the detailed audit cannot investigate problems at a satisfactory technical level
because the auditor does not possess the technical knowledge needed. In such cases, a techni-
cal audit is required. Technical audits are normally carried out by a qualified technician under
the direct guidance of the project auditor. In the case of very advanced or secret technology,
it may be difficult to find qualified technical auditors inside the organization. In such cases,
it is not uncommon for the firm to use academic consultants who have signed the appropriate
nondisclosure documents. Although not a hard and fast rule, the technical audit is usually the
most detailed.
Timing of the Audit
Given that all projects of significant size or importance should be audited, the first audits are
usually done early in the project’s life. The sooner a problem is discovered, the easier it is to
deal with. Early audits are often focused on the technical issues in order to make sure that key
technical problems have been solved or are under competent attack. Ordinarily, audits done
later in the life cycle of a project are of less immediate value to the project, but are of more
value to the parent organization. As the project develops, technical issues are less likely to
be matters of concern. Conformity to the schedule and budget becomes the primary interest.
Management issues are major matters of interest for audits made late in the project’s life (e.g.,
disposal of equipment or reallocation of project personnel).
Postproject audits are conducted with several basic objectives in mind. First, a postpro-
ject audit is often a legal necessity because the client specified such an audit in the contract.
*The evaluator is well advised to remember two fundamental principles: (1) Constructive criticism does not feel all
that constructive to the criticizee; and (2) Fix first, then blame—if you have any energy left.](https://image.slidesharecdn.com/projectmanagement-111021123807-phpapp02/85/Project-management-545-320.jpg)