Downloaded 25 times

![Variance for each activity is given by:
2
[(PT - OT) / 6]
Q9. What are the banafits and limitations of PERT Technique?
Ans. Benefits of PERT
PERT is useful because it provides the following information:
• Expected project completion time.
• Probability of completion before a specified date.
• The critical path activities that directly impact the completion time.
• The activities that have slack time and that can lend resources to critical
path activities.
• Activities start and end dates.
Limitations of PERT
The following are some of PERT's limitations:
• The activity time estimates are somewhat subjective and depend on judgment. In
cases where there is little experience in performing an activity, the numbers may
be only a guess. In other cases, if the person or group performing the activity
estimates the time there may be bias in the estimate.
• The underestimation of the project completion time due to alternate paths
becoming critical is perhaps the most serious .
Unit-5: Project Management Information System
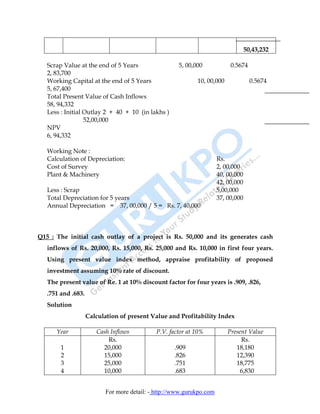
Q10 Explain about project management information system.
Ans. A Project Management Information System (PMIS) is a part of Management
Information Systems (MIS) and manage information of a project centric
organization. These electronic systems "help [to] plan, execute, and close project
management goals."[PMIS systems differ in scope, design and features
depending upon an organization’s operational requirements.
A Project Management System(PM) could be a part of a PMIS or sometimes an
external tool beside project management information system. What a PMIS does
For more detail: - http://www.gurukpo.com](https://image.slidesharecdn.com/150-130317084228-phpapp02/85/150-46-320.jpg)
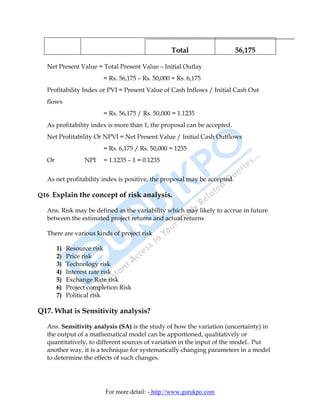
![is to manage all stakeholders in a project such as Project Owner, Client,
Contractors, Sub-Contractors, Company persons, Workers, Managers and etc.
PMIS Project Management Information System (PMIS) An information system
consisting of the tools and techniques used to gather, integrate, and disseminate
the outputs of project management processes. It is used to support all aspects of
the project from initiating through closing, and can include both manual and
automated systems.
Project Management Information System (PMIS) [Tool]. An information system
consisting of the tools and techniques used to gather, integrate, and disseminate
the outputs of project management processes. It is used to support all aspects of
the project from initiating through closing, and can include both manual and
automated systems
Shared Savings Performance Contract: The contractor provides the financing
and is paid an agreed fraction of actual savings as they are achieved. This
payment is used to pay down the debt costs of equipment and/or services.
Send your requisition at
info@biyanicolleges.org
For more detail: - http://www.gurukpo.com](https://image.slidesharecdn.com/150-130317084228-phpapp02/85/150-47-320.jpg)

The document discusses project feasibility analysis which aims to objectively evaluate the strengths, weaknesses, opportunities, and threats of a proposed project. It covers five key factors in feasibility analysis: technological feasibility to determine if the required technology is available; economic feasibility through cost-benefit analysis to determine if the benefits outweigh the costs; operational feasibility to evaluate if the project fits with organizational goals and structure; schedule feasibility to assess if the project can be completed on time; and legal feasibility to ensure the project complies with relevant laws and regulations. Conducting a thorough feasibility analysis is important for evaluating the viability of a proposed project before significant resources are committed.


![Project Management (April - 2014) [CBSGS - Paper Solution] {Mumbai University}](https://cdn.slidesharecdn.com/ss_thumbnails/pm-cbsgs-apr-2014-ps-190613193621-thumbnail.jpg?width=640&height=640&fit=bounds)


