This document describes a project submitted by Ashish Singh Tomar to fulfill the requirements for a Bachelor's Degree in Bioinformatics. The project involves developing a next-generation sequencing (NGS) data analysis pipeline using the R statistical package. The document includes sections acknowledging contributions from colleagues and supervisors, as well as chapters outlining the aims, methodology, and results of the project.

![6 | P a g e
CHAPTER I
1.1 INTRODUCTION
NEXT-GENERATION SEQUENCING
Next-generation sequencing technologies are revolutionizing genomics and their effects are
increasingly widespread. Genome-wide sequencing has enabled modern biomedical research
to discover more and more biomarkers in healthy as well as disease-affected cells and
tissues. The high demand for low-cost sequencing has driven the development of high-
throughput sequencing technologies that parallelize the sequencing process, producing
thousands or millions of sequences at once, called massively parallel DNA sequencing.
Next-generation high-throughput DNA sequencing techniques are opening fascinating
opportunities in the life sciences. Novel fields and applications in biology and medicine are
becoming a reality, much beyond the original goal of the genomic sequencing. Serving as
examples are: personal genomics with detailed analysis of individual genome stretches;
precise analysis of RNA transcripts for gene expression, surpassing and replacing in several
respects analysis by various microarray platforms, for instance precise analysis of DNA
regions interacting with regulatory proteins in functional regulation of gene expression
(Chip-seq). The next-generation sequencing technologies offer novel and rapid ways for
genome-wide characterization and profiling of mRNAs, small RNAs, transcription factor
regions, structure of chromatin and DNA methylation patterns. In gene-expression studies
microarrays are now being replaced by seq-based methods, which can identify and quantify
rare transcripts without prior knowledge of a particular gene and can provide information
regarding alternative splicing and sequence variation in identified genes.
The ability to sequence the whole genome of many related organisms has allowed large-
scale comparative and evolutionary studies that were unimaginable just a few years ago. For
example Metagenomics [1] and HapMap project [2].
The broadest application of NGS is resequencing of human genome to enhance our
understanding of how genetic differences affect health and disease and to know the
difference between individuals at genomic level. Understanding how a small change in](https://image.slidesharecdn.com/95d6b9e6-9524-4896-9f81-40412e6f80c4-150207034444-conversion-gate02/85/project-6-320.jpg)
![7 | P a g e
genomes give rise to different phenotypes will lead to the development of personalized and
preventative medicine. The power of next-generation sequencing is increasingly exploited to
re-sequence strains and genomes of individuals for which reference genome sequences are
available to understand genomic diversity. Such studies have identified mutations in
bacterial strains, polymorphisms in worm, structural variation in the human genome and
specific alleles involved in cancer. In addition to analysis of genome sequences, NGS has
paved way for new approaches for assay and application such as Chip-seq, Tn-seq, RNA-seq
etc. which will greatly advance our understanding of various phenomena at genomic level.
The principle behind these alternative applications, which have been termed ‘sequence
census’ methods, is simple: complex DNA or RNA samples are directly sequenced to
determine their content without bacterial cloning as a prerequisite.
Given the vast amount of data produced (currently greater than a gigabase per run, with this
constantly increasing as well), developing a sound data storage and management solution
and creating informatics tools to effectively analyze the data are essential to successful
application of the technology.
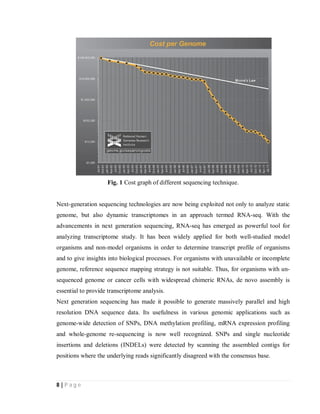
Next-generation sequencing technologies allow genomes to be sequenced more quickly and
less expensively than previous techniques [fig.1][3]. Next-generation sequencing has proven
to be an extremely effective technology for molecular counting applications where the
number of sequence reads provides a digital readout for RNA-seq, ChIP-seq, Tn-seq and
other applications. Biological pathways consist of complex networks of interacting genes
which are responsible for expression and regulation of other genes. Therefore it is essential
to determine quantitative genetic interaction on a genome wide range to reveal the hidden
mechanism of gene regulation during various diseases. While having a genome wise
annotation and analysis, the main challenge of genome assembly is in identifying repetitive
regions present in most of the mammalian genome which makes it difficult for the
identification of exons or regulatory regions. With reference genome available, short
sequence reads are sufficient to map their locations (except for repeated regions), and once
mapped, millions of sequence hits are simply counted to determine their genomic
distribution.](https://image.slidesharecdn.com/95d6b9e6-9524-4896-9f81-40412e6f80c4-150207034444-conversion-gate02/85/project-7-320.jpg)
![9 | P a g e
1.2 NEXT-GENERATION SEQUENCING TECHNOLOGIES:
Sequencing technologies include a number of steps that are broadly identified as template
preparation, sequencing, imaging and data analysis. The unique combination of specific
protocols distinguishes one technology from another and determines the type of data
produced from each platform.
Template preparation: In the first step, the DNA is chopped (sheared) into small pieces
and the pieces of DNA are amplified by PCR method. The amplified pieces are immobilized
on a solid surface to form templates. Millions of templates DNA are allowed for rapid
sequencing at the same time. Some of the NGS technologies use different ways of template
preparation like clonally amplified and single molecule. [1]
Sequencing and imaging: Template preparation mostly composed of clonally amplified
and single molecule templates. The template from these methods are further processed for
sequencing and imaging using the Cyclic Reversible Termination (CRT), Sequencing By
Ligation (SBL), Single Nucleotide Addition (SNA) also called Pyrosequencing, and Real
Time Sequencing (RTS).[1]
Widely Used Platforms:
1. Pyrosequencing by Roche Diagnostics
2. Sequencing By Ligation (SBL) or SOLiD sequencing by Applied Biosystems
3. Real Time Sequencing by Pacific Biosciences
BASE CALLING:
Base-calling usually refers to the conversion of intensity data into sequences and quality
scores. Intensity information is extracted from images by the image analysis.
Base-calling has two aspects: Identifying the base-call and assigning a confidence
estimate to the call.
1. Identifying the base-call: Making a base-call is usually based on the intensity estimates.
Signal-processing needs to correct for confounding factors:
Frequency cross-talk (optical detection mechanism)](https://image.slidesharecdn.com/95d6b9e6-9524-4896-9f81-40412e6f80c4-150207034444-conversion-gate02/85/project-9-320.jpg)
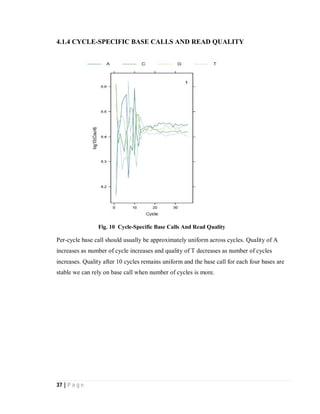
![10 | P a g e
Phasing effects (imperfect chemistry)
Signal decay
2. Assignment of a confidence estimate: Assignment of a confidence estimate or quality
score is vital for downstream analysis phred method can be extended to Next generation
technologies [4].
Below table shows how base calls are made
Fig. 2 Base calling
Although the data produced are similar between platforms, large differences in accuracy
and quality arise which depends on base calling error probability given by phred score.
These differences in data output should be carefully considered when comparing different
platforms on the basis of data quality, depth of sequencing, no of reads produced and cost.
Phred quality scores were originally developed by the program Phred to help in the
automation of DNA sequencing in the Human Genome Project. Phred quality scores are
assigned to each base call in automated sequencer traces. Phred quality scores have become
widely accepted to characterize the quality of DNA sequences, and can be used to compare
the efficacy of different sequencing methods. Perhaps the most important use of Phred
quality scores is the automatic determination of accurate, quality-based consensus
sequences.
Base for which no Phred
score could be calculated.
An example of base that has been
given Phred score of 10 indicating
there is 90% probability that this
base is correctly assigned.](https://image.slidesharecdn.com/95d6b9e6-9524-4896-9f81-40412e6f80c4-150207034444-conversion-gate02/85/project-10-320.jpg)
![11 | P a g e
PHRED QUALITY SCORES
A numeric Phred score represents the error probability of a given base call. When a
nucleotide sequence is produced by sequencing, random error results in the possibility that
any given base call may be incorrect. Thus, a quality score is provided for each base. The
phred score can be calculated from the error probability of a given base call:
phred score=-10*log(error probability)/log(10)
Error
Probability
Phred Score
1 0
0.1 10
0.01 20
0.001 30
0.0001 40
Phred Quality Table
When quality scores are used to represent a long sequence (such as in a fastq file), they are
often represented using the ASCII alphabet, adding the number 33 to Phred scores, and 64 to
Illumina scores (The Illumina pipeline produces phred scores, but uses a different ASCII
offset). For example, a Phred score of 40 can be represented as the ASCII char "I"
(40+33=ASCII #73), and an Illumina score of 40 as "h" (40+64=ASCII #104) [12].
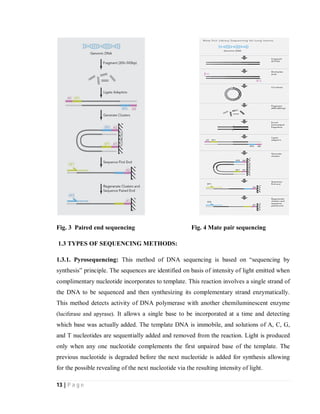
PAIRED-END SEQUENCING
Paired-end sequencing is emerging as a key technique for assessing genome rearrangements
and structural variation on a genome-wide scale. Paired end sequencing is a simple
modification to the standard single-read DNA library preparation which facilitates reading
both the forward and reverse template strands. In addition to sequence information, both
reads contain long range positional information, allowing for highly precise alignment of
reads. This technique is particularly useful for detecting copy-neutral rearrangements, such
as inversions and translocations, which are common in cancer and can produce novel fusion
genes. Paired-end sequencing approach allows for a genome-wide survey of all potential
fusion genes and other rearrangements in a tumor.](https://image.slidesharecdn.com/95d6b9e6-9524-4896-9f81-40412e6f80c4-150207034444-conversion-gate02/85/project-11-320.jpg)
![12 | P a g e
Pair reads are invaluable for short-read data analysis, as a large fraction of short reads are
difficult to map uniquely to the genome, and the second read of a pair can be used to find the
correct location (it is said that the first read is ‘rescued’ by the second).[6]
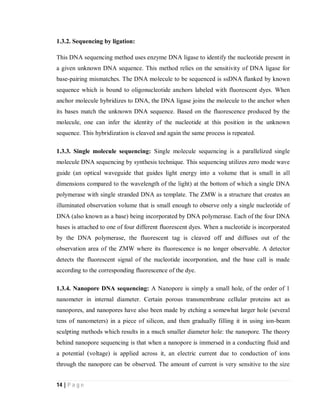
MATE PAIR SEQUENCING
Mate Pair Library Sequencing makes it possible to create libraries with inserts from 2 to 5
kb in size. DNA is fragmented into 2-5kb segments that are end-repaired with biotin labeled
dNTPs. The labeled fragments are circularized and then fragmented again into 400-600bp
pieces. Fragments with the biotin labels are enriched, end-repaired, and ligated with adapters
used for downstream processes. The final mate pair library consists of fragments made up of
two DNA segments that were originally separated by 2-5kb. The mate pair library is
hybridized and amplified onto a flow cell followed by paired-end sequencing.
These long-insert Paired-End libraries are useful for a number of applications, including De
Novo Sequencing, genome finishing, and structural variant detection. Combining data
generated from Mate Pair library sequencing with that from short-insert paired-end reads
provides a powerful combination of read lengths for maximal genomic sequencing coverage
across the genome.
Mate pairs are also typically used to discover structural variants (SVs) regions of the
genome that have undergone large-scale mutations, such as inversions and large insertions
and deletions known as INDELS. Mate pair is more relevant in genome assembly, especially
for covering repetitive sequences [5].
Below is figure which explains steps in paired end and mate sequencing, the difference
between both methods is that mate pair end uses e specific type of libraries (biotinylated
labeled) and then it follows same steps as paired end sequencing. Mate pair allows you to
have your pairs be much farther apart, which can be more informative than the standard
paired-end protocol.](https://image.slidesharecdn.com/95d6b9e6-9524-4896-9f81-40412e6f80c4-150207034444-conversion-gate02/85/project-12-320.jpg)
![16 | P a g e
transcription factors and other chromatin-associated proteins influence phenotype-affecting
mechanisms. It determines how proteins interact with DNA to regulate gene expression and
is essential for understanding mechanism of biological processes and disease states.[10]
1.4.3 Bisulphite-seq: Is the use of bisulfate treatment of DNA to determine its pattern of
methylation. DNA methylation was the first discovered epigenetic mark, and remains the
most studied. In animals it predominantly involves the addition of a methyl group to the
carbon-5 position of cytosine residues of the dinucleotide CpG, and is implicated in
repression of transcriptional activity. [8]
1.4.4 Tn-seq: Tn-seq is used for accurately determining quantitative genetic interactions on
a genome-wide scale in microorganisms. Tn-seq is based on the assembly of a saturated
Mariner transposon insertion library. After library selection, changes in frequency of each
insertion mutant are determined by sequencing of the flanking regions. These changes are
used to calculate each mutant’s fitness. Due to the wide activity of the Mariner transposon,
Tn-seq has the potential to contribute to the exploration of complex pathways across many
different species [1].
1.5 APPLICATIONS OF HIGH-THROUGHPUT SEQUENCING
1.5.1. The 1000 Genomes Project: More genomes need to be sequenced to learn how
genotype correlates with phenotype. A project to sequence 1000 human genomes has been
prepared, which will allow creation of a reference standard for the analysis of human
genomic variations that is expected to contribute to studies of disease and how genotype
correlates with phenotype. [7]
1.5.2. Targeted sequencing: currently we sample whole genome, which is wasteful if we
are interested in a particular genomic region. This approach will allow sequencing only
those portion of genome in which we are interested. [17]
1.5.3. Human Microbiome Project: Also called The Second Human Genome Project,
will focus on analyzing the collection of microbes in and on human body which will](https://image.slidesharecdn.com/95d6b9e6-9524-4896-9f81-40412e6f80c4-150207034444-conversion-gate02/85/project-16-320.jpg)
![17 | P a g e
contribute in understanding human health and disease. Changes in microbial communities
in the body have been generally linked to immune system function, obesity and cancer. In
future, each individual’s microbiome could eventually become a medical biometric. [18]
1.5.4. Metagenomics Project: The novel sequencing technologies will be also useful in
microbial genomics, for example in the metagenomics measuring the genetic diversity
encoded by microbial life in organisms inhabiting a common environment.
An important application is planned by the US DOE Joint Genome Institute (JGI)
which will focus its sequencing efforts on new plant and microbial targets that may
be of use in the development of alternative energies.[19]
The JGI plans to sequence the genome of the marine red alga, which may play an
important environmental role in removing carbon dioxide from the atmosphere.
1.5.5. HapMap Project: This project aims to develop a Haplotype Map (HapMap) of
human genome which will describe common pattern of genetic variation in human. This
project will serve as resource to researchers to find genetic variants affecting health, disease
and responses to drugs and environmental factors. [20]
1.6 ANALYSIS OF RNA Seq DATA
RNA seq experiment results in very large data files. The data analysis involves complex
steps from fastq quality inspection to GO annotation (described later), which form a
pipeline.
For performing analysis on RNA-seq high throughput data, we need high end servers[centos
] for high RAM and fast computational speed.
Many tools, open source as well as commercial, exist for NGS data analysis. Commercial
tools for next generation sequencing include Avadis NGS by strand [16], CLCbio Genomics
Workbench [13], DNANexus [14], and GenomeQues [15]. At global level, many
universities and consortiums have created online as well as downloadable open source tools
for NGS data analysis.
Among the open source tools, R/Bioconductor based tools are very popular. As explained
below, R/Bioconductor provides a comprehensive framework consisting of thousands of](https://image.slidesharecdn.com/95d6b9e6-9524-4896-9f81-40412e6f80c4-150207034444-conversion-gate02/85/project-17-320.jpg)
![19 | P a g e
R is designed around a true computer language, and it allows users to add additional
functionality by defining new functions. For computationally-intensive tasks, C, C++ and
FORTRAN code can be linked and called at run time. Advanced users can write C code to
manipulate R objects directly.
1.7.1 BIOCONDUCTOR:
Bioconductor is an open development project, contributed by the global scientific
community. Within the framework of R package, developers create and add libraries for
specific applications following package guidelines to make it easier for others to use and
extend the software. Bioconductor [26,27] is an organized effort by the global biology
community that provides libraries and tools within the R framework for the comprehensive
analysis of data from bioinformatics experiments. Bioconductor uses the R statistical
programming language, and is open source and open development.
Bioconductor can import diverse sequence-related file types, including fasta, fastq, BAM,
gff, bed, and wig files, among others. Packages support common and advanced sequence
manipulation operations such as trimming, transformation, and alignment. Domain-specific
analyses include quality assessment, ChIP-seq, differential expression, RNA-seq, and other
approaches.
Bioconductor has extensive facilities for mapping between microarray probe, gene, pathway,
gene ontology, homology and other annotations. Bioconductor has built-in representations
of GO, KEGG, vendor, and other annotations, and can easily access NCBI, BiomaRt,
UCSC, and other sources. Bioconductor libraries make extensive use of R graphics facilities
for creating sophisticated plots required for NGS data display. Therefore, R/Bioconductor
framework is the natural choice for the developmental platform in our pipeline.
1.7.2 BIOCONDUCTOR PACKAGES USED IN THIS PIPELINE
Biostrings: The Biostrings package from Bioconductor provides an advanced environment
for efficient sequence management and analysis in R. It contains many speed and memory
effective string containers, string matching algorithms, and other utilities, for fast](https://image.slidesharecdn.com/95d6b9e6-9524-4896-9f81-40412e6f80c4-150207034444-conversion-gate02/85/project-19-320.jpg)
![20 | P a g e
manipulation of large sets of biological sequences. The objects and functions provided by
Biostrings form the basis for many other sequence analysis packages [21].
ShortRead: The ShortRead package provides input, quality control, filtering, parsing, and
manipulation functionality for short read sequences produced by high throughput
sequencing technologies. While support is provided for many sequencing technologies, this
package is primarily focused on Solexa/Illumina reads [22].
GoSeq: Detects Gene Ontology or other user defined categories which are over/under
represented in RNA-seq data. We can obtain all gene ontology (GO) categories associated
with a set of genes using the relevant organism package. GoSeq is a package for performing
Gene Ontology (GO) analysis on RNA-seq data. GO analysis is widely used to reduce
complexity and highlight biological processes in genome-wide expression studies, but
standard methods give biased results on RNA-seq data due to over-detection of differential
expression for long and highly expressed transcripts. Application of GoSeq to a prostate
cancer data set shows that GoSeq dramatically changes the results, highlighting categories
more consistent with the known biology [23].
SRAdb: High throughput sequencing technologies have very rapidly become standard tools
in biology. The data that these machines generate are large, extremely rich. As such, the
Sequence Read Archives (SRA) has been set up at to store these data in public repositories
in much the same spirit as microarray databases like NCBI GEO and EBI ArrayExpress.
Accessing data in SRA requires finding it first and this R package provides a convenient and
powerful framework to do that. In addition, SRAdb features functionality to determine
availability of sequence files and to download files of interest [24].
BiomaRt package: In recent years a huge number of biological database have been
available in public repositories. Easy access to these valuable data resources and firm
integration with data analysis is needed for comprehensive bioinformatics data analysis.
This package provides an interface to a growing collection of databases implementing the
BiomaRt software suit. The software package enables retrieval of large amount of data in a](https://image.slidesharecdn.com/95d6b9e6-9524-4896-9f81-40412e6f80c4-150207034444-conversion-gate02/85/project-20-320.jpg)
![21 | P a g e
uniform way without the need to know the underlying database schemas or write complex
SQL queries. Examples of BiomaRt databases are Ensembl, Uniprot and HapMap.
These major databases give biomaRt users direct access to a diverse set of data and enable a
wide range of powerful online queries from R. BiomaRt databases can contain several
datasets, for Ensembl every species is a different dataset [25].](https://image.slidesharecdn.com/95d6b9e6-9524-4896-9f81-40412e6f80c4-150207034444-conversion-gate02/85/project-21-320.jpg)
![22 | P a g e
CHAPTER II
2.1 BACKGROUND
Prostate cancer illumina NGS data is analyzed using R-statistical package. Short reads of
normal and cancer cells of prostate were retrieved from NCBI SRA with accession number
SRX022060, SRX022061, SRX022063, SRX022080, SRX022081 and SRX022083[28].
These SRA reads are in fastq format with base call and assigned probability (phred score).
Converting these fastq files to SAM format using Bowtie to generate counts file. These
counts file will be utilized as input file for differential expression analysis. In background
we will see file formats, assembly methods, assembly algorithm and mapping algorithm.
2.2. FILE FORMATS
1.1 FASTQ: FASTQ has emerged as a common file format for sharing sequencing read
data combining both the sequence and an associated per base quality score. Ii is s a test
based format for storing biological sequence obtained from NGS. Both nucleotides and
score are encoded with a single ASCII character. It has become the de facto standard format
for storing the output of high throughput sequencing instruments such as illumina Genome
Analyzer.
A FASTQ file normally uses four lines per sequence. Line 1 begins with a '@' character and
is followed by a sequence identifier and an optional description (like a FASTA title line).
Line 2 is the raw sequence letters. Line 3 begins with a '+' character and is optionally
followed by the same sequence identifier (and any description) again. Line 4 encodes the
quality values for the sequence in Line 2, and must contain the same number of symbols as
letters in the sequence.
@HWUSI-EAS582_157:6:1:1:1501/1
NCACAGACACACACGAACACACAAAGACATGCCCATATGAAGAT
+
%.7786867:778556858746575058873/347777476035](https://image.slidesharecdn.com/95d6b9e6-9524-4896-9f81-40412e6f80c4-150207034444-conversion-gate02/85/project-22-320.jpg)
![24 | P a g e
Usually, a genome is chosen as the reference only if the similarity between it and the target
genome is close to 100%. This restriction leads to quite limited application of the
comparative assembly. In our study we choose NCBI36 Hg18 as reference most of them
aligned to reference but some of them were rejected.
2.4. ASSEMBLY ALGORITHMS:
There are two basic approaches in algorithms for short-read assemblers: overlap graphs and
de Bruijn graph.
2.4.1 OVERLAP GRAPH: Most assemblers that were developed for Sanger reads follow
the overlap-layout-consensus paradigm. They compute all pair-wise overlap between reads
and store this information as a graph. Each node in the graph corresponds to a read and an
edge denotes an overlap between two reads. The overlap graph is used to compute a layout
of reads and consensus sequence of contigs. This method works best when there is limited
number of reads with significant overlap. Some ngs assembler use this technique but this
method is computationally expensive because large number of reads make overlap graph
very large. [Fig.5 ][11]
2.4.2 de Bruijn GRAPH: As overlap graphs do not scale with increasing number of reads,
most of ngs assembler use de Bruijn graphs. De Bruijn graphs reduce the computational
effort by breaking reads into smaller sequences of DNA, called k-mers where k denotes the
length in bases of these sequences. The de Bruijn graph finds overlaps of k-1 length between
these k-mers and not between the actual reads. The maximum efficient k-mer size for a
particular assembly is determined by the read length as well as error rate. The value of
parameter k has significant influence on the quality of assembly. Estimate of good values
can be made before assembly, but often the optimal value is best found by testing a small
range of values. Another property of de Bruijn it is that repeats in the genome can be
collapsed in graph and do not lead to many overlaps, although this doesn’t mean that they
can be more bridged or resolved [fig.5 ] [26].](https://image.slidesharecdn.com/95d6b9e6-9524-4896-9f81-40412e6f80c4-150207034444-conversion-gate02/85/project-24-320.jpg)
![25 | P a g e
Fig. 5. Overlap graph and de bruijn graph
2.5. Mapping:
Genome mapping is assigning/locating of a specific gene to particular region of a
chromosome and determining the location of and relative distances between genes on the
chromosome. One of the most basic tasks in NGS analysis is the alignment of reads to either
a reference genome or transcriptome.
There are two major algorithmic approaches to map RNA-seq reads to a reference
transcriptome. The first, to which we collectively refer as ‘unspliced read aligners’ align
reads to a reference without allowing any large gaps. The unspliced read aligners fall into
two main categories, ‘Seed methods’ and ‘Burrows-Wheeler transform methods’.
2.5.1. Seed methods such as mapping and assembly with quality (MAQ) and Stampy find
matches for short subsequences, termed ‘seeds’, assuming that at least one seed in a read
will perfectly match the reference. Each seed is used to narrow candidate regions where
more sensitive methods (such as Smith-Waterman) can be applied to extend seeds to full
alignments [1].
2.5.2. In contrast, the second approach includes Burrows-Wheeler transform methods
such as Burrows-Wheeler alignment (BWA) and Bowtie, which compact the genome into a
data structure that is very efficient when searching for perfect matches. When allowing](https://image.slidesharecdn.com/95d6b9e6-9524-4896-9f81-40412e6f80c4-150207034444-conversion-gate02/85/project-25-320.jpg)
![26 | P a g e
mismatches, the performance of Burrows-Wheeler transform methods decreases
exponentially with the number of mismatches as they iteratively perform perfect searches.
Unspliced read aligners are ideal for mapping reads against a reference cDNA databases for
quantification purposes. If the exact reference transcriptome is available, Burrows-Wheeler
methods are faster than seed-based methods. In contrast, when only the reference
transcriptome of a distant species is available, ‘seed methods’ can result in a large increase
in sensitivity [1].
2.6 DEFINITION OF TERMS:
MPSS: Massive parallel sequencing encompasses several high-throughput approaches to
DNA sequencing; it is also called next-generation sequencing (NGS) or second-generation
sequencing.
Deep sequencing: Depth in DNA sequencing refers to the number of times a nucleotide is
read during the sequencing process. Deep sequencing indicates that the coverage, or depth,
of the process is many times larger than the length of the sequence under study. The term
"deep" has been used for a wide range of depths (>7x) and the newer term "ultra-deep" has
appeared in the scientific literature to refer to even higher coverage (>100x).
Coverage: Coverage is the average number of reads representing a given nucleotide in the
reconstructed sequence.
Contigs: A contigs is a contiguous, overlapping sequence read resulting from the
reassembly of the small DNA fragments generated by sequencing. Contigs refers to the
overlapping clones that form a physical map of the genome that is used to guide sequencing
and assembly. Contigs can thus refer both to overlapping DNA sequence and to overlapping
physical segments (fragments) contained in clones depending on the context.
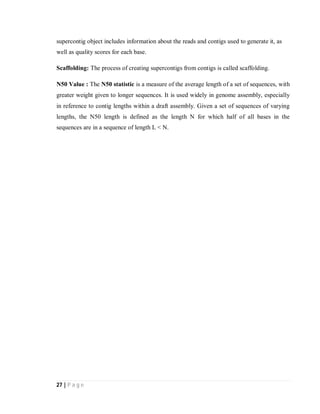
Supercontigs: A supercontig, also known as a super or a scaffold, is the largest type of
object in an assembly. A supercontig consists of one or more contigs bound together. The](https://image.slidesharecdn.com/95d6b9e6-9524-4896-9f81-40412e6f80c4-150207034444-conversion-gate02/85/project-26-320.jpg)
![28 | P a g e
CHAPTER III
3.1 AIM AND OBJECTIVES
Next Generation Sequencing is able to generate huge amounts of DNA sequence reads and
the major challenge is to handle such a large data efficiently. In this work we aim to develop
a method exploiting all available information to accurately align as many as possible spliced
sequence reads to the genome.
The data contains not only the DNA sequence of the read and the genome, but also quality
information associated with the read and predictions about potential splice sites within the
genome. The pipeline will produce some plots regarding statistics of reads and contigs. In
our work we extend the analysis method to also benefit from the read’s quality score. We
also removed bad quality base calls from reads in by trimming fastq file and found better
alignment with genomic regions. This information can help to decide at which positions one
can expect to observe mismatches and subsequently contribute to the identification of the
correct alignment.
In our work we used R package to perform powerful statistical methods to carry out data
processing for analyzing differential expression analysis, isoform, small RNA profiling. We
also analyzed short reads to detect whether we can perform de-novo assembly using RNA
data. We designed a fully functional automated pipeline which uses Bioconductor libraries
to analyze HTS data. Analysis can be carried on various statistical methods such as negative
binomial, Bayesian and exact test. We assembled reads both de-novo and by mapping to
genome. After de novo assembly we analyzed contigs for various biological mechanisms
such as intron retention, alternative splicing etc. In second method we mapped using bowtie
and aggregated reads count which were uniquely mapped to genome to find differentially
expressed genes.
This pipeline will also be annotating reads and will provide information regarding which
biological pathway they belong and to which portion they interact. BiomarRt package is
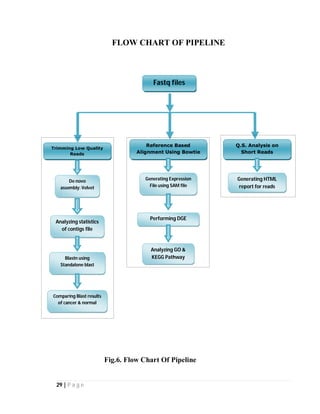
used for annotation purpose and for describing KEGG pathway. The flowchart of the
pipeline is given in Figure [3]. We will now describe each component in detail.](https://image.slidesharecdn.com/95d6b9e6-9524-4896-9f81-40412e6f80c4-150207034444-conversion-gate02/85/project-28-320.jpg)
![31 | P a g e
from large amounts of short-read sequences, then used an enumeration algorithm to score all
possible paths and branches, and retained those plausible ones as transcripts/isoforms.
Velvet is specially programmed to recover paths supported by actual reads and remove
ambiguous/erroneous edges, thus ensuring correct transcript reconstruction.
Command :
Hash length: 31
Input file: .Fastq Output: contigs.fa
3.2.4. ANALYZING STATISTICS OF CONTIGS FILE:
Statistical analysis of contigs file is necessary to know the quality of contigs produced by de
novo assembler is of any importance, whether the contigs aligned are of good length with
good quality score. Statistical analysis is an important step while performing de novo
assembly as it reveals statistical significance that contigs produced can be used for further
analysis or we should map the reads with some reference genome.
We got plots named below:
Histogram, weighted histogram and dinucleotide Frequency
3.2.5. PERFORMING STANDALONE BLAST
After performing and analyzing velvet output we carried out mapping of genomic segments
(i.e. contigs) to refseq database using standalone Blast. First of all we downloaded refseq
fasta file from NCBI and formatted them to be used as database.
Command:
For Buiding Database:
Makeblastdb –in <fasta_file> -dbtype –out <output_db_filename>
For Performing Blast:
Blastn –query <fasta_file> -db <database_name> -out <output_file>
./velveth output_directory hash_length [[-file_format][-read_type] filename]
./ velvetg output_directory coverage_cutoff](https://image.slidesharecdn.com/95d6b9e6-9524-4896-9f81-40412e6f80c4-150207034444-conversion-gate02/85/project-31-320.jpg)
![34 | P a g e
CHAPTER IV
RESULTS OF A REPRESENTATIVE ANALYSIS
We tested our pipeline by RNA seq Prostate cancer data with SRA accession number
SRX022060, SRX022061, SRX022063, SRX022080, SRX022081 and SRX022083[28] and
below are plots, expression profiling results and GO terms obtained as output of pipeline.
4.1. FASTQ QUALITY INSPECTION
4.1.1 OVERALL READ QUALITY:
Fig.7 Overall Read Quality
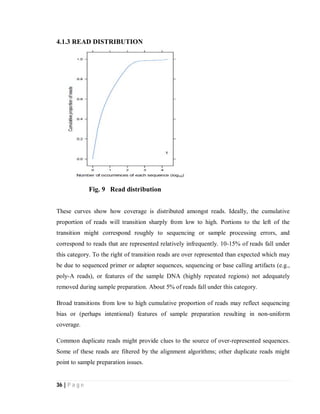
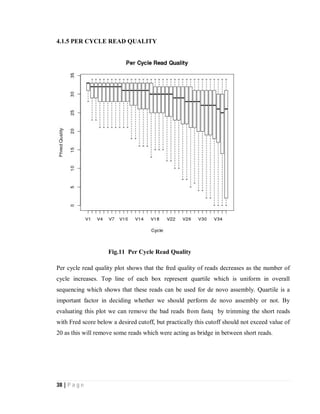
Lanes with consistently good quality reads have strong peaks at the right of the panel. Most
of reads are above QS (Quality Score) 20 they can be considered as good quality reads. We
can trim low quality reads by putting a cutoff below 10 because when we trimmed reads
with QS less than 20 we obtained less number of contigs as some of eliminated reads were
needed for filling gaps. We have analyzed QS for every fastq files and found a strong peak
after base call 20.](https://image.slidesharecdn.com/95d6b9e6-9524-4896-9f81-40412e6f80c4-150207034444-conversion-gate02/85/project-34-320.jpg)
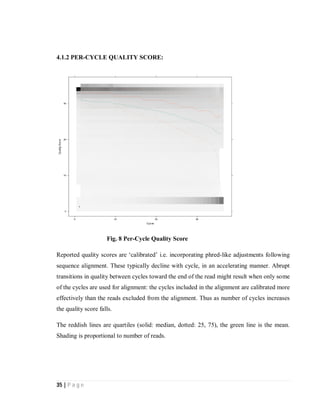
![39 | P a g e
4.2. ANALYZING STATISTICS OF CONTIGS FILE
4.2.1 Histogram of contigs coverage Weighted histogram of contigs coverage
Fig. 9 Histogram and weighted histogram of contigs coverage
Above histograms show the coverage of contigs for RNA-seq of data of 3 normal and 3
cancer samples taken from NCBI SRA [28]. In the weighted histogram on left side low
coverage is not observed and all contigs are of good coverage.
4.2.2Dinucleotide frequency:
Fig 13 Dinucleotide frequency
This plot describes dinucleotide frequency in samples.](https://image.slidesharecdn.com/95d6b9e6-9524-4896-9f81-40412e6f80c4-150207034444-conversion-gate02/85/project-39-320.jpg)
![45 | P a g e
REFERENCES
[1] Elaine R. Mardis , “Next-Generation DNA Sequencing Methods” Departments of
Genetics and Molecular Microbiology and Genome Sequencing Center, Washington
University School of Medicine, St. Louis
[2] “A haplotype map of the human genome”, The International HapMap Consortium,
Nature 437, 1299-1320 (27 October 2005) | doi:10.1038/nature04226; Received 11 August
2005; Accepted 12 September 2005
[3] Figure for decreasing cost From: National Human Research Institute
[4]Short note on base calling, http://www.ebi.ac.uk/industry/Documents/workshop-
materials/newsequence291009/Basecalling-Klaus_Maisinger.pdf
[5] http://www.illumina.com/technology/paired_end_sequencing_assay.ilmn
[6] http://www.illumina.com/technology/mate_pair_sequencing_assay.ilmn
[7] 1000 Genomes Project reveals human variation.
http://www.nature.com/news/2010/101027/full/news.2010.567.html
[8] http://www.biomedcentral.com/1471-2105/10/232
[9] Tim van Opijnen, Kip L. Bodi, and Andrew Camilli,“Tn-seq; high-throughput parallel
sequencing for fitness and genetic interaction studies in microorganisms.”
[10] http://www.plosone.org/article/info:doi%2F10.1371%2Fjournal.pone.0006589
[11] A memory-efficient data structure representing exact-match overlap graphs with
application for next generation DNA assembly
http://bioinformatics.oxfordjournals.org/content/early/2011/06/02/bioinformatics.btr321
[12] http://manuals.bioinformatics.ucr.edu/home/ht-seq
[13] http://www.clcbio.com/index.php?id=1240
[14] https://dnanexus.com/](https://image.slidesharecdn.com/95d6b9e6-9524-4896-9f81-40412e6f80c4-150207034444-conversion-gate02/85/project-45-320.jpg)
![46 | P a g e
[15] http://www.genomequest.com/
[16] http://www.strandsi.com/AvadisNGS
[17] http://www.raindancetechnologies.com/applications/next-generation-sequencing-
technology.asp
[18] http://www.nature.com/nature/journal/v449/n7164/full/nature06244.html
[19] http://www.nature.com/nature/journal/v453/n7195/full/453687a.html
[20] http://www.nature.com/nature/journal/v437/n7063/edsumm/e051027-01.html
[21] http://www.bioconductor.org/packages/2.9/bioc/html/Biostrings.html
[22 ] http://www.bioconductor.org/packages/2.9/bioc/html/ShortRead.html
[23] http://bioinf.wehi.edu.au/software/goseq/
[24] http://www.bioconductor.org/packages/2.9/bioc/html/SRAdb.html
[25] http://www.bioconductor.org/packages/2.2/bioc/html/biomaRt.html
[26,27] http://www.bioconductor.org/
http://manuals.bioinformatics.ucr.edu/home/R_BioCondManual
[28] Recurrent chimeric RNAs enriched in human prostate cancer identified by deep
sequencing. http://www.ncbi.nlm.nih.gov/pubmed/21571633](https://image.slidesharecdn.com/95d6b9e6-9524-4896-9f81-40412e6f80c4-150207034444-conversion-gate02/85/project-46-320.jpg)