Download to read offline
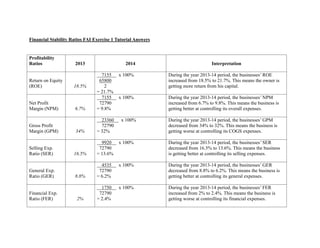

The document analyzes various financial ratios for a business between 2013 and 2014 including profitability ratios, stability ratios, and turnover ratios. It finds that the business' return on equity, net profit margin, selling expense ratio, general expense ratio, total debt ratio, stock turnover, and interest coverage ratio improved between 2013 and 2014, while its gross profit margin, working capital ratio, and debtor turnover ratio worsened over this period.


![Principle of Economics [ECN 30205] - A Tale of Two Businesses](https://cdn.slidesharecdn.com/ss_thumbnails/full2-150124195533-conversion-gate01-thumbnail.jpg?width=640&height=640&fit=bounds)


