Download to read offline
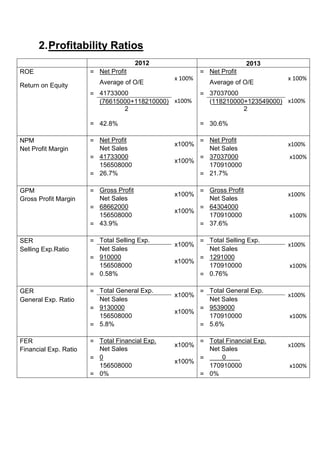
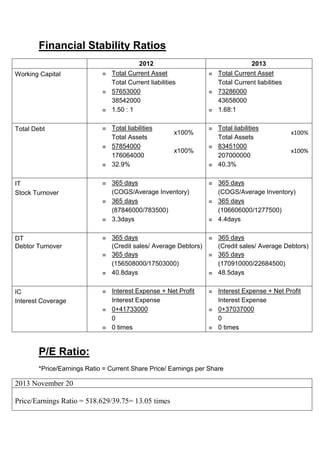

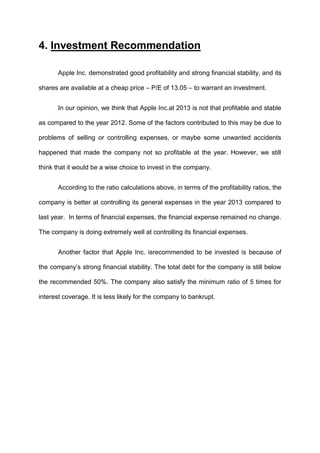
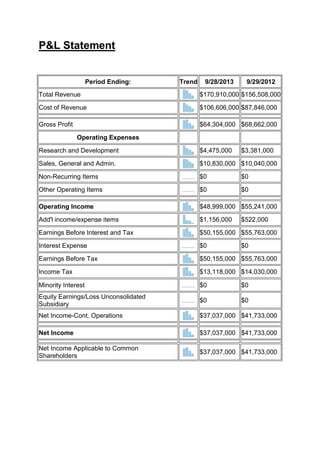
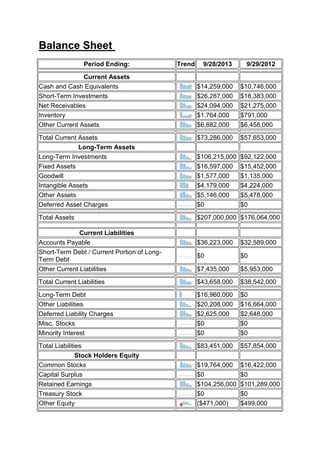
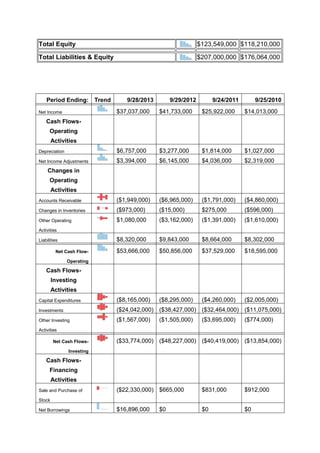
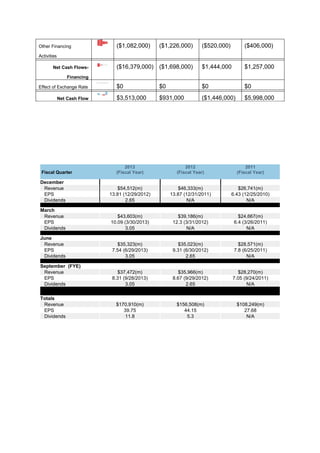

The document is an analysis report on Apple Inc. prepared by Lim Zhen Wei and TheanHaiXu. It includes a company background, ratio calculations for profitability, financial stability and price/earnings, an interpretation of the ratio results, an investment recommendation, and Apple's financial statements including the income statement, balance sheet and cash flow statement for 2012-2013. The ratios show a decline in profitability from 2012 to 2013 but overall financial stability remains strong, supporting an investment in the company given its low price/earnings ratio of 13.05.


![5G Explained! A High Level Overview [Introduction]](https://cdn.slidesharecdn.com/ss_thumbnails/5gexplainedahighleveloverview-260119165306-cc137a3e-thumbnail.jpg?width=640&height=640&fit=bounds)


