Download as PDF, PPTX


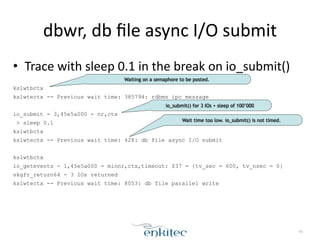
![dbwr,
db
file
async
I/O
submit
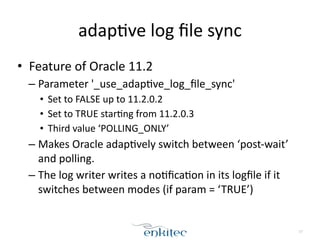
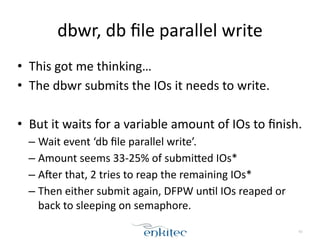
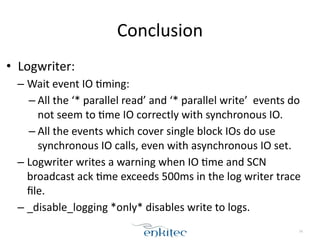
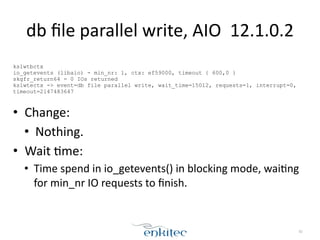
• My
Oracle
Support
on
“db
file
async
I/O
submit”:
!
'db file async I/O submit' when FILESYSTEMIO_OPTIONS=NONE
[Article ID 1274737.1]
How To Address High Wait Times for the 'Direct Path Write Temp ' Wait Event
[Article ID 1576956.1]
!
• Both
don’t
describe
what
this
event
is.
• 1st
note
is
only
for
filesystemio_op;ons=NONE
and
describes
the
event
not
being
tracked
prior
to
version
11.2.0.2.
53](https://image.slidesharecdn.com/profilingthelogwriteranddatabasewriter-141017101150-conversion-gate02/85/Profiling-the-logwriter-and-database-writer-53-320.jpg)

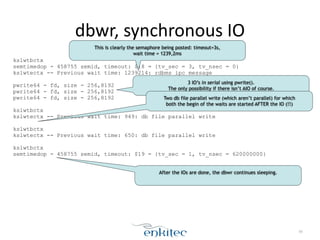
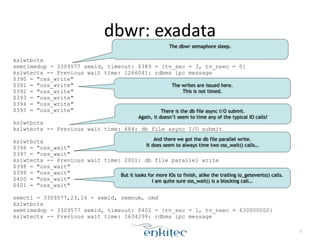

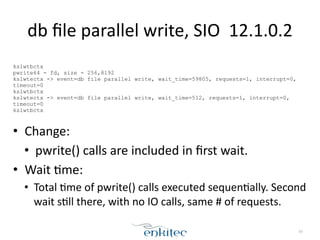


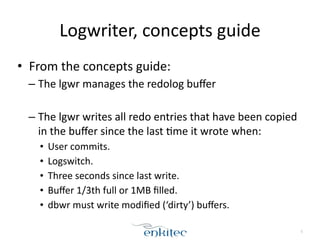
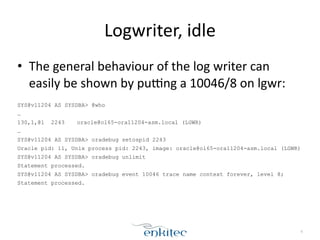
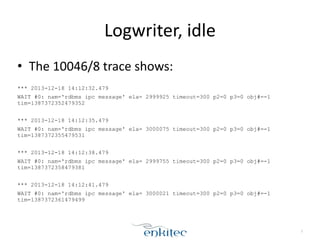
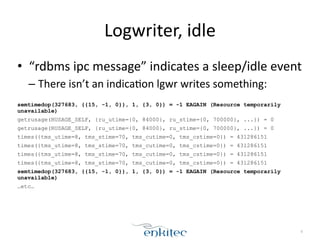
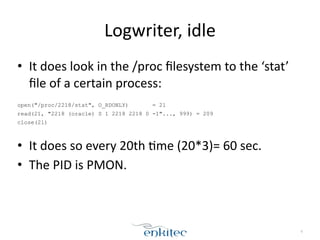
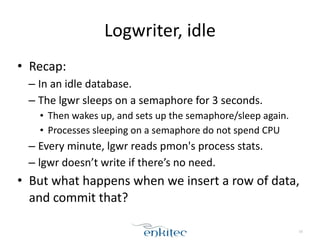
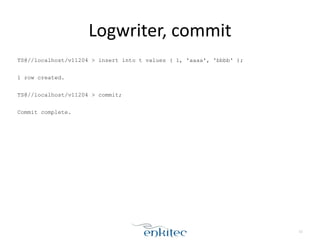
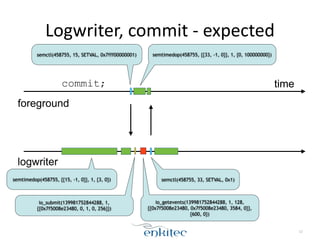
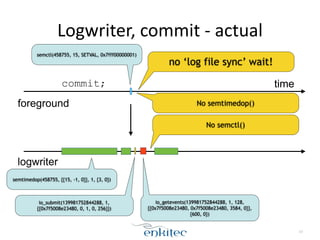
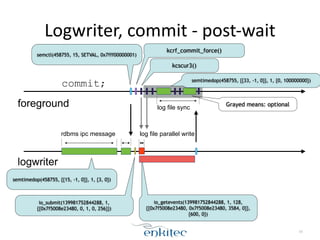
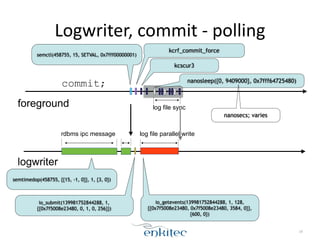
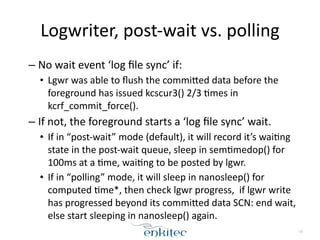
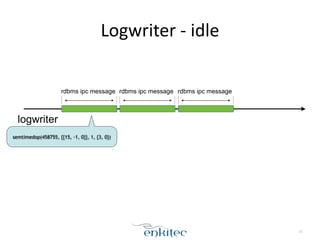
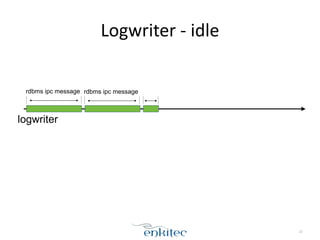
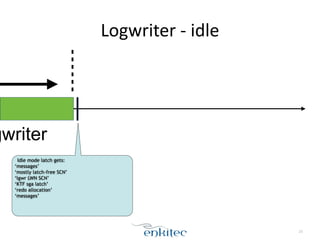
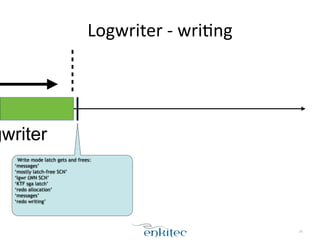
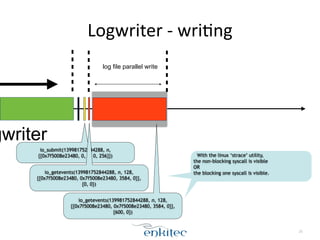
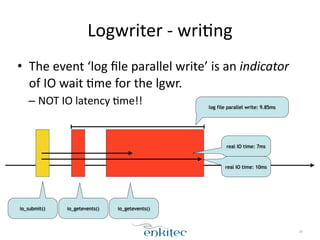
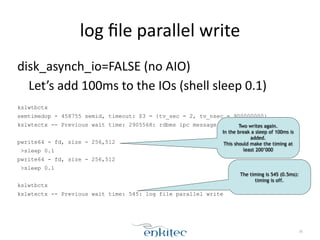
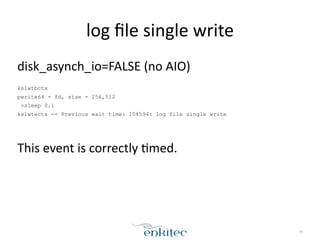
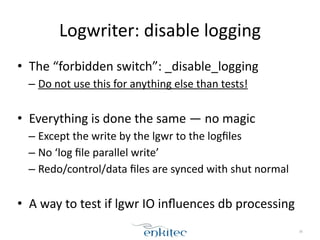
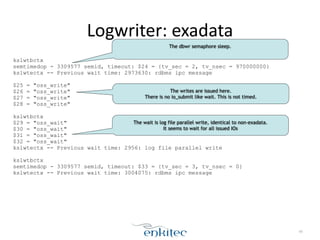
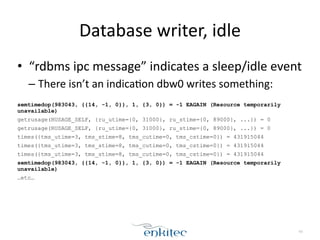
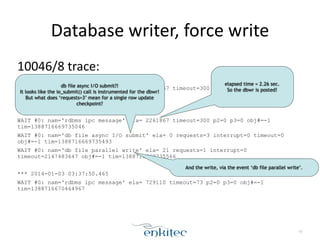
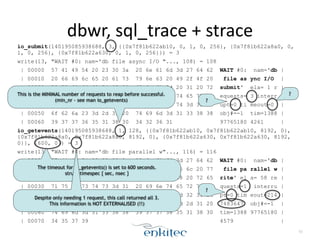
The document discusses the behavior of the Oracle log writer (LGWR) process under different conditions. In idle mode, LGWR sleeps for 3 seconds at a time on a semaphore without writing to the redo log buffer. When a transaction is committed, LGWR may write the committed redo entries to disk either before or after the foreground process waits on a "log file sync" event, depending on whether LGWR has already flushed the data. The document also compares the "post-wait" and "polling" modes used for the log file sync wait.


![Oracle Open World 2014: Lies, Damned Lies, and I/O Statistics [ CON3671]](https://cdn.slidesharecdn.com/ss_thumbnails/thursday115ionfs-141107125307-conversion-gate02-thumbnail.jpg?width=640&height=640&fit=bounds)


