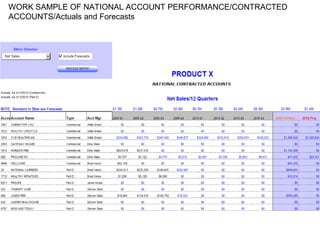
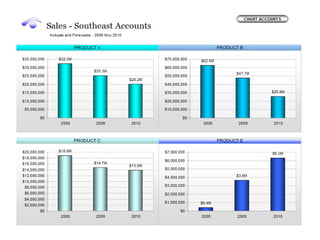
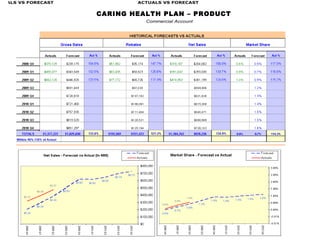
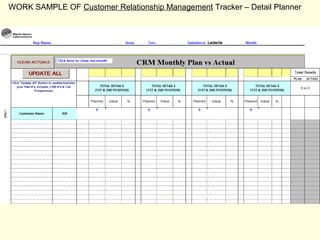
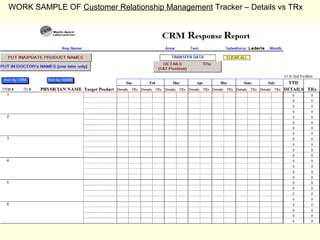
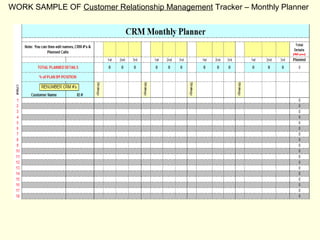
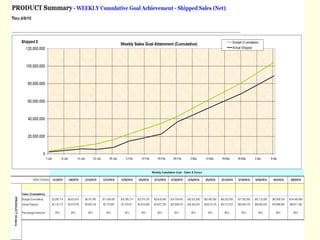
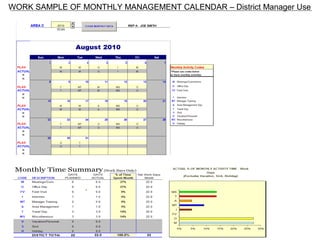
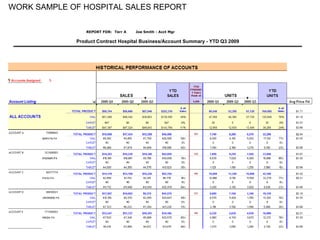
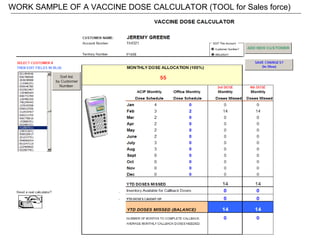
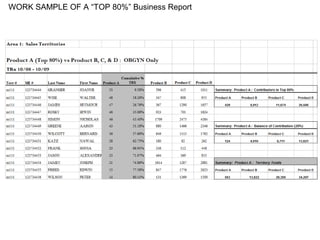
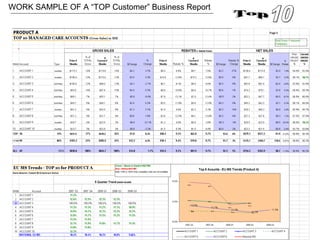
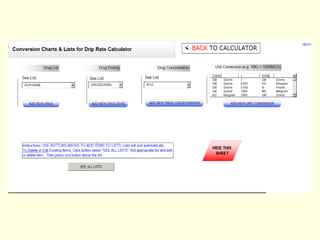
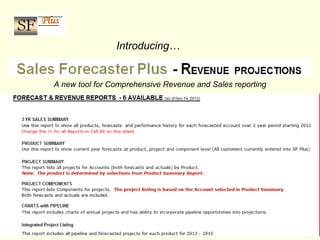
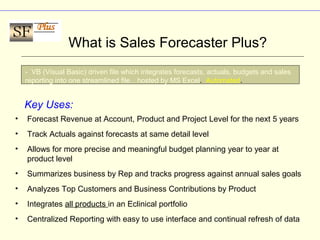
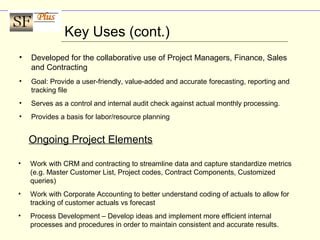
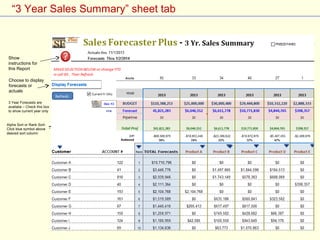
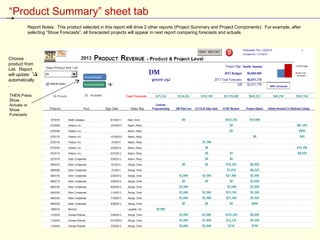
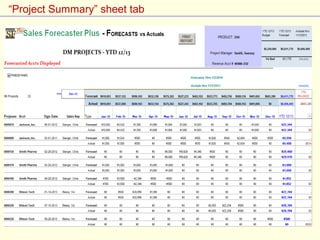
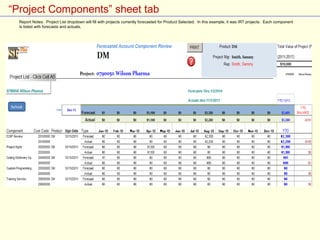
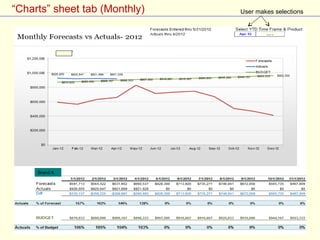
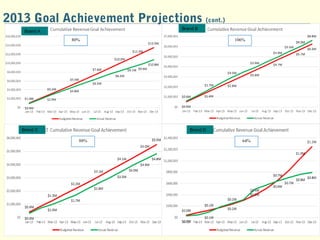
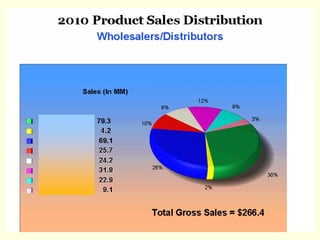
27. • Forecast Revenue at Account, Product and Project Level for the next 5 years
• Track Actuals against forecasts at same detail level
• Allows for more precise and meaningful budget planning year to year at
product level
• Summarizes business by Rep and tracks progress against annual sales goals
• Analyzes Top Customers and Business Contributions by Product
• Integrates all products in an Eclinical portfolio
• Centralized Reporting with easy to use interface and continual refresh of data
What is Sales Forecaster Plus?
Key Uses:
- VB (Visual Basic) driven file which integrates forecasts, actuals, budgets and sales
reporting into one streamlined file…hosted by MS Excel. Automated.
28. Key Uses (cont.)
• Developed for the collaborative use of Project Managers, Finance, Sales
and Contracting
• Goal: Provide a user-friendly, value-added and accurate forecasting, reporting and
tracking file
• Serves as a control and internal audit check against actual monthly processing.
• Provides a basis for labor/resource planning
Ongoing Project Elements
• Work with CRM and contracting to streamline data and capture standardize metrics
(e.g. Master Customer List, Project codes, Contract Components, Customized
queries)
• Work with Corporate Accounting to better understand coding of actuals to allow for
tracking of customer actuals vs forecast
• Process Development – Develop ideas and implement more efficient internal
processes and procedures in order to maintain consistent and accurate results.
29. 29
KEY DATA SOURCES
CRM – Signings queries (opportunities)
•SalesforecasterPlus – populated with actual contracts signed in CRM.
•Forecast initially entered based upon actual physical contract and
interpretation of components and billing timeframe
Service Revenue File from Corporate Accounting
• Lists all revenue entries by month, project and component (cost code). This
data is cleaned and summarized in SFPlus and used to capture “actuals”.
•Future goal is to export this data directly from internal system.
30. 30
“Behind the Numbers” (cont.)
• DATA GATHERING – Requested new query design from CRM (Contracting
Team) which provided one product per project on single line. This enabled us to
determine actual value of signing at product and project level.
Previously multiple projects would appear on line under any given project.
Each line has one product
assigned at project level
• Revenue Service File – Cleaned and assigned coding necessary to integrate with
SFPlus reports for purpose of “actuals” reporting.
32. “3 Year Sales Summary” sheet tab
Choose to display
forecasts or
actuals
3 Year Forecasts are
availabe – Check this box
to show current year only
Alpha Sort or Rank Sort-
Click blue symbol above
desired sort column
Show
instructions for
this Report
33. “Product Summary” sheet tab
THEN Press
Show
Actuals or
Show
Forecasts
Report Notes: This product selected in this report will drive 2 other reports (Project Summary and Project Components). For example, after
selecting “Show Forecasts”, all forecasted projects will appear in next report comparing forecasts and actuals.
Choose
product from
List. Report
will update
automatically
.
35. “Project Components” sheet tab
Report Notes: Project List dropdown will fill with projects currently forecasted for Product Selected. In this example, it was IRT projects. Each component
is listed with forecasts and actuals.
39. An Actuarial Analysis of
Retirement Goals and Risks
A New Tool For Comprehensive Financial
Planning Professionals
COPYRIGHT 2009 JACK P PAUL
ACTUARY LLC
Probability Distributions for
Retirement Planning
PDRP Plus
40. COPYRIGHT 2009 JACK P PAUL
ACTUARY LLC
Sample Chart of Client’s Projected Range of Long-Term
Care Costs
Sample 65 year old
single male who is
insurable at standard
rates for long-term care
insurance.
He has chosen a plan of
long-term care that costs
well above the national
average, should he need
it.
Probability
Amount of Assets Set Aside Won’t
Exceed:
1% 0
5% 0
10% 0
15% 0
20% 0
25% 0
30% 0
35% 0
40% 0
45% 3,000
50% 5,000
55% 11,000
60% 19,000
65% 30,000
70% 42,000
75% 58,000
80% 80,000
85% 114,000
90% 160,000
95% 238,000
99% 462,000
99.50% 534,000
Chart displays the Probabilities that the Future Long-Term Care
Costs of the Client Will Be Met By Setting Aside Certain Levels of
Assets (displayed before tax)