Download to read offline
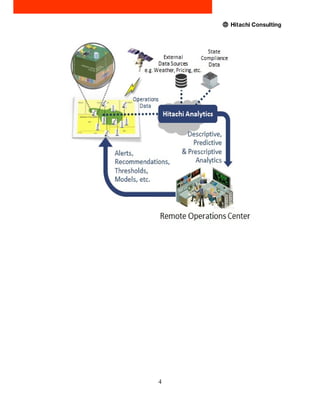

This white paper proposes a Rig-in-a-Box (RIAB) solution for digital oil fields. The RIAB would use Hitachi's HHAP analytics framework to remotely monitor and manage end-to-end oil and gas operations, initially focusing on upstream activities like exploration, drilling, completions, and production. The solution would provide a thin client interface for quick access from remote operations centers or mobile devices. It presents challenges in the oil and gas domain like reducing non-productive time and improving efficiencies. The proposed RIAB solution would use descriptive, predictive, and prescriptive analytics to address these challenges. It would have a production system dashboard to monitor operations and key performance indicators.


![Images[smallpdf.com]](https://cdn.slidesharecdn.com/ss_thumbnails/imagessmallpdf-140524160652-phpapp02-thumbnail.jpg?width=640&height=640&fit=bounds)


