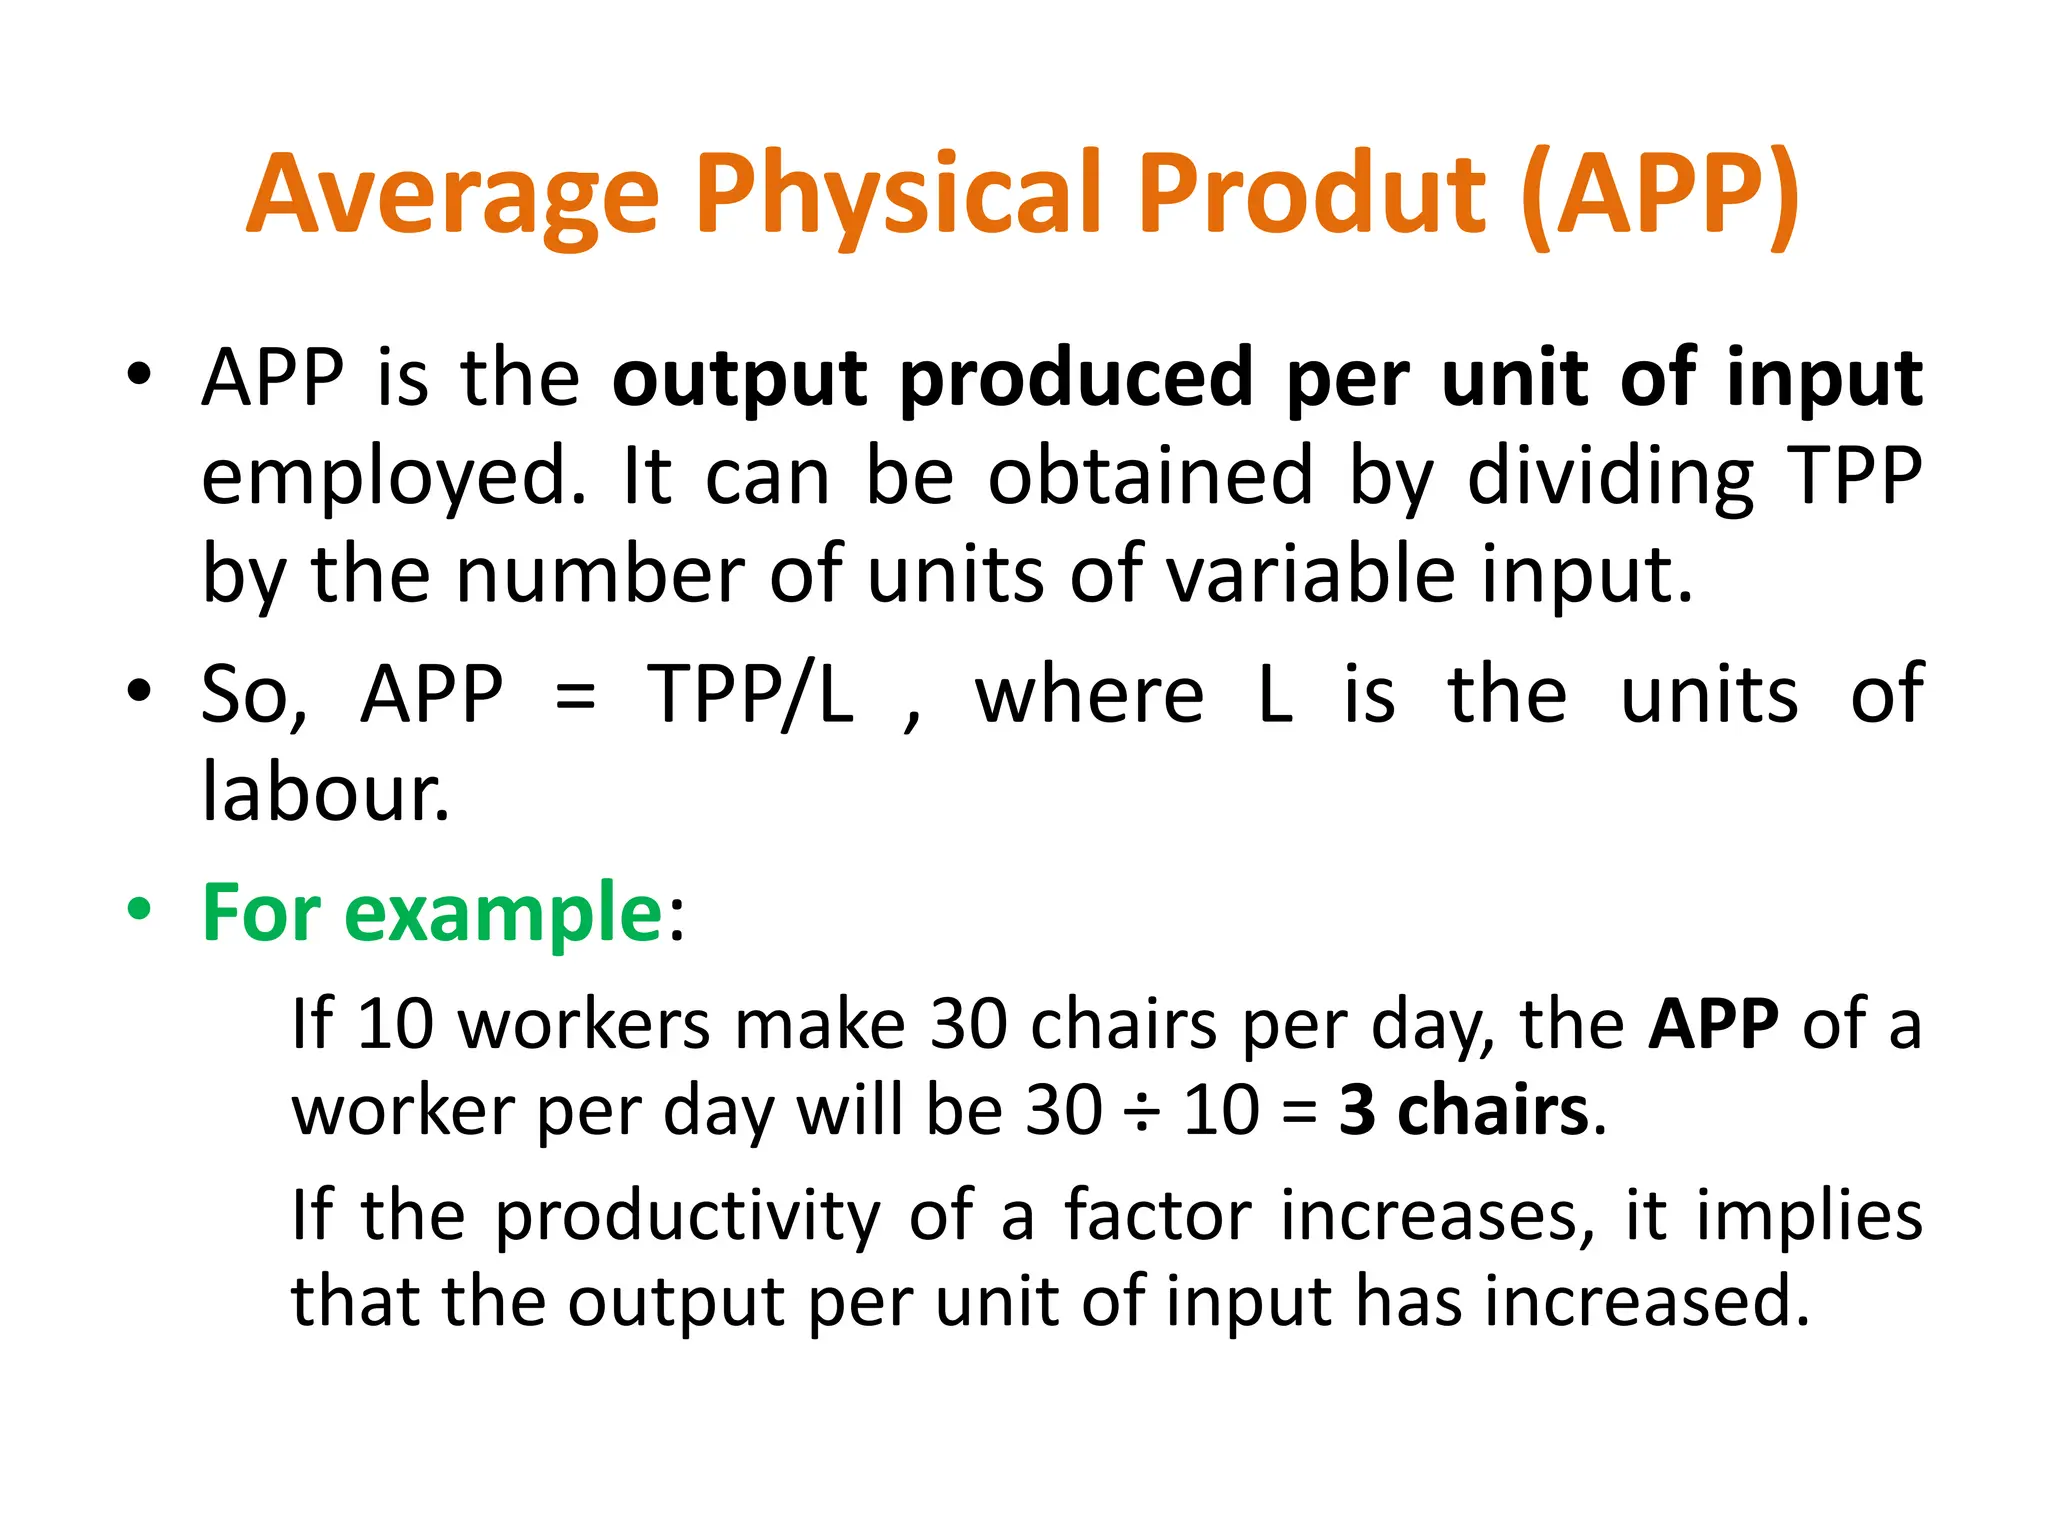
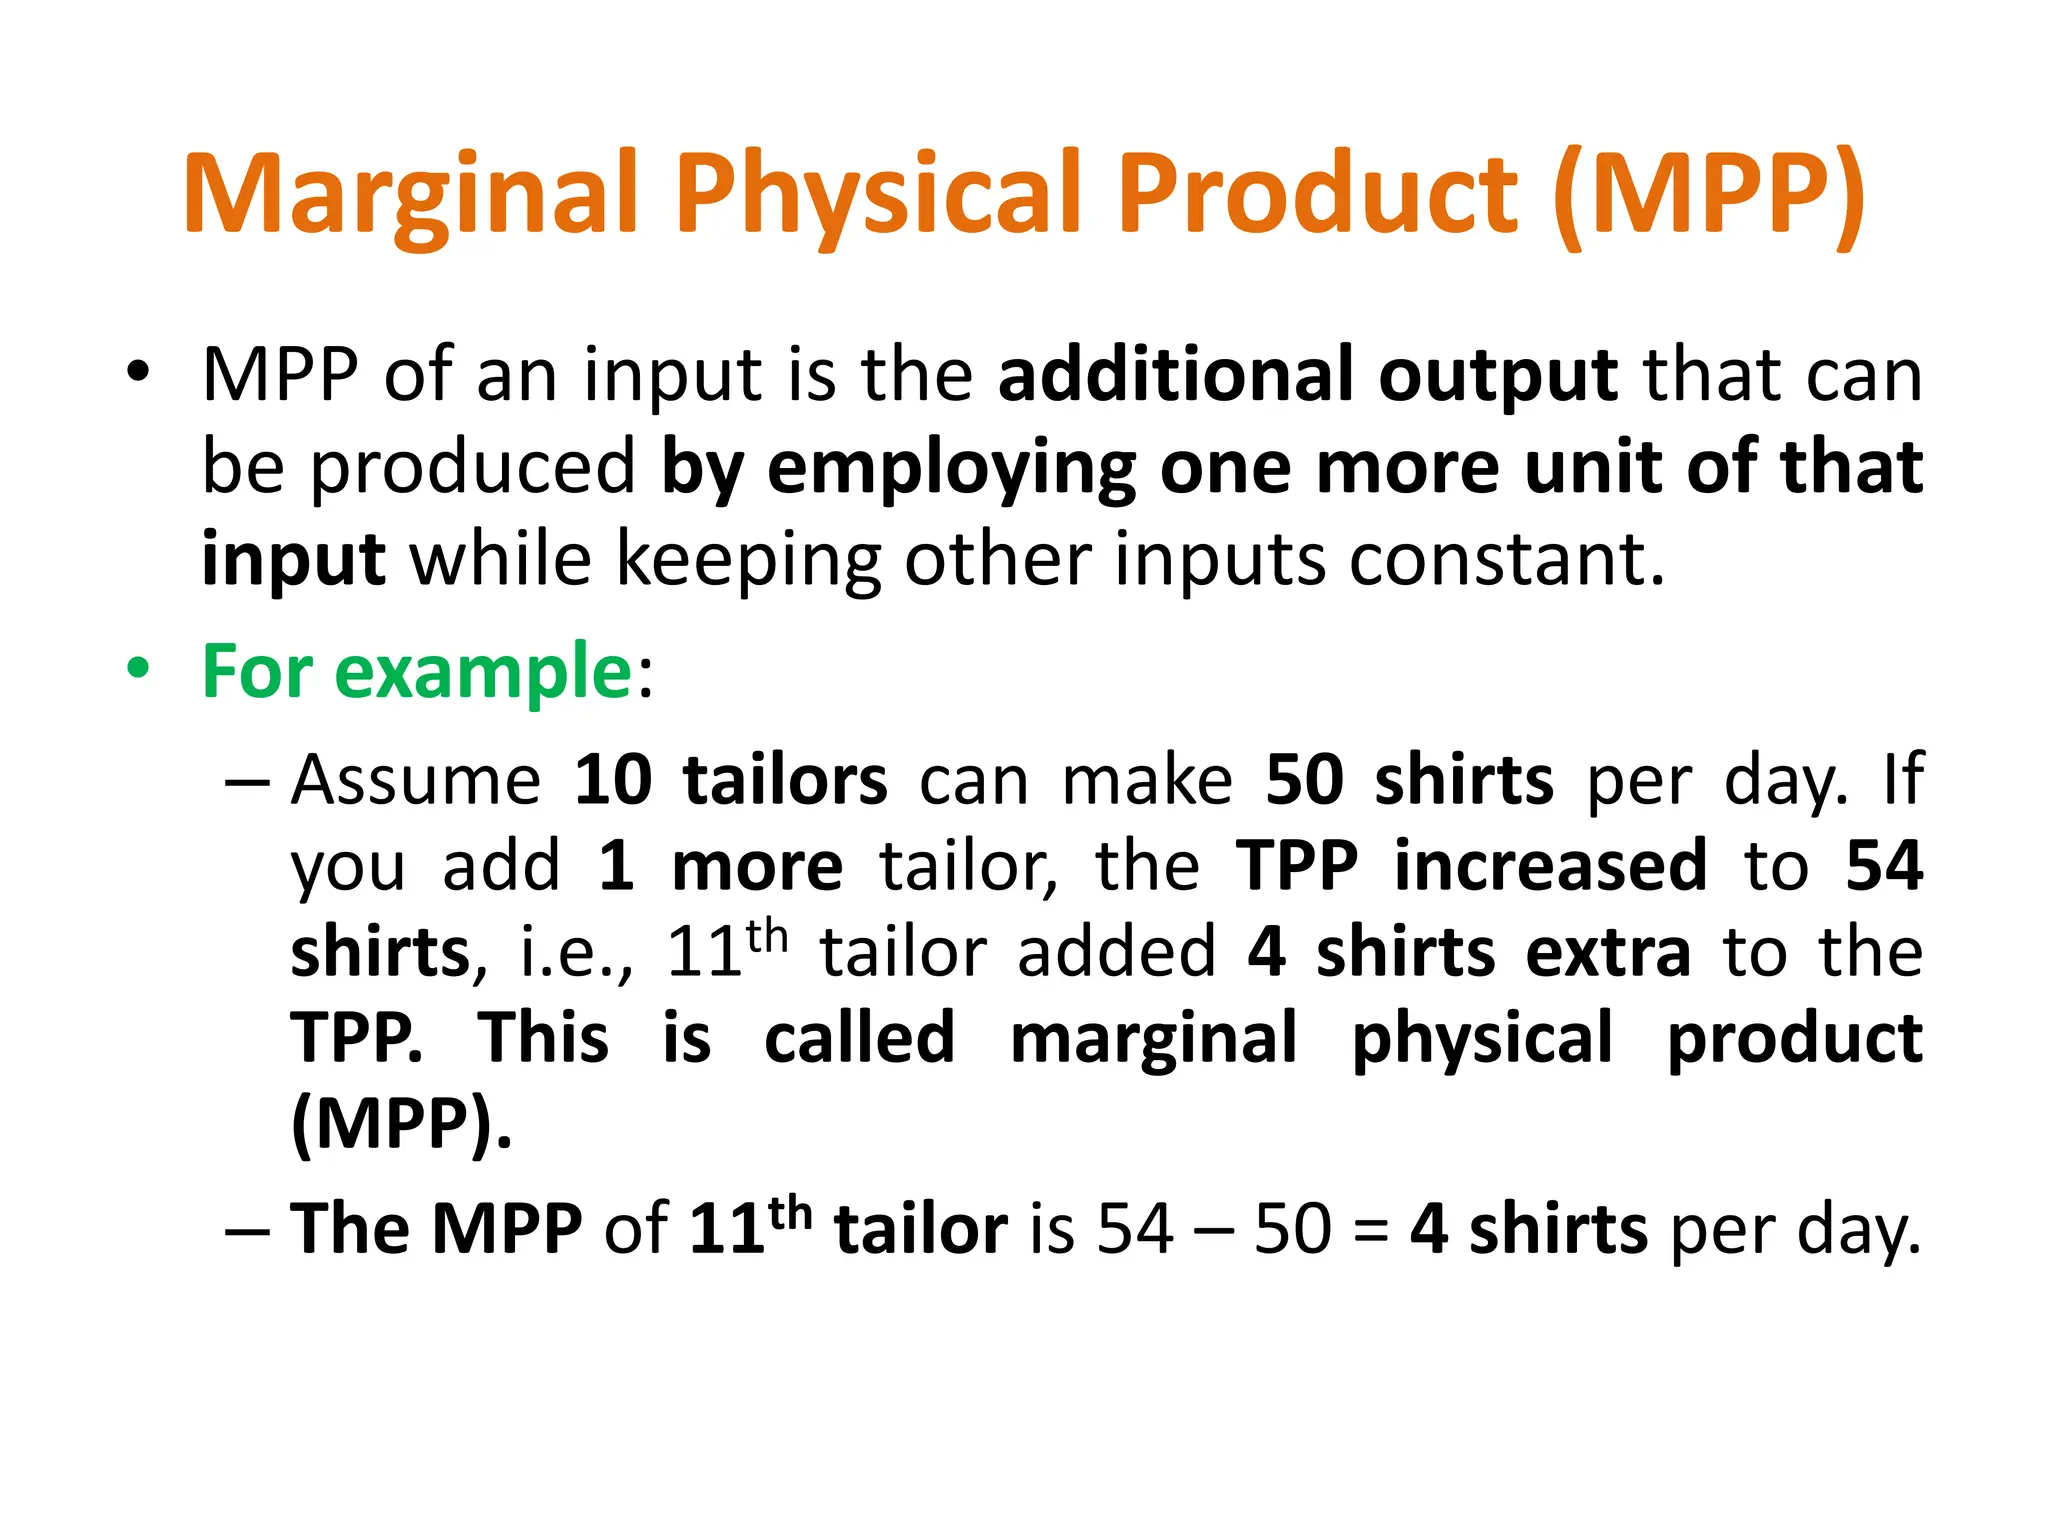
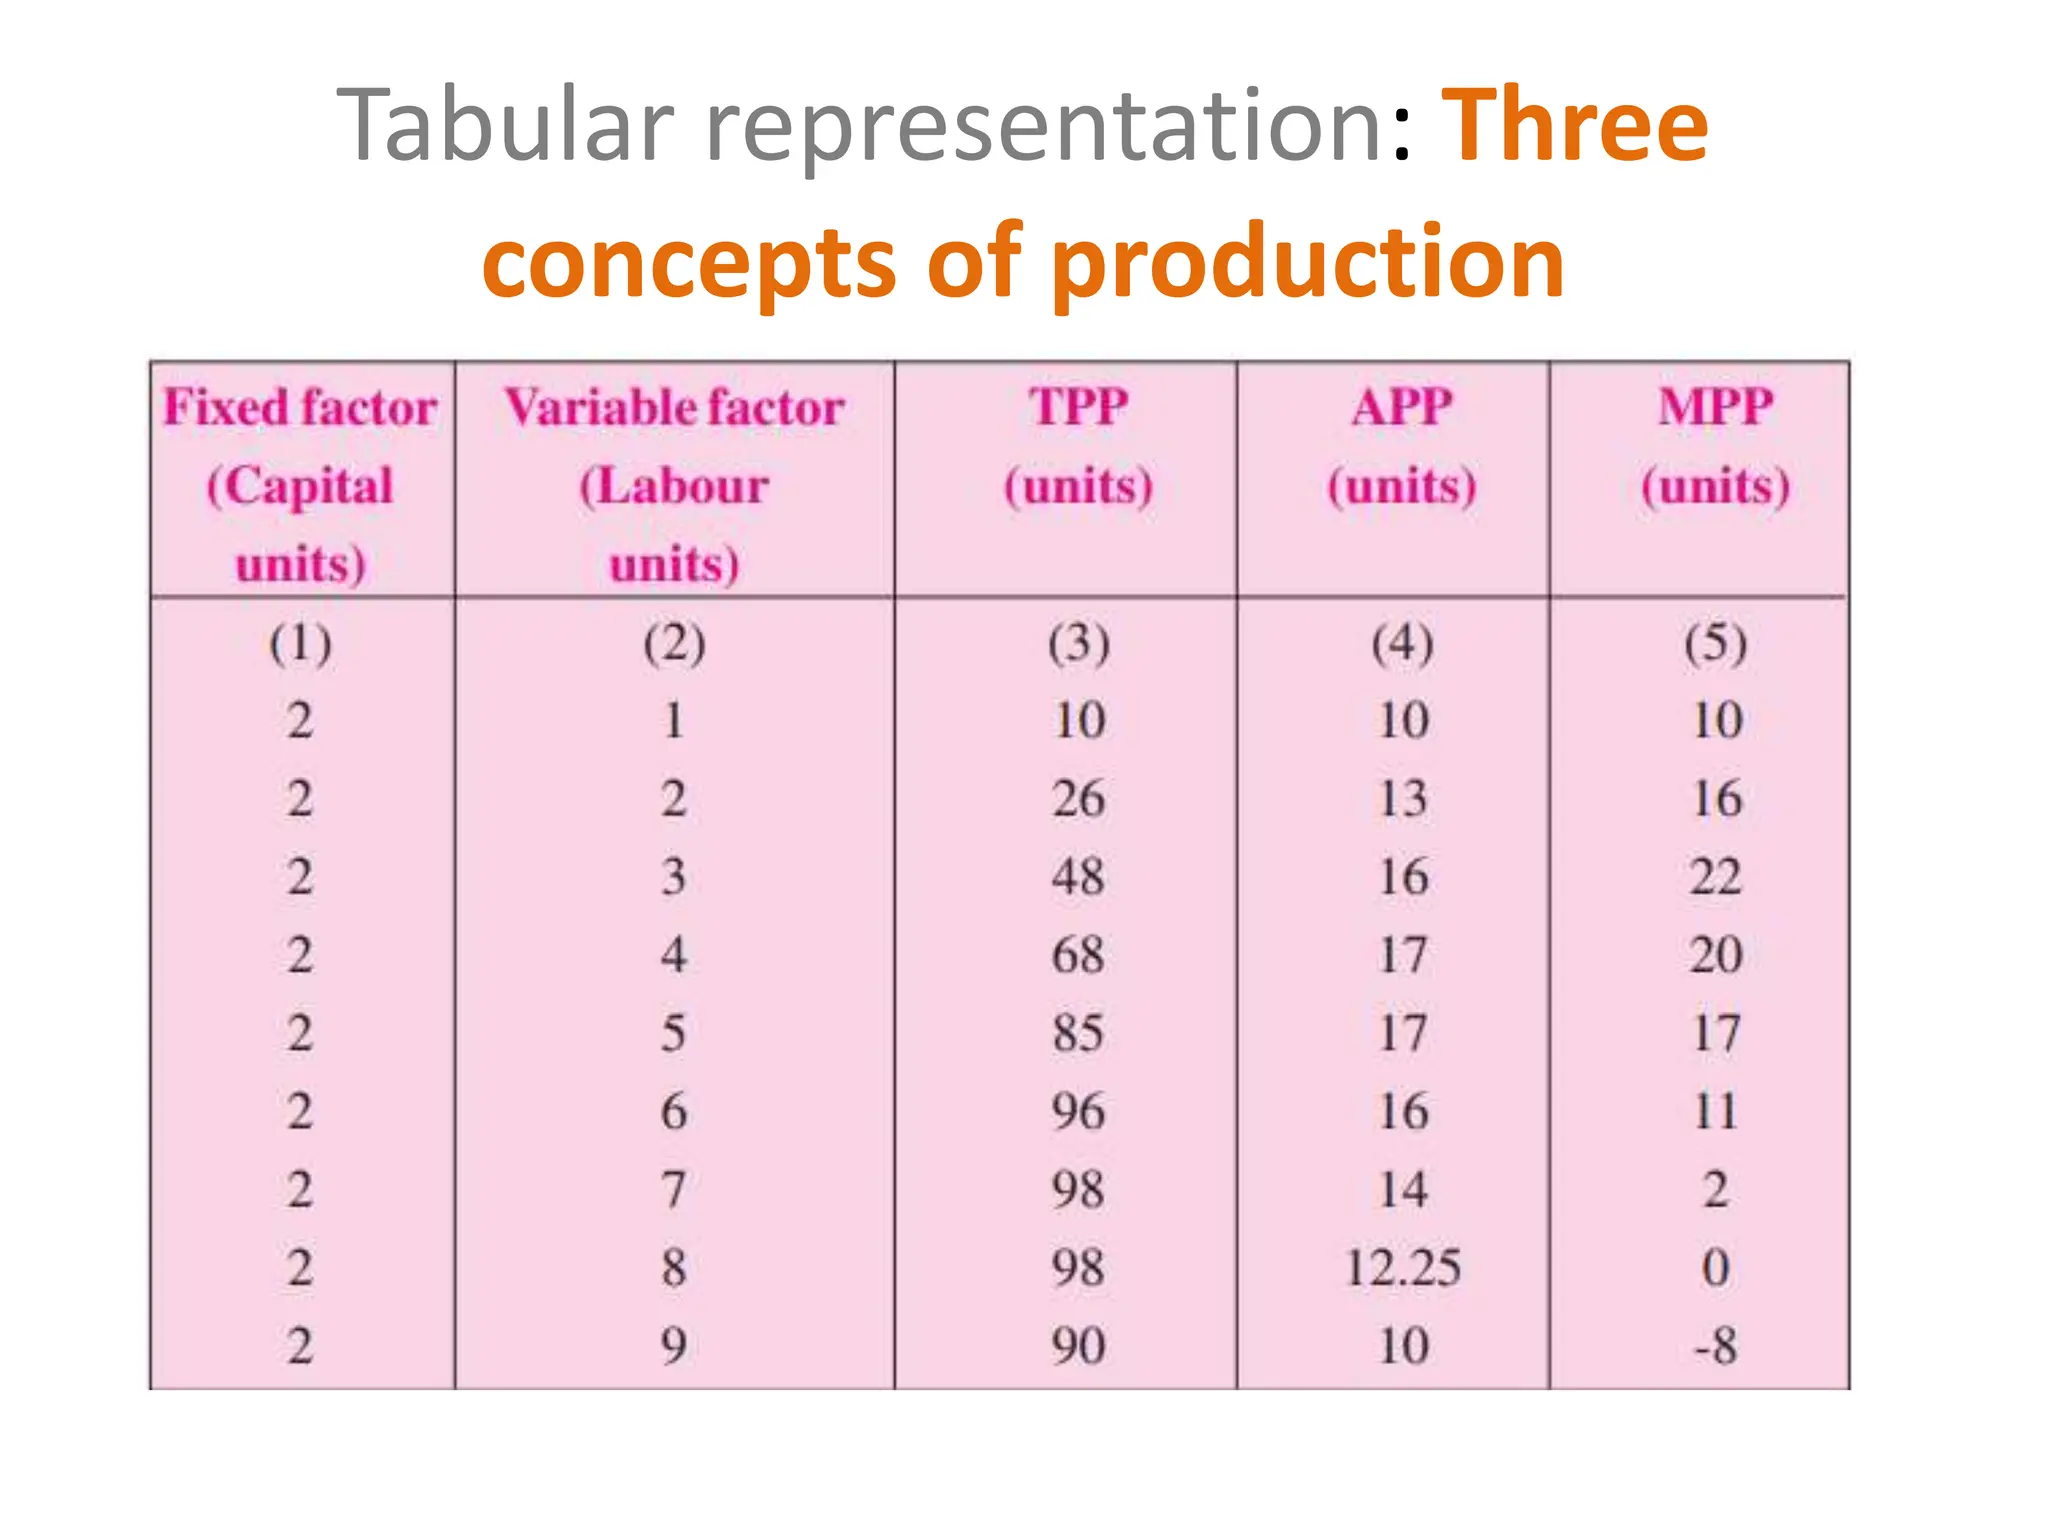
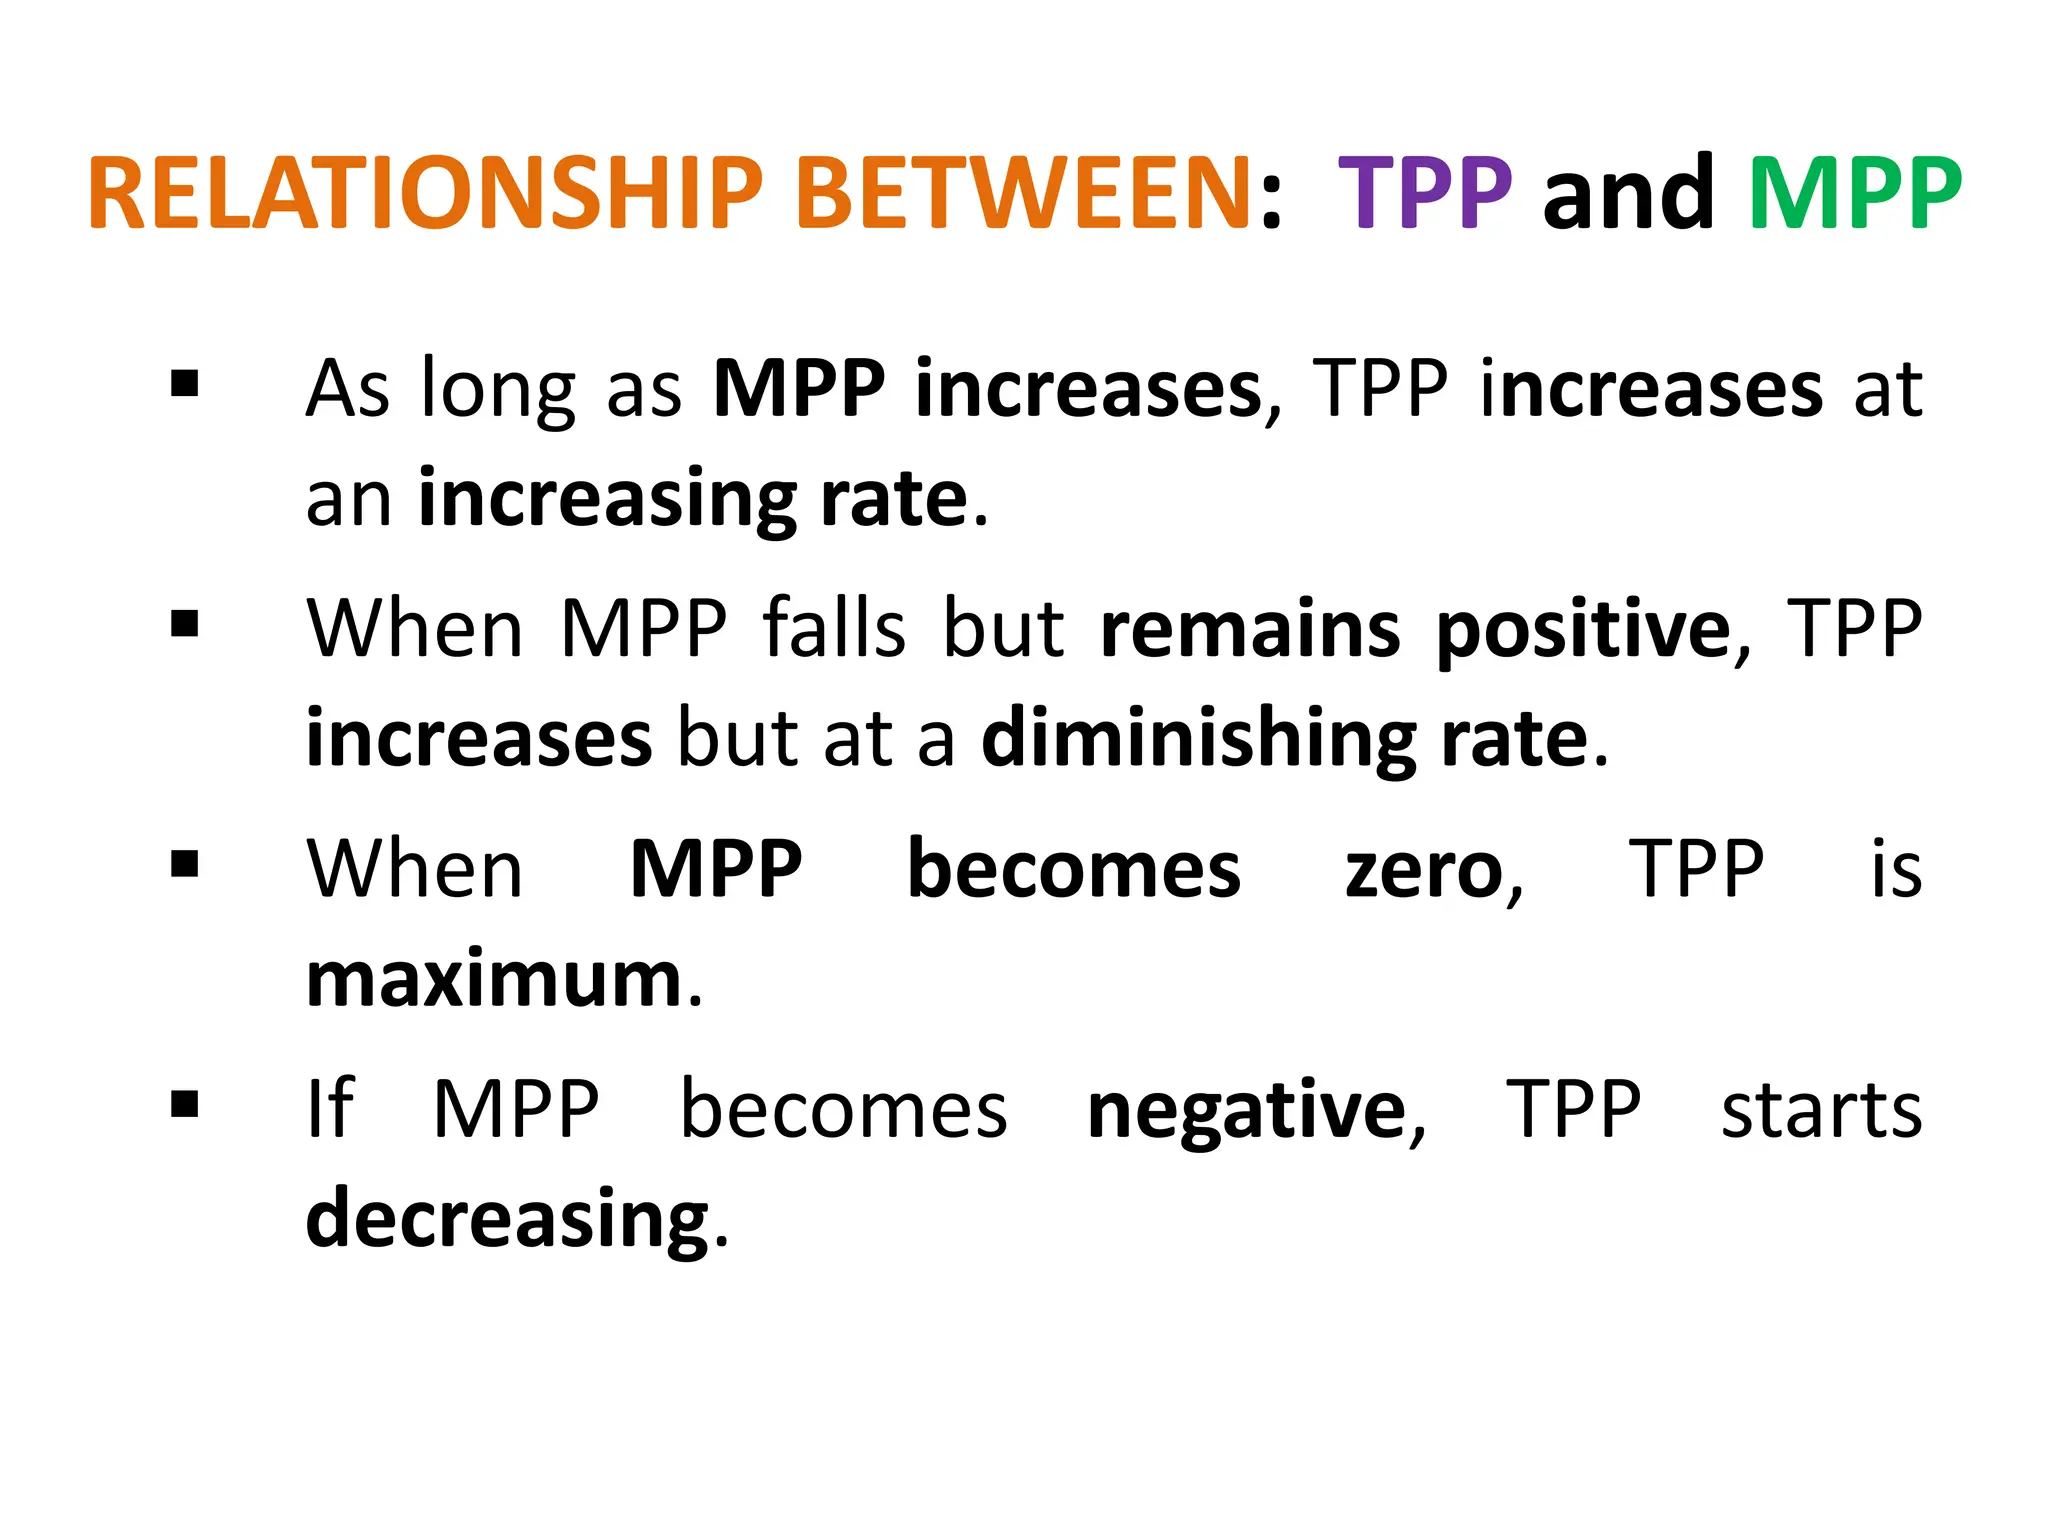
4. What Is Production Function?
• The production function is purely a technical relation
which connects factor inputs and output. i.e., the
transformation of factor inputs into products
(outputs) at any particular time period.
• It represents the technology of a firm of an industry,
or of the economy as a whole.
• It includes all the technically efficient methods of
production.
• A method of production (process, activity) is a
combination of factor inputs required for the
production of one unit of output.
5. • Usually a commodity may be produced by various
methods of production.
• For example, a unit of commodity x may be produced by
the following processes.
• A method of production is said to be efficient if any
method uses less of one factor and not more of any other
factor as compared with other methods.
• For example, a unit of commodity y can be produced by
two methods:
• Which is efficient A or B?
6. Concepts related to Production
Function
• (a) Short run
– Short run refers to a time period in which a firm does not have
sufficient time to increase the scale of output.
– It can increase only the level of output by increasing the
quantity of a variable factor and making intensive use of the
existing fixed factors.
• (b) Long run
– Long run refers to the time period in which the firms can
increase the scale of output by increasing the quantity of all the
factor inputs simultaneously and in the same proportion.
• The distinction between fixed and variable factors is relevant only in
the short run analysis.
7. • Fixed factors
– Fixed factors are those factors of production whose
quantity can not be changed with change in the level
of output.
– For example, the quantity of land, machinery etc. can
not be hanged during short run.
• Variable factors
– Variable factors are those factors of production whose
quantity can easily be hanged with change in the level
of output.
– For example, we can easily change the quantity of
labour, raw materials, etc. to increase or decrease the
production.
8. • Level of production
– When any firm increases production by increasing
the quantity of one factor input by keeping other
factor inputs constant;
– It increases the level of production.
• Scale of production
– When the firms increases production by
increasing the quantity of all the factors of
production simultaneously and in the same
proportion, it increases the scale of production.
9. Three measures of production
• Total product (TP) or
total physical product denoted by
TPP.
• Average Product (AP) or
Average physical product denoted by
APP.
• Marginal Product (MP) or
Marginal physical product denoted by
MPP.
10. Total Physical Product (TPP)
• TPP is the total amount of a commodity is
produced with a given level of factor inputs
and technology during a given period of time.
For example:
Two (2) units of labour combined with two
(2) units of capital can produce 26 fans per
day.
Here 26 fans is the total physical product
which is produced with the given level of
inputs (labour and capital).
11. Average Physical Produt (APP)
• APP is the output produced per unit of input
employed. It can be obtained by dividing TPP
by the number of units of variable input.
• So, APP = TPP/L , where L is the units of
labour.
• For example:
If 10 workers make 30 chairs per day, the APP of a
worker per day will be 30 ÷ 10 = 3 chairs.
If the productivity of a factor increases, it implies
that the output per unit of input has increased.
12. Marginal Physical Product (MPP)
• MPP of an input is the additional output that can
be produced by employing one more unit of that
input while keeping other inputs constant.
• For example:
– Assume 10 tailors can make 50 shirts per day. If
you add 1 more tailor, the TPP increased to 54
shirts, i.e., 11th tailor added 4 shirts extra to the
TPP. This is called marginal physical product
(MPP).
– The MPP of 11th tailor is 54 – 50 = 4 shirts per day.
14. RELATIONSHIP BETWEEN: TPP and MPP
As long as MPP increases, TPP increases at
an increasing rate.
When MPP falls but remains positive, TPP
increases but at a diminishing rate.
When MPP becomes zero, TPP is
maximum.
If MPP becomes negative, TPP starts
decreasing.
15. RELATIONSHIP BETWEEN: APP and MPP
• As long as MPP is greater than APP, APP
increases.
• When MPP is equal to APP, APP is
maximum and constant.
• When MPP is less then APP, APP
decreases.
• MPP can be zero and negative but APP is
never zero or negative.
16. Graphical Representation:
Relationship among TPP, APP & MPP
TPP increases from point O to point B.
From O to A: TPP increases at an increasing rate.
In this phase at the lower portion of the diagram
MPP increases up to point C.
Conclusion: when MPP increases TPP increases
at an increasing rate.
From A to B: TPP increases at a diminishing rate.
MPP decreases from point C to point D but it
remain positive.
Conclusion: when MPP falls but remains positive,
TPP increases at a diminishing rate.
At point B on TPP curve, TPP is maximum and
MPP is zero at point D.
Conclusion: where MPP is zero, TPP is maximum.
After point B, TPP falls.
After point D MPP becomes negative and TPP
falls