Download as PDF, PPTX
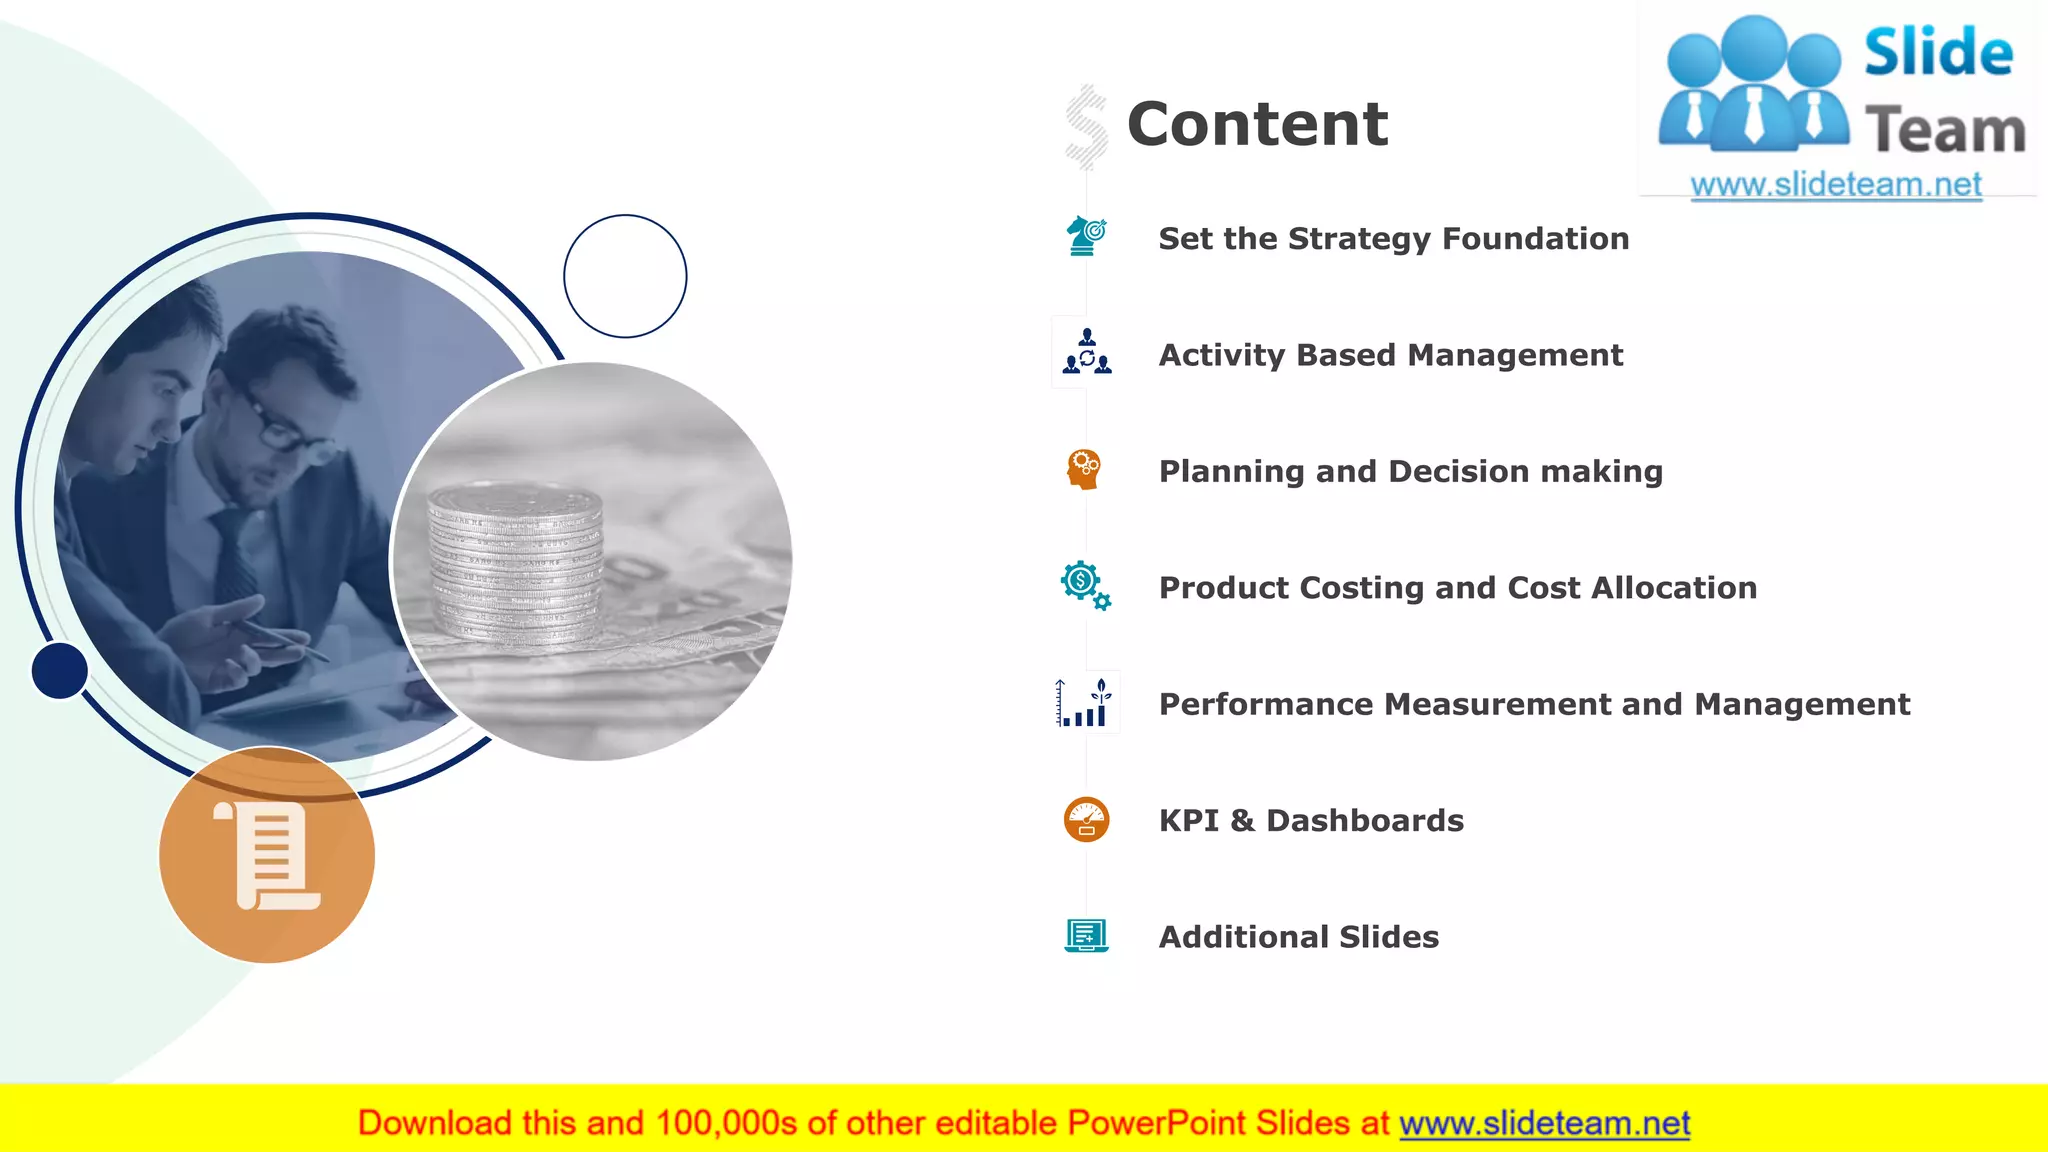


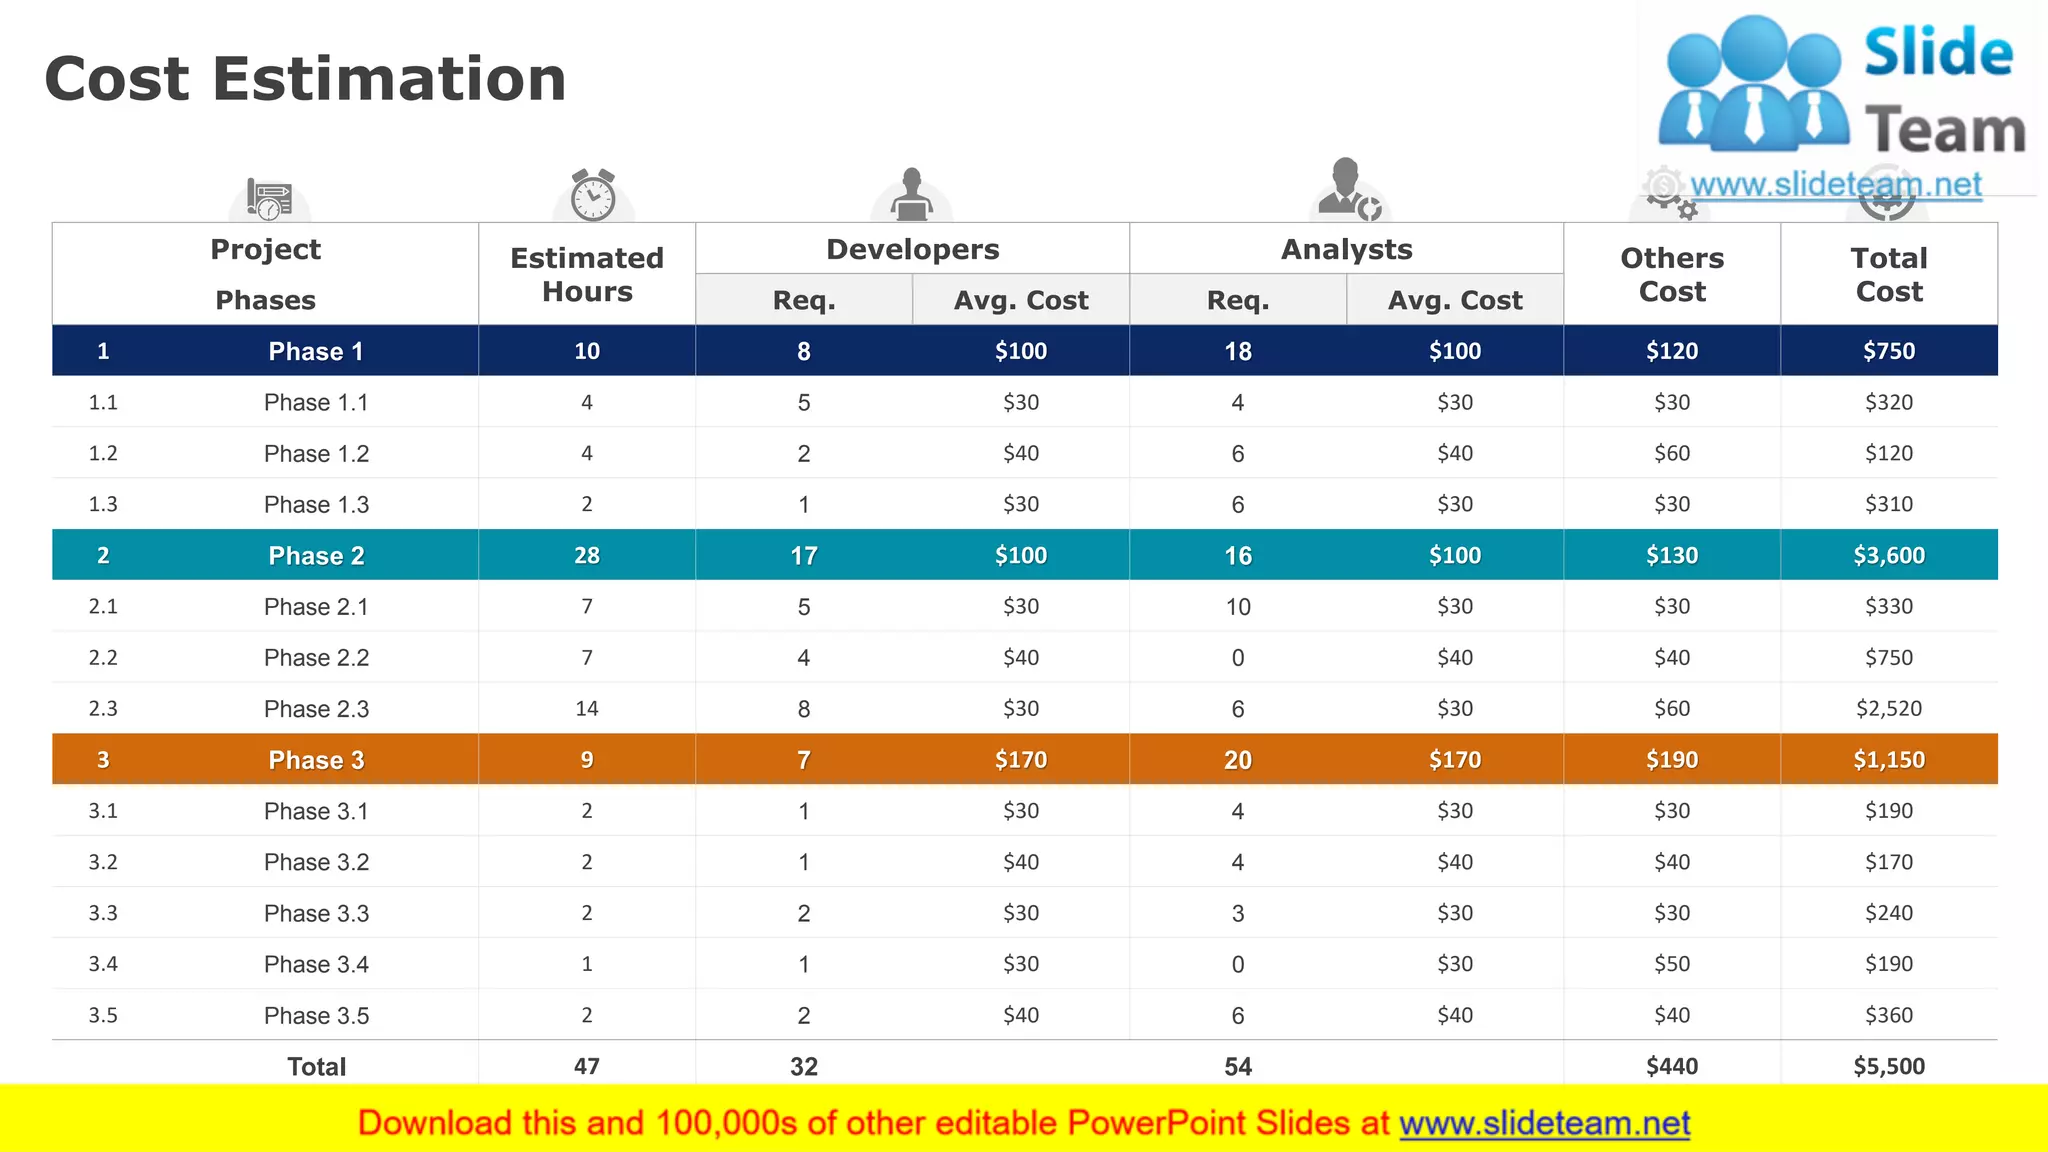


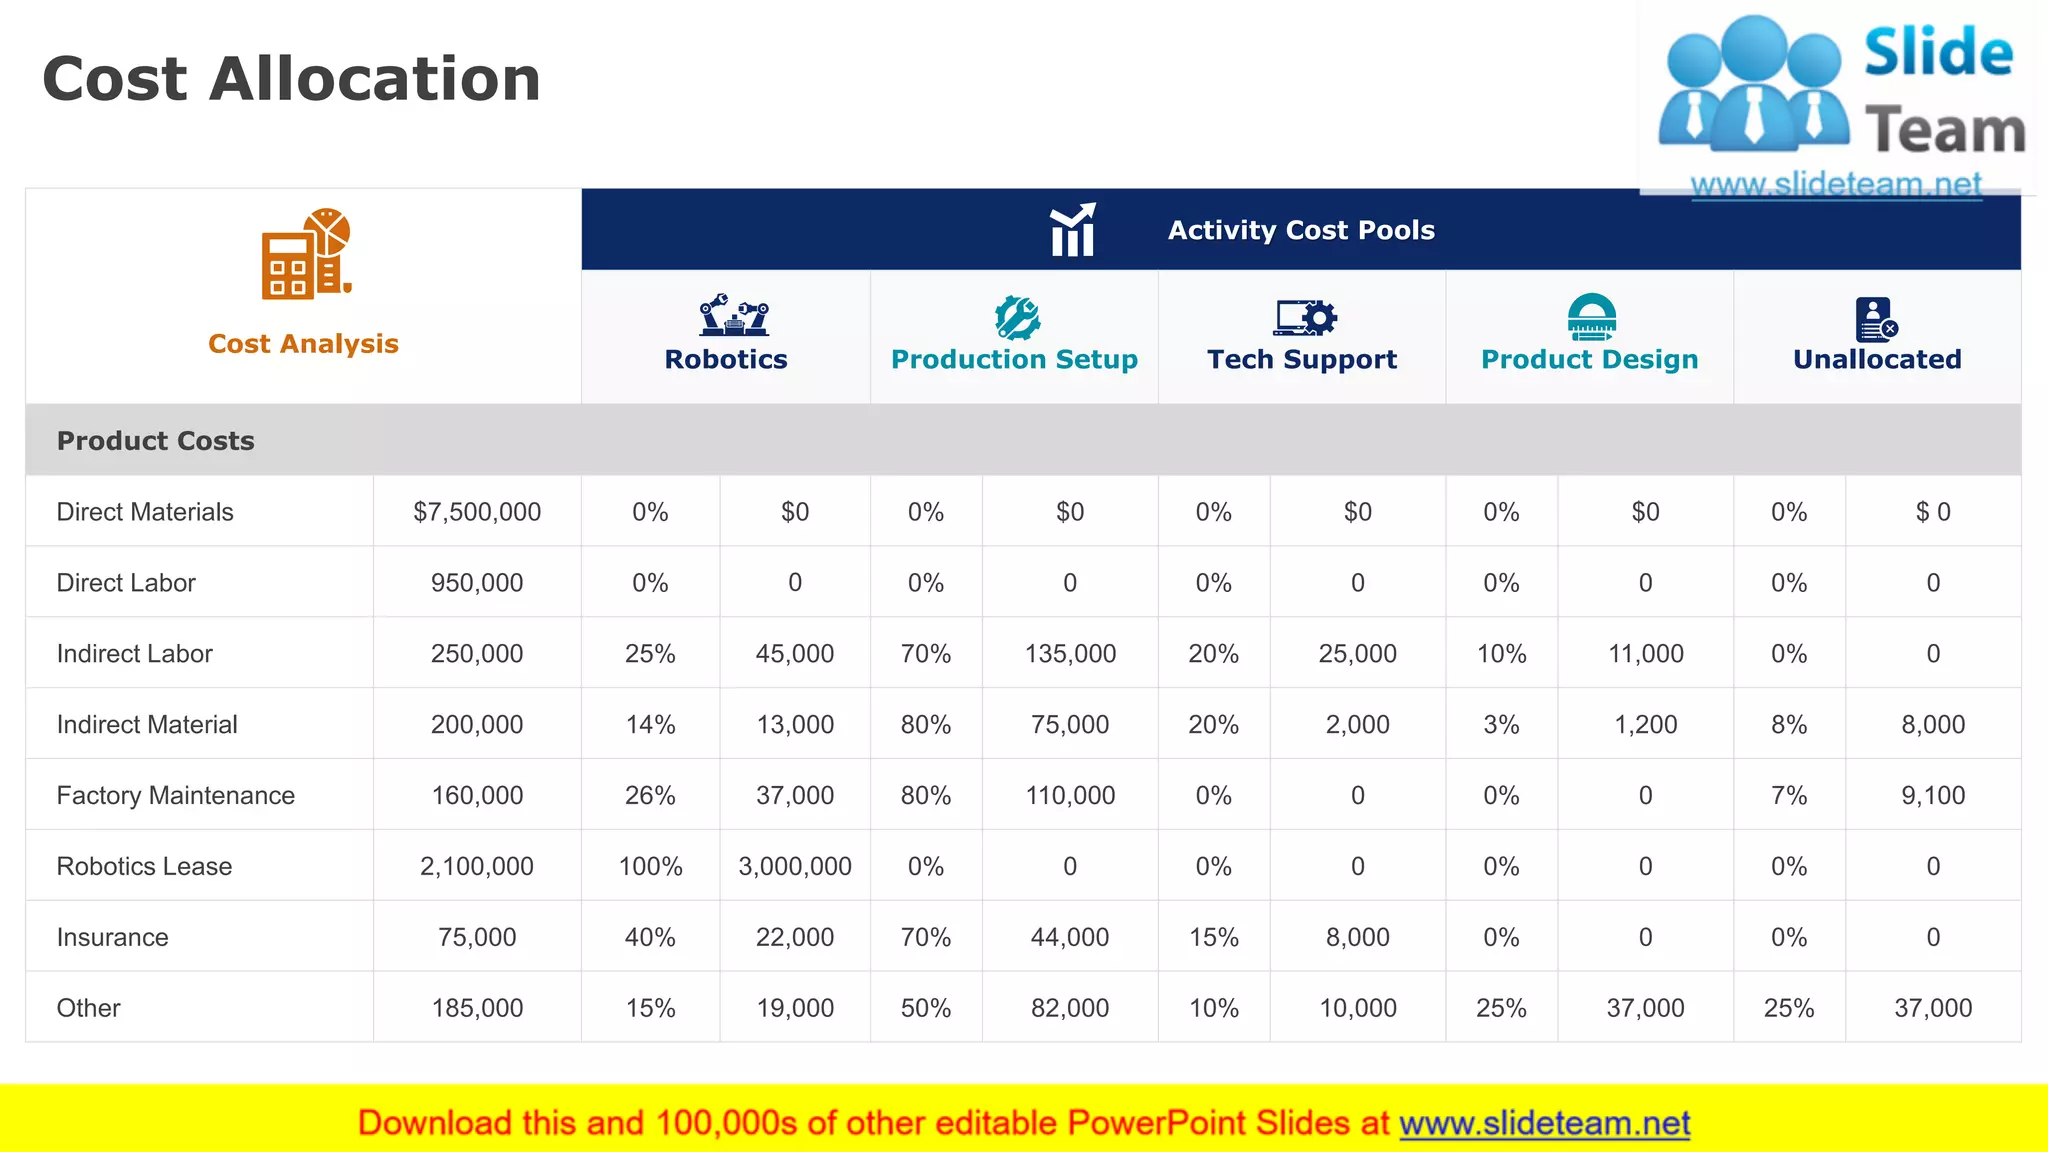

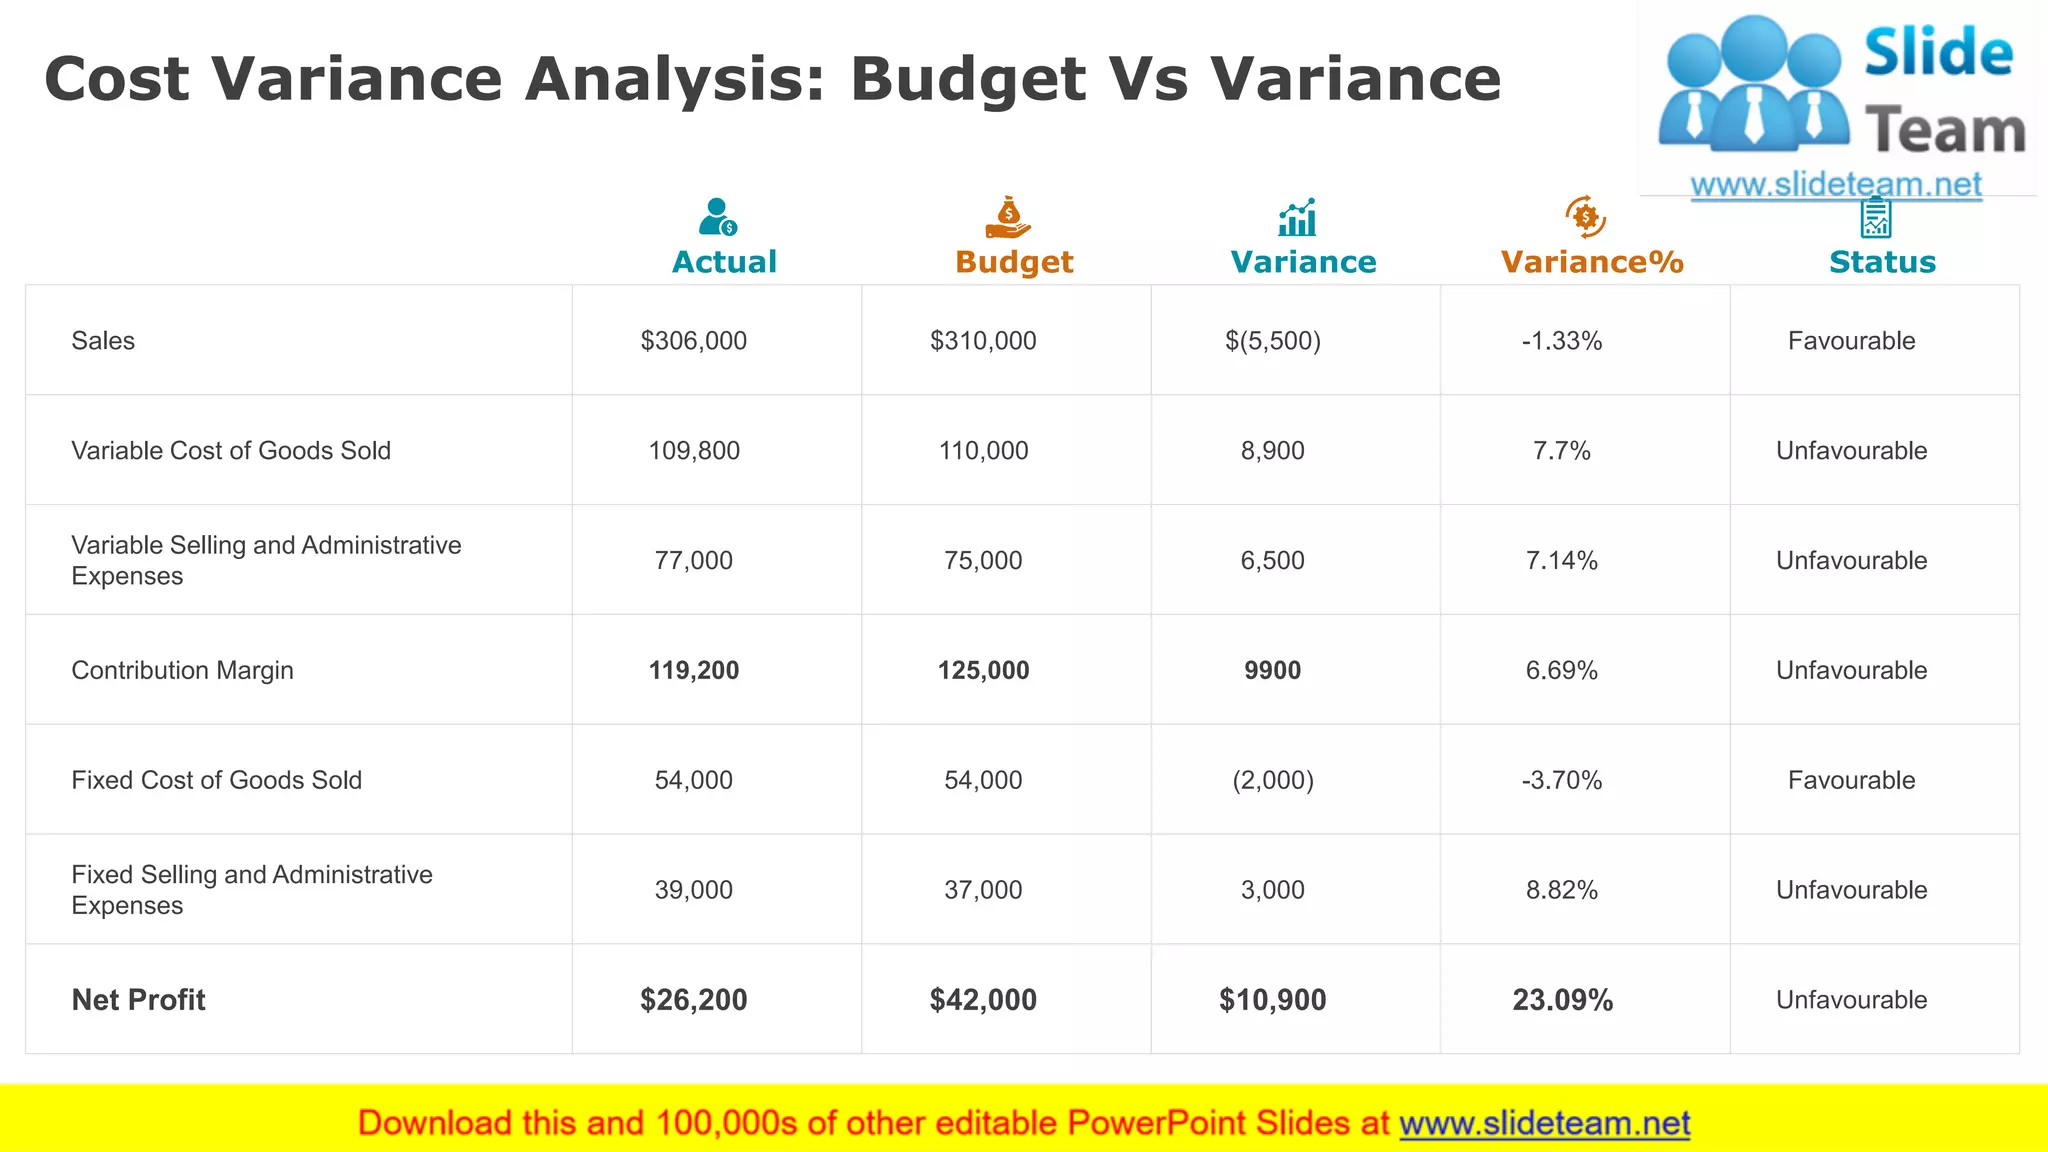


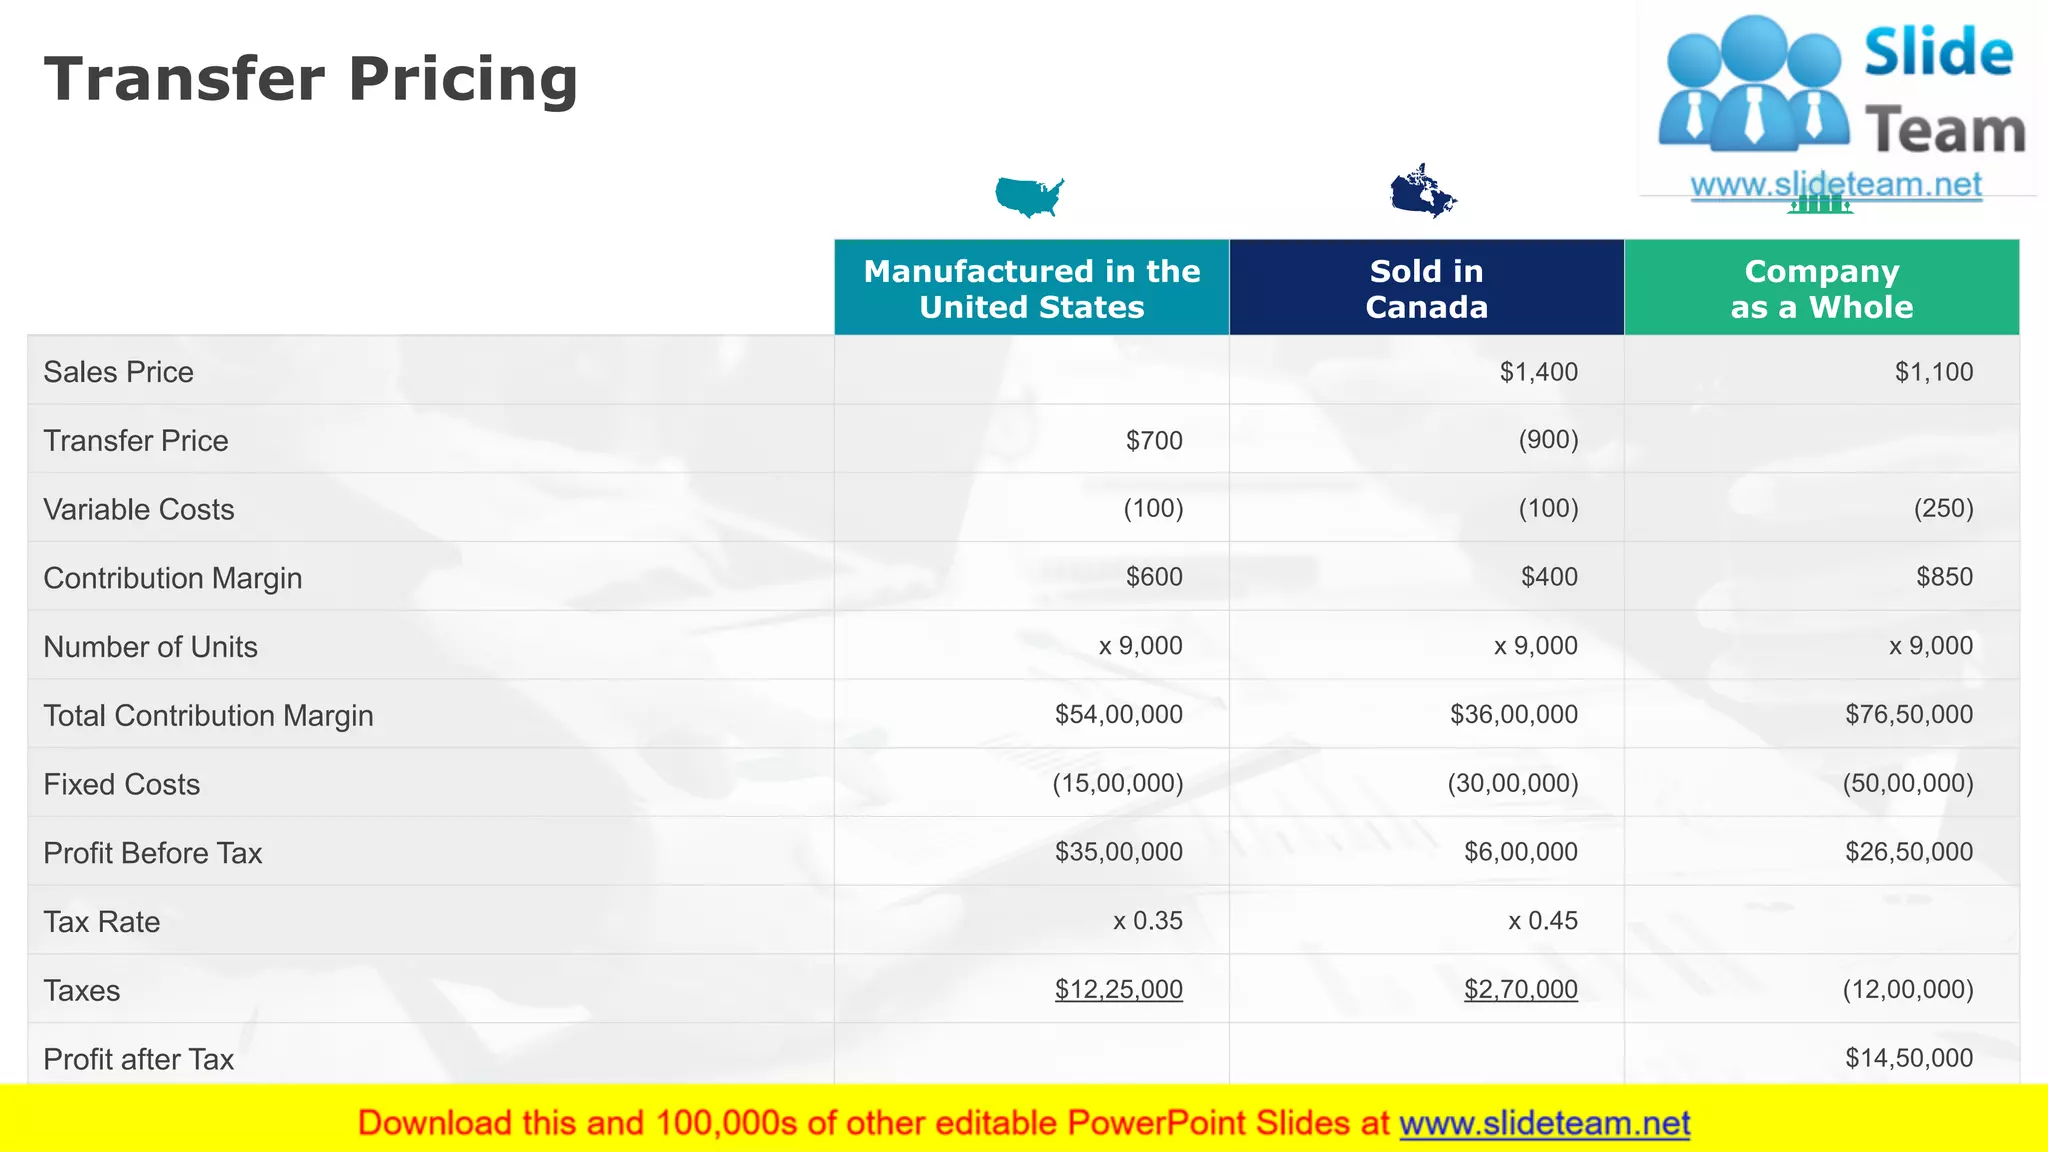

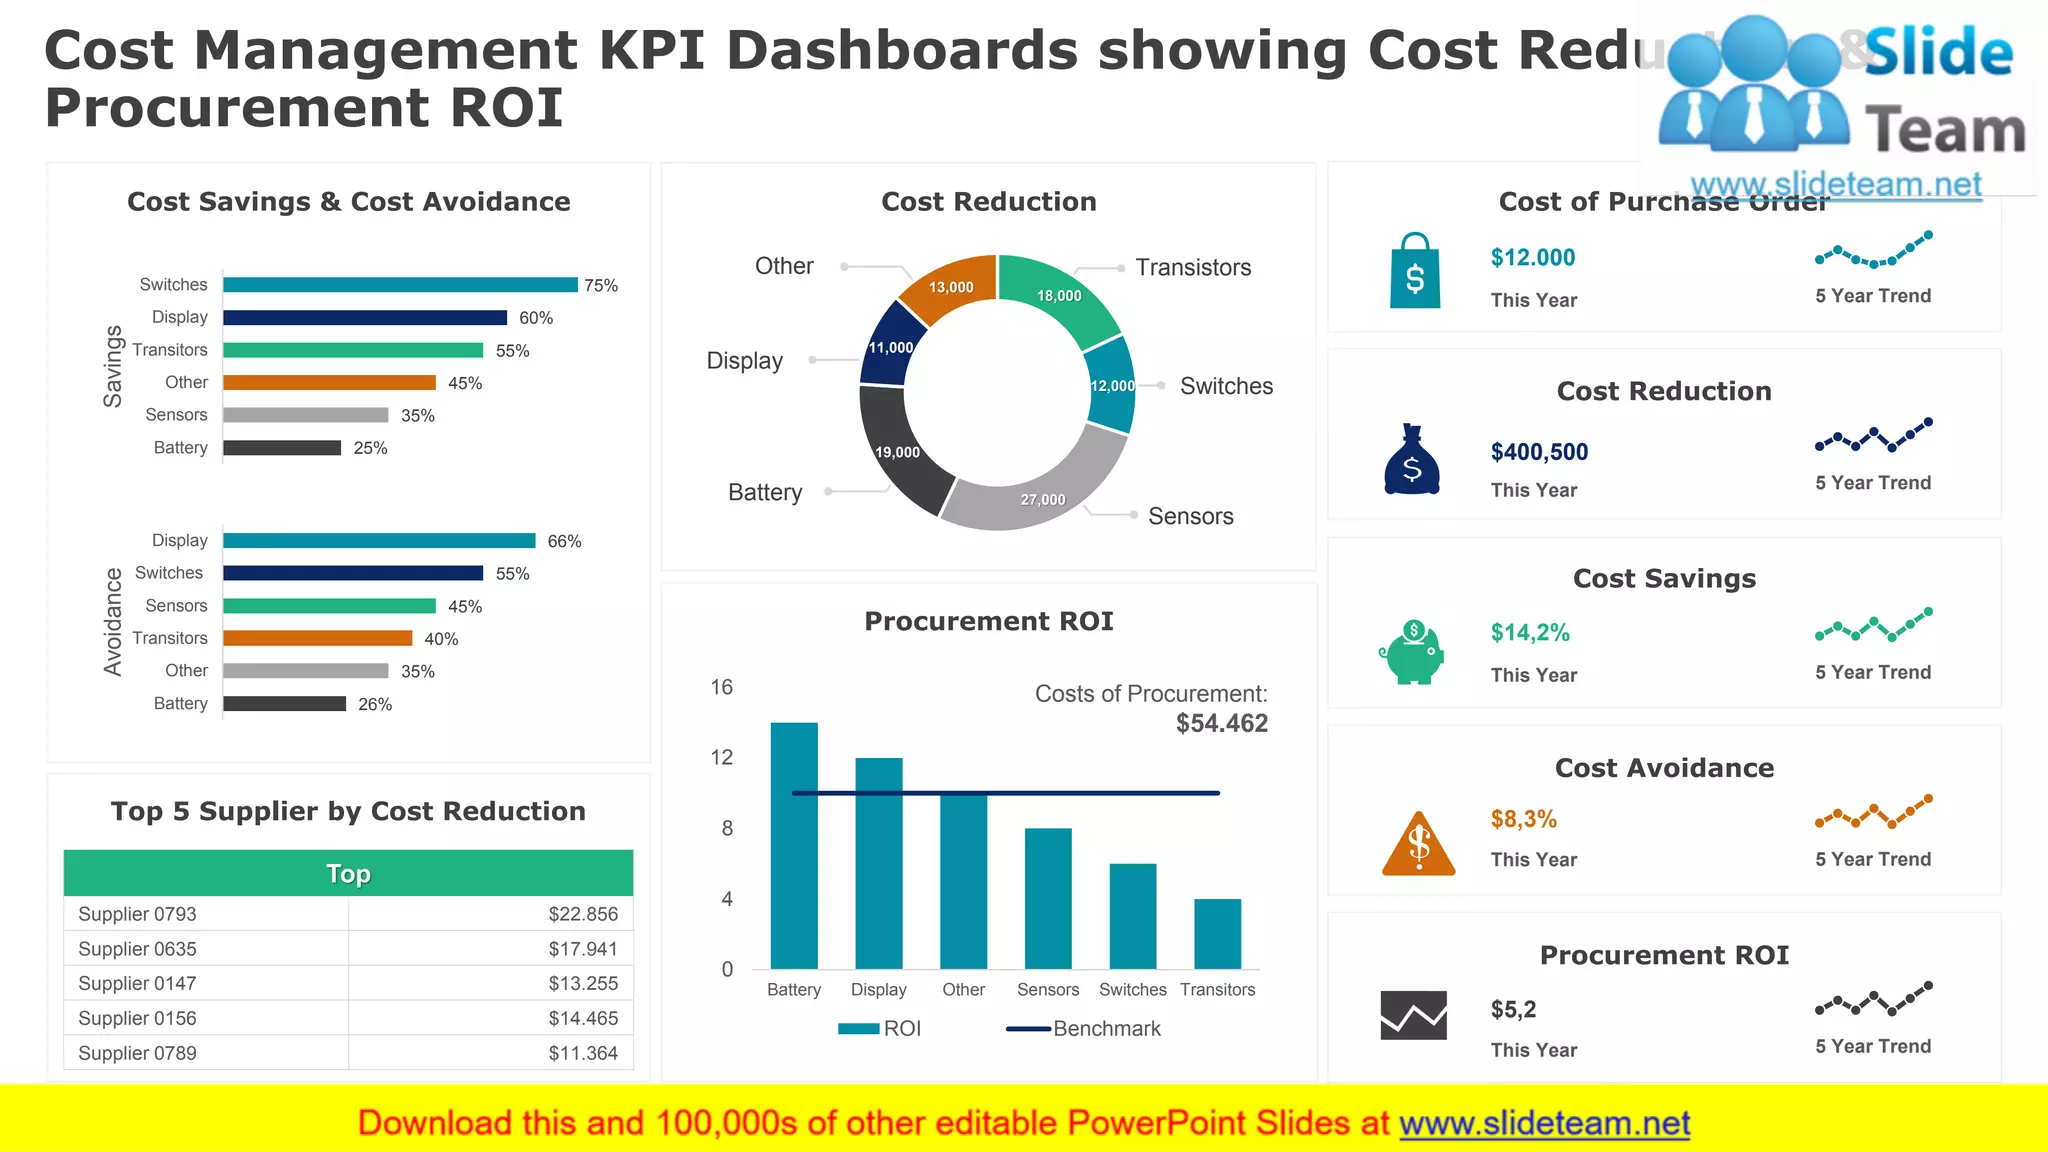


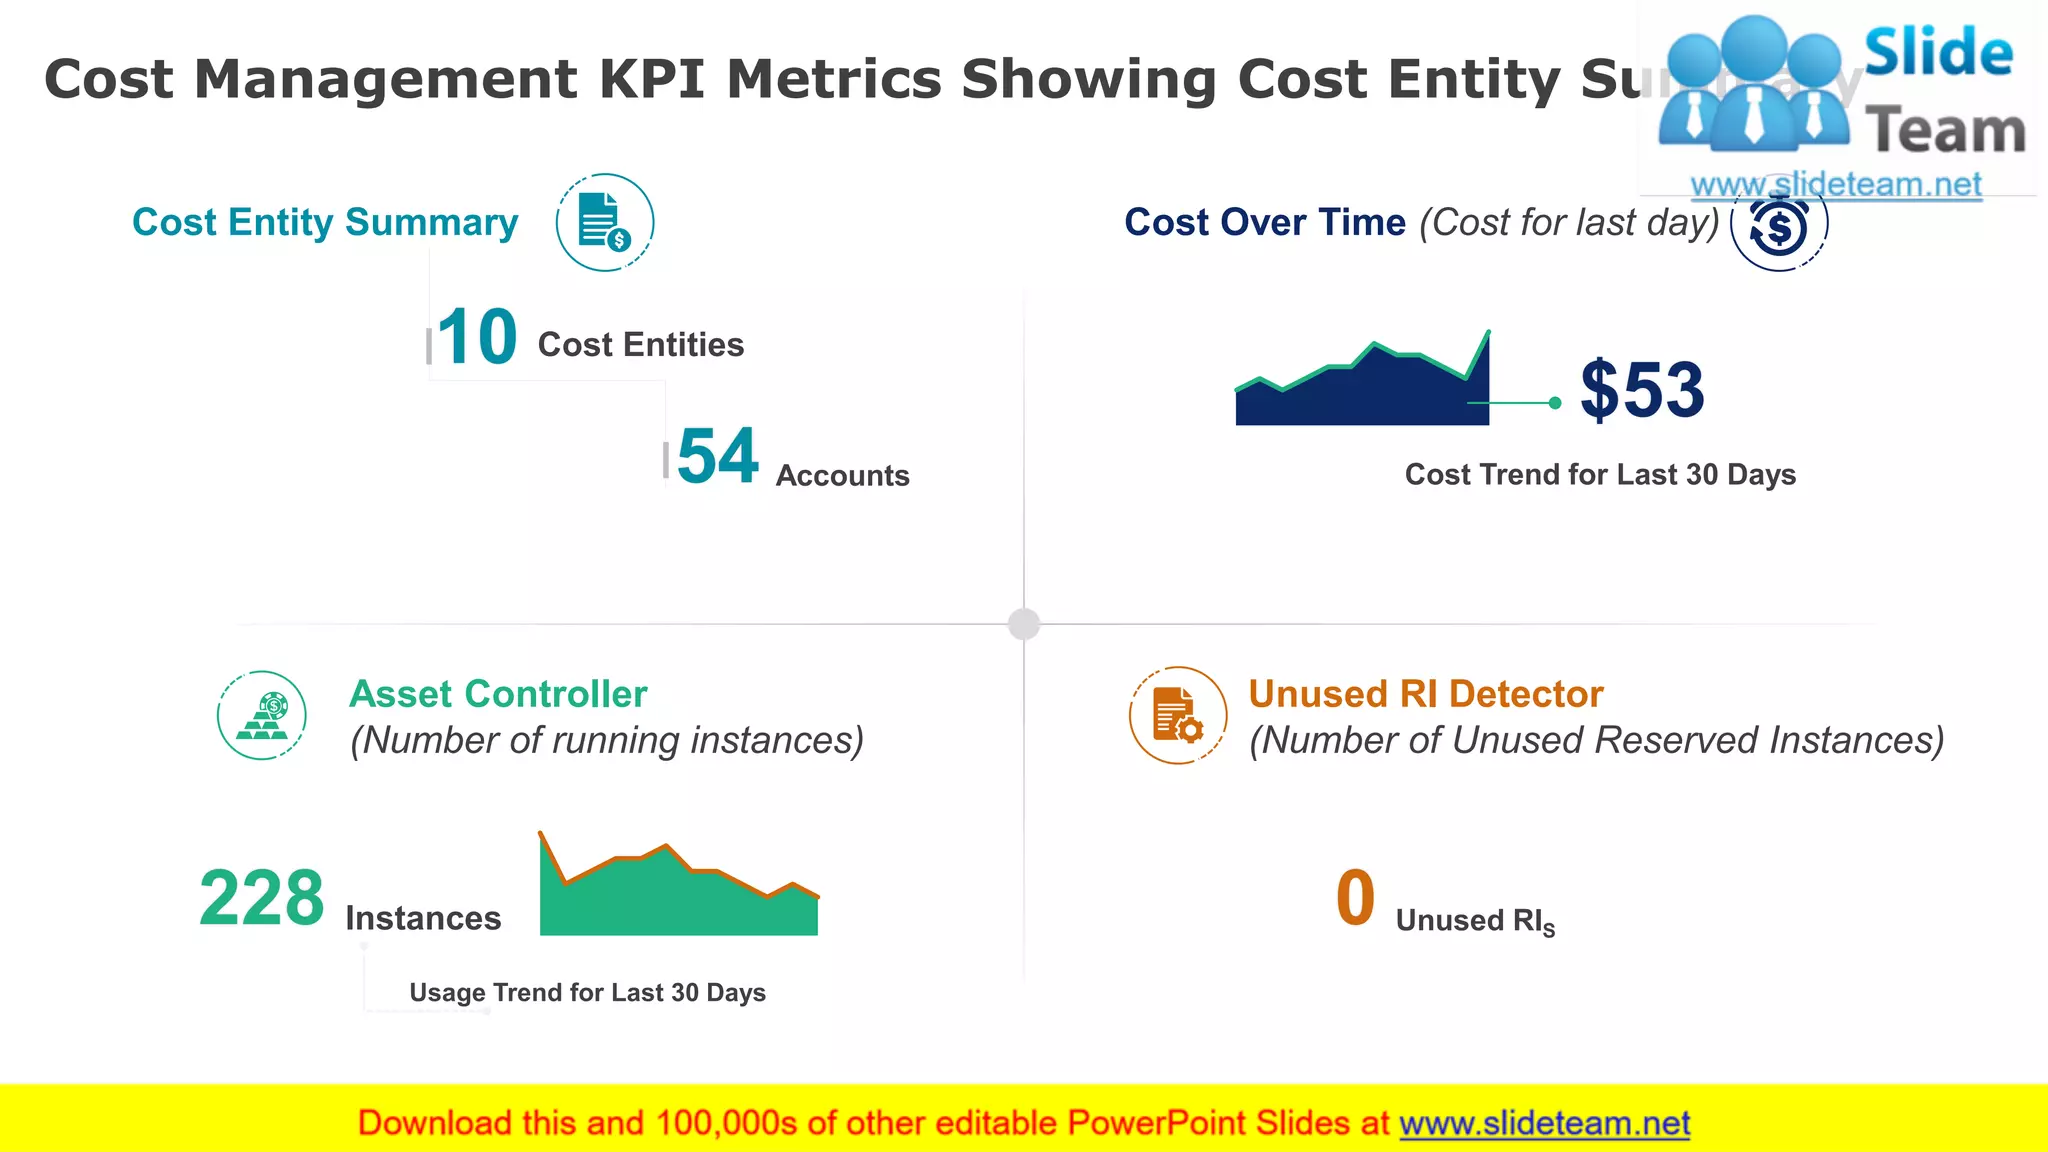
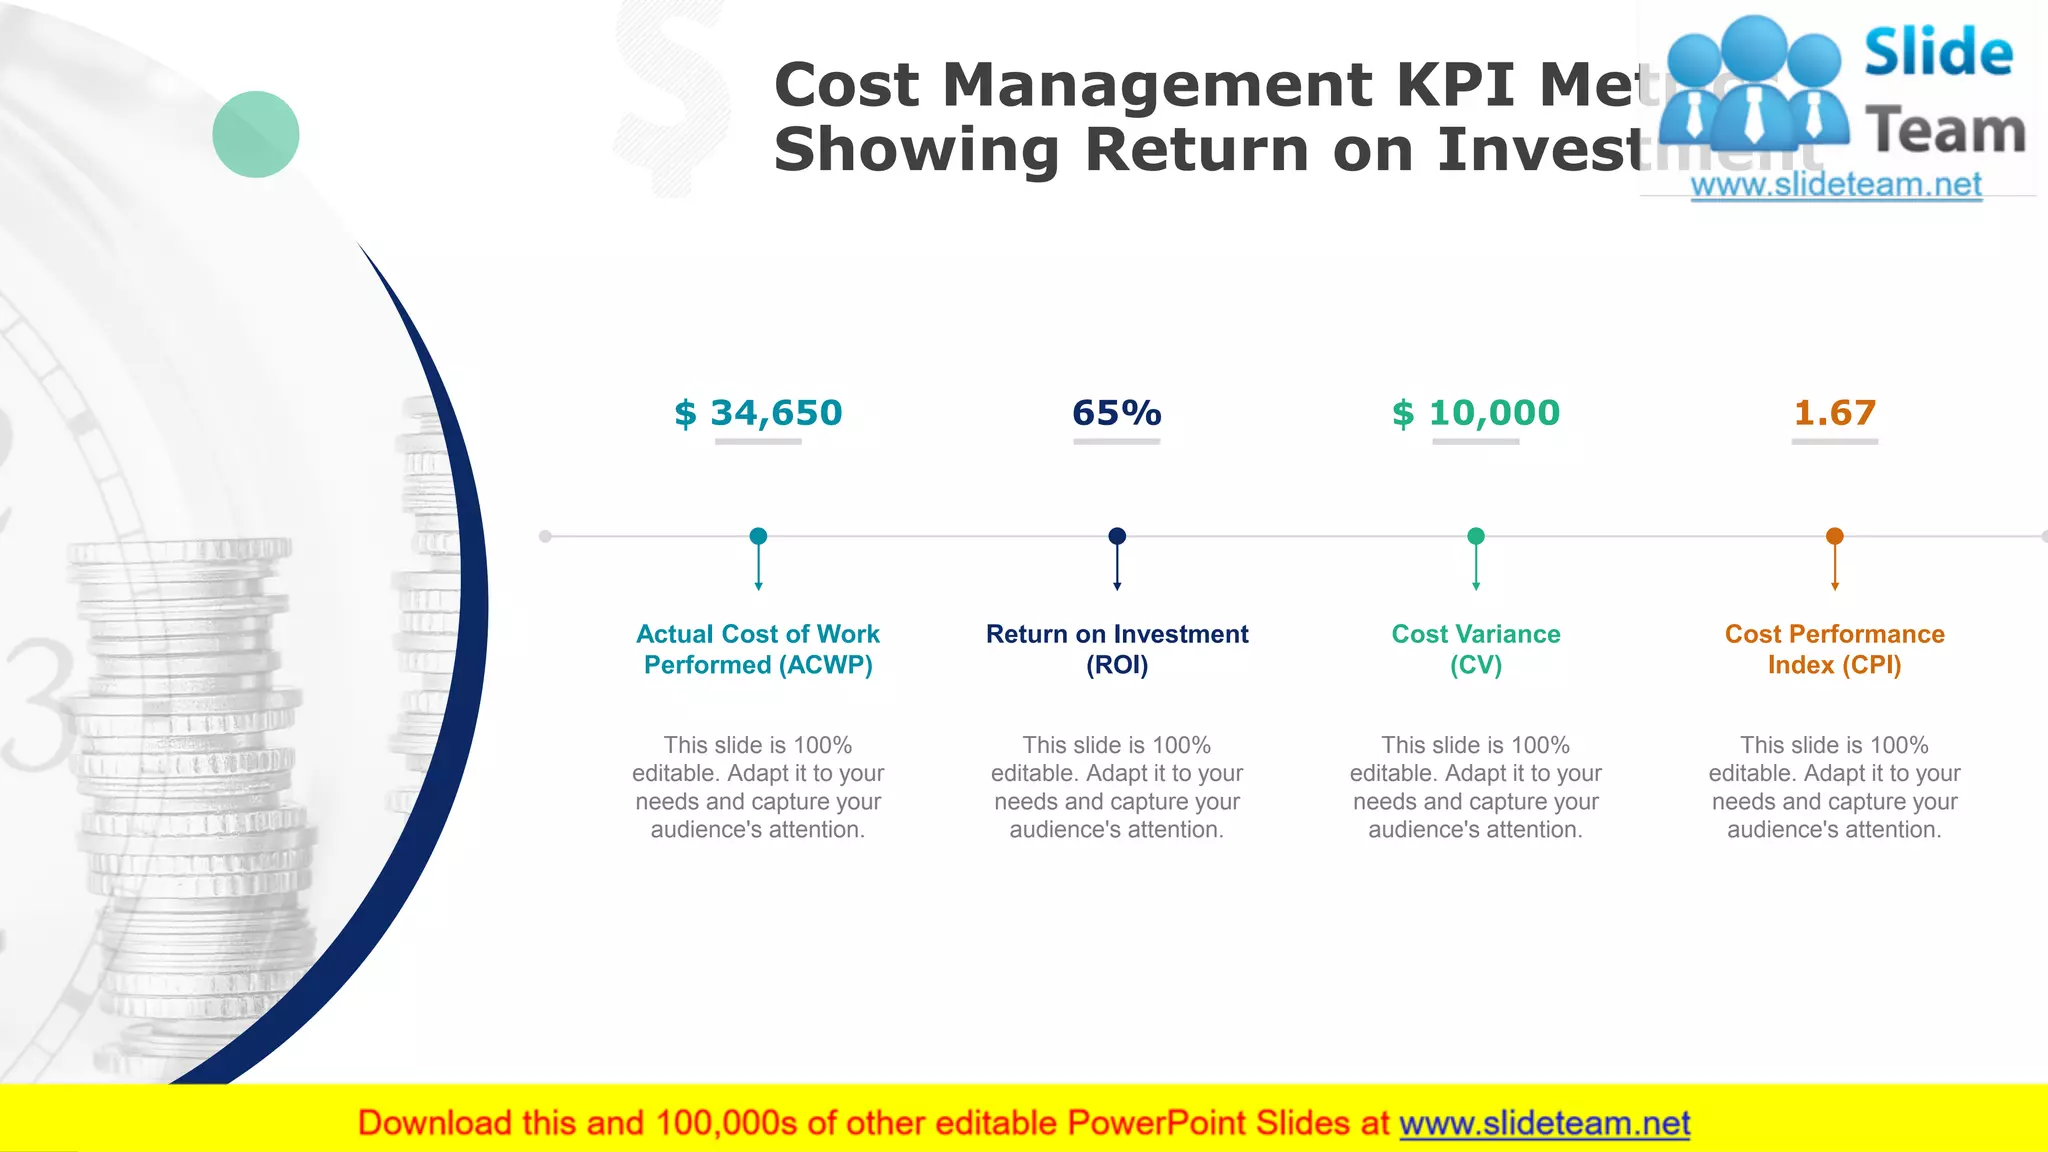


The document outlines a comprehensive approach to product costing and cost management strategies, including activity-based costing, customer profitability analysis, and budgeting for decision-making. It emphasizes the importance of adapting cost strategies to enhance product quality and market distribution. Additionally, it provides detailed examples of cost estimation, variance analysis, and the implications of make-or-buy decisions in the context of financial planning.