Downloaded 48 times


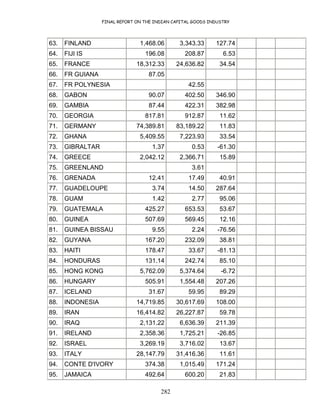
![FINAL REPORT ON THE INDIAN CAPITAL GOODS INDUSTRY
289
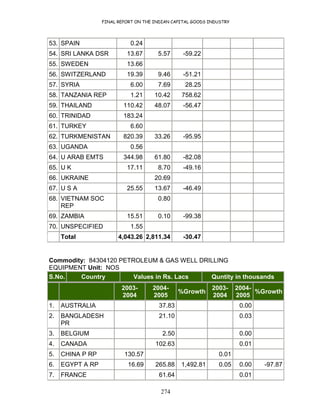
Authorizer
Home
Country
Description
of Projects
Capacity Host Country
Projected
Amount
(Rs.Crores)
[1 USD=
Rs45.27] and
1 RAND =
RS.6.78 and
1 EURO =
Rs 53.65
Date of
Expiry
Funding
Authority
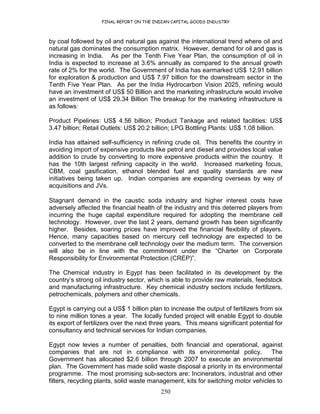
1
Minera
Escondida Australia
Building a cathode
copper plant Chile 3938.49
2
South African
Government
& Industrial
Development
Corporation
South
Africa
Construction of a
greenfield plant as
part of its mineral
beneficiation strategy South Africa 18984
3
Maritsa East
2 Bulgaria
Maritsa East II Supply
and Installation of
plant and Equipment
project Bulgaria 478.77 EBRD
4 Cameroon
Construction of
Infrastructure for
Petroleum Industry
Project Cameroon 289.72 AFDB
5
Lukoil
Overseas Azerbaijan
Lukagip-Shas Deniz
Gas condensate field
development project Azerbaijan 497.97 EBRD
6
Huntsman
Corporation Europe
Expanding capacity of
plant from 130 mnpa
pounds to 990 mnpa
990mnpa
Geismar
7
Huntsman
Corporation Europe
Expanding capacity of
plant from 220 mnpa
pounds to 880 mnpa
880mnpa
Rozenburg
8
Sempra
Energy Europe
Salt Cavern natural
gas storage facility Louisiana End 2006
9
Black &
Veatch led
consortium Mexico
Construction of LNG
terminal
160,000
cu.m
Mexico 2008
10
Suncor
Energy
USA Build third oil sand
upgrader America
Will begin
in 2007
11
Jacobs
Engineering
Group
USA Ultra Low Sulphur
Diesel Project Washington 339.52 End 2006
12
Flour
Corporation
USA
Refinery Project End 2006
13 Skanska
USA
Refinery Project Brazil 692.63 2007
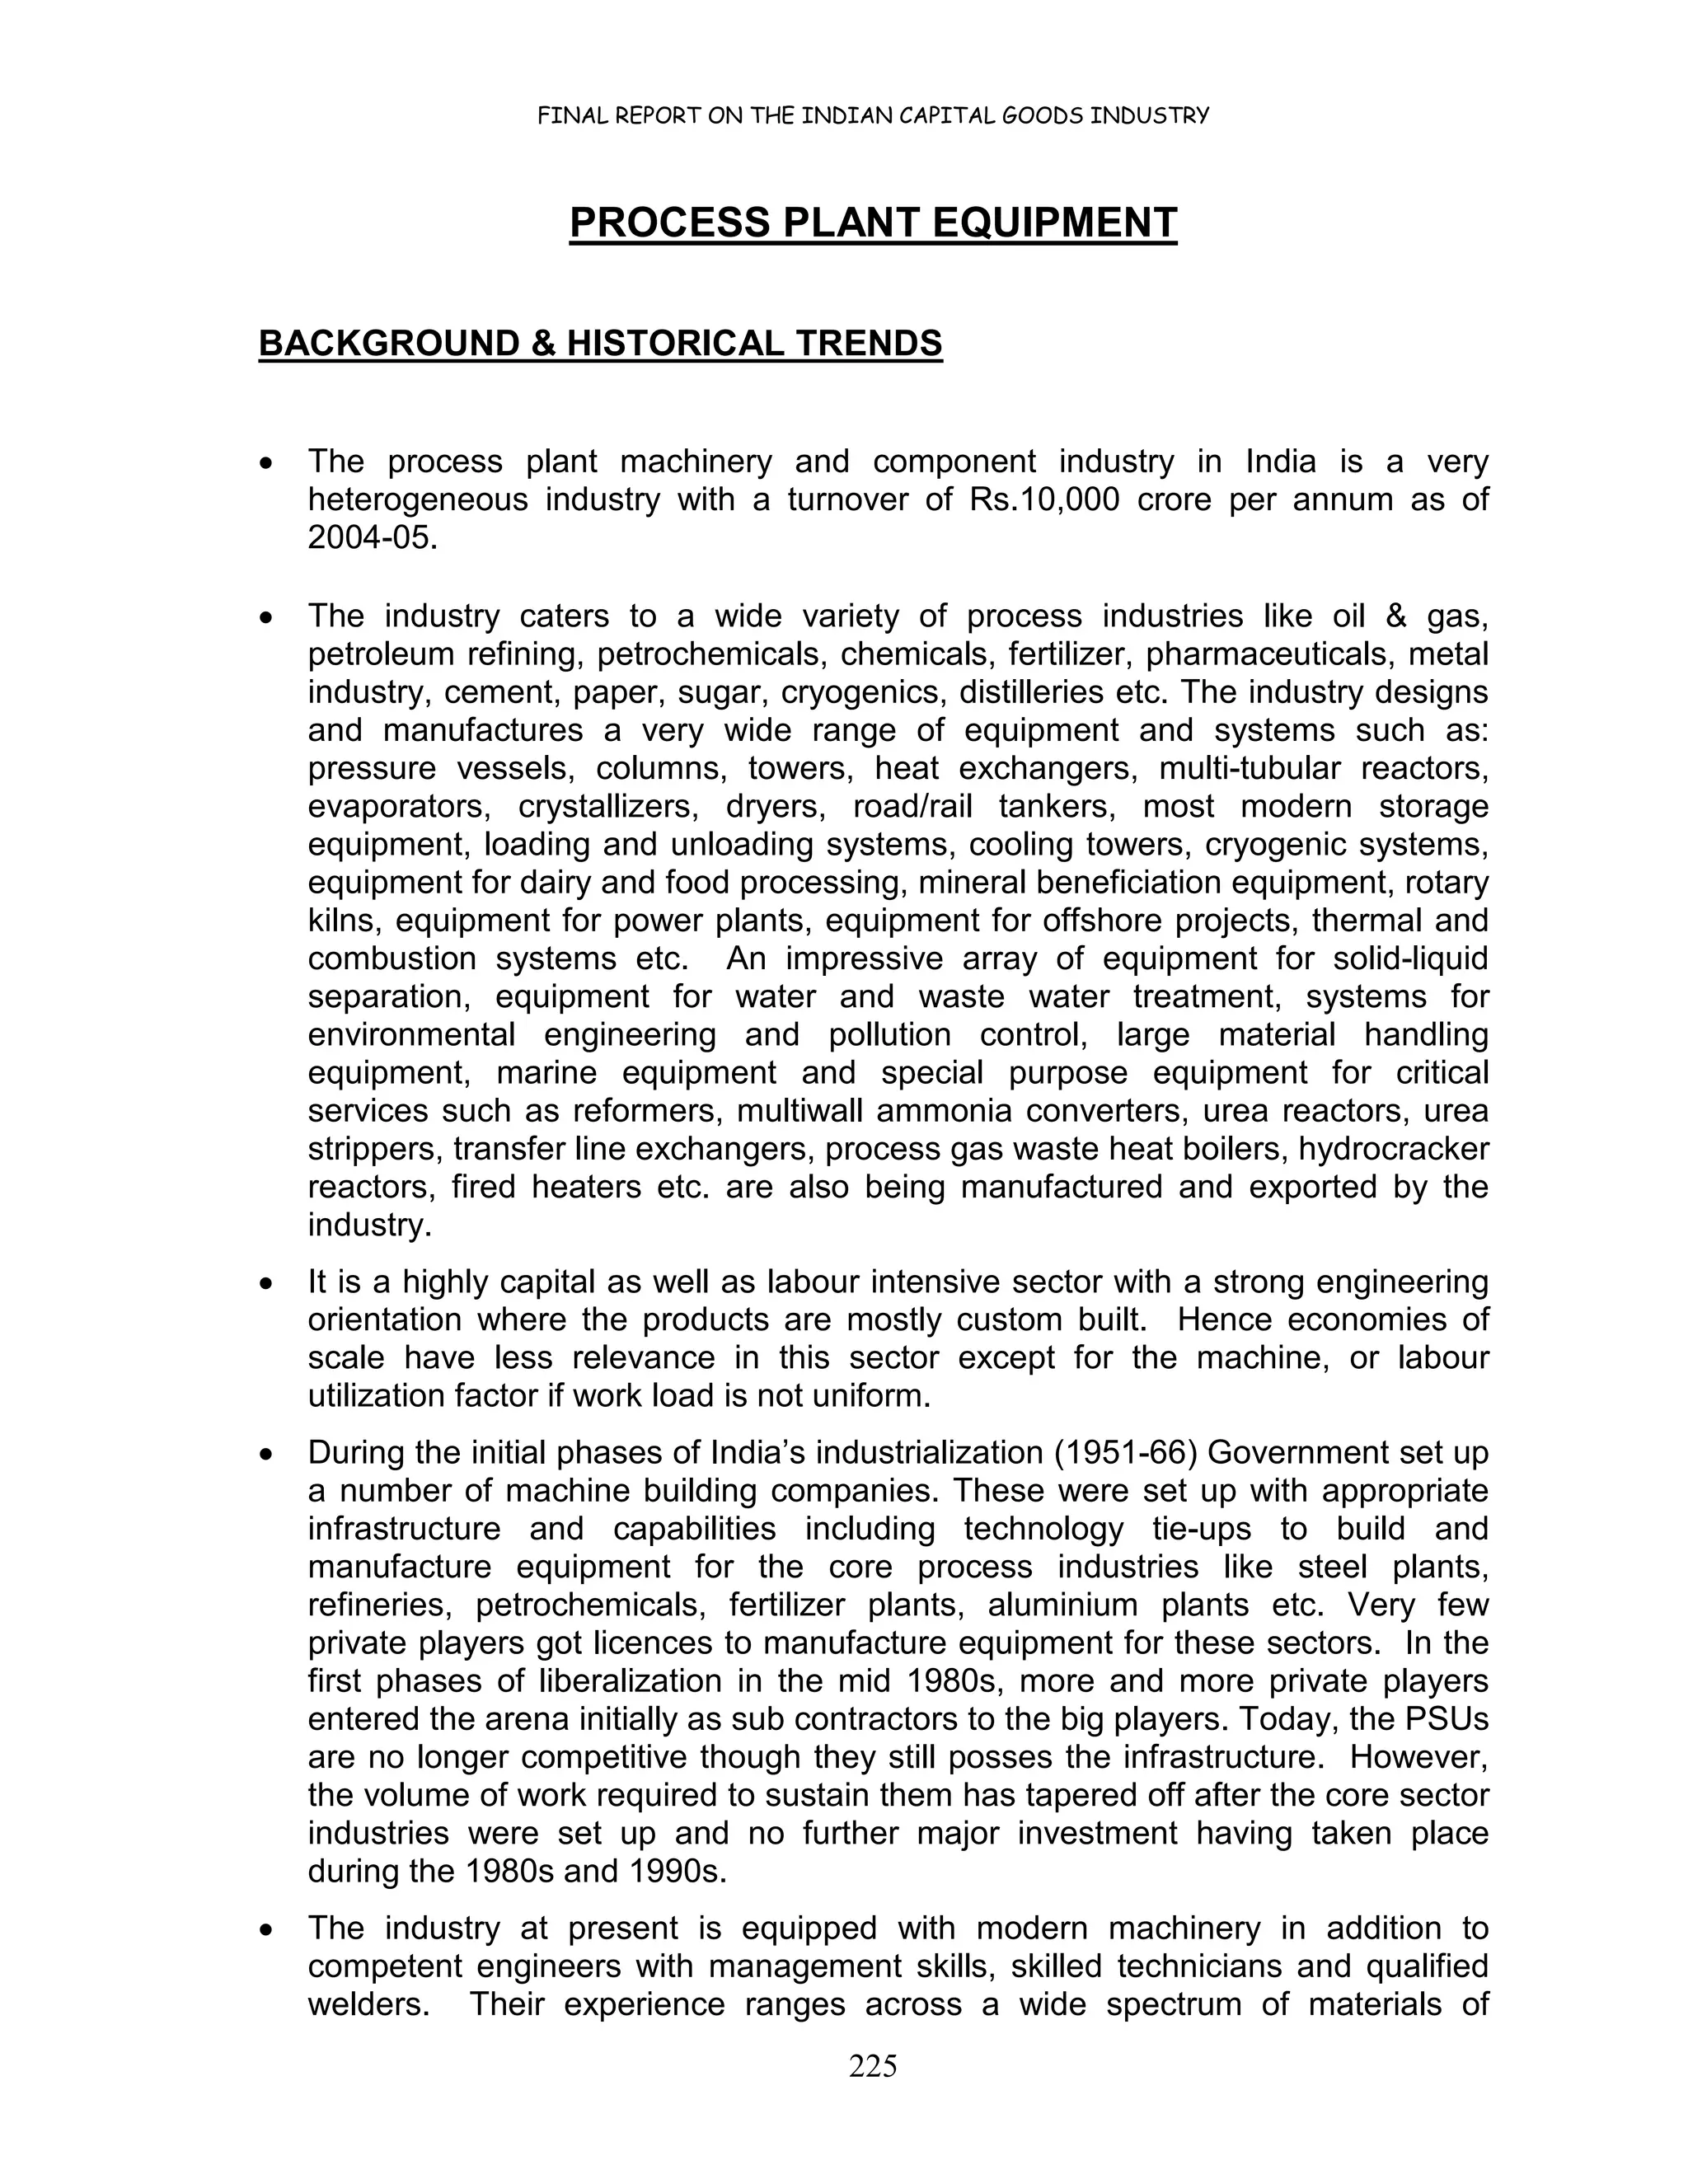
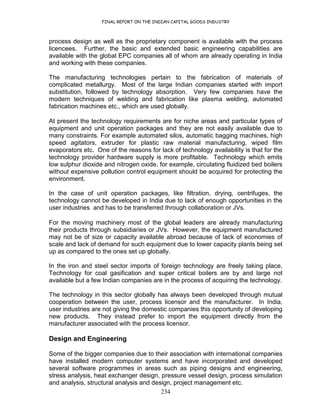
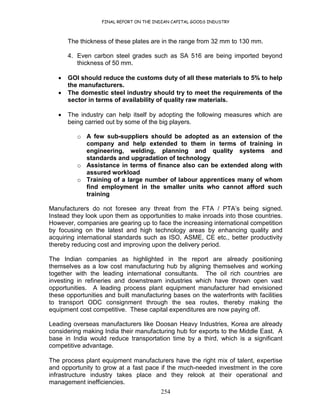
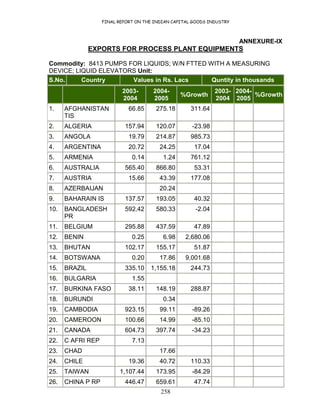
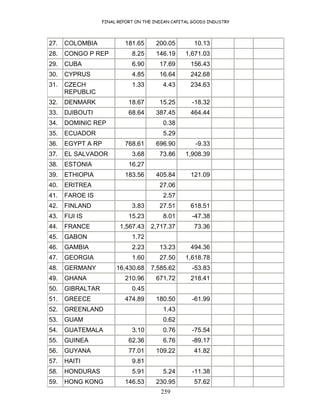
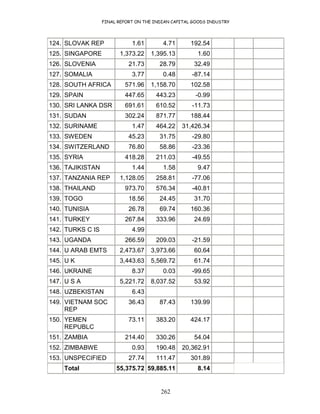
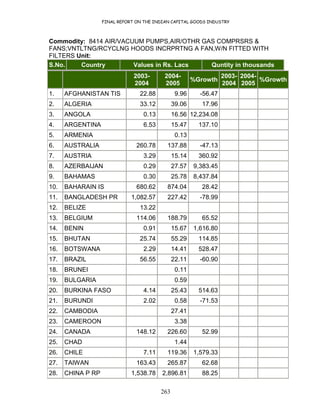
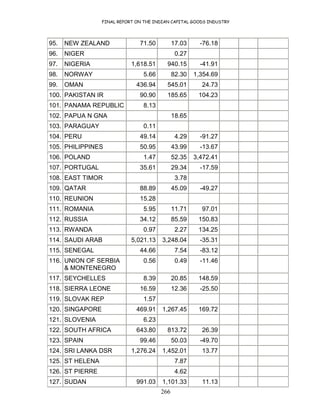
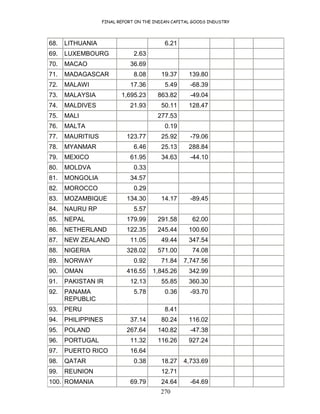
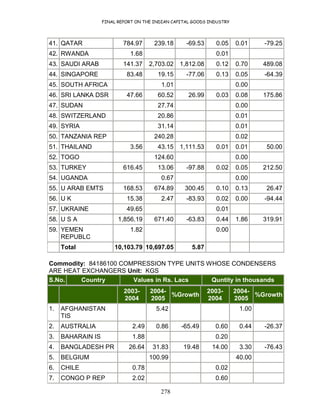
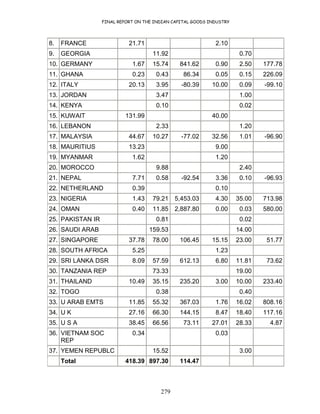
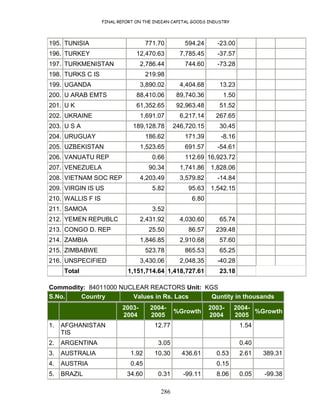
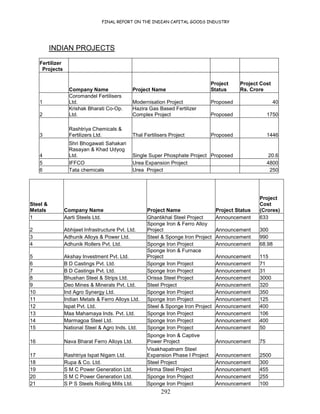
PROCESS PLANT PROJECTS ANNEXURE-X
OVERSEAS](https://image.slidesharecdn.com/processplantequipment-130815055215-phpapp01/85/Process-plant-equipment-65-320.jpg)
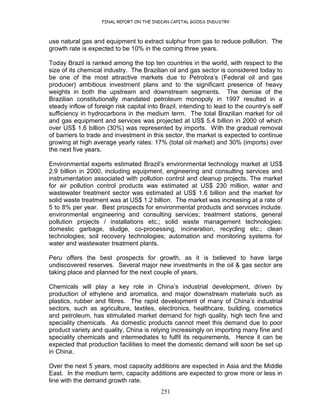
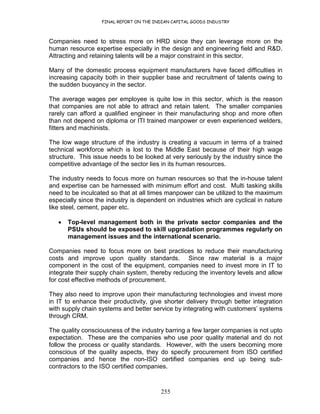
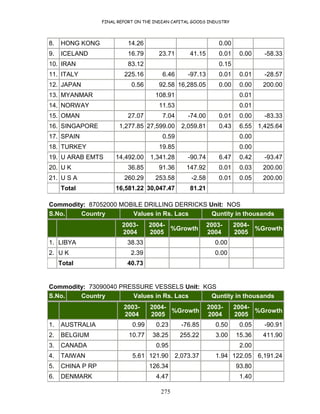
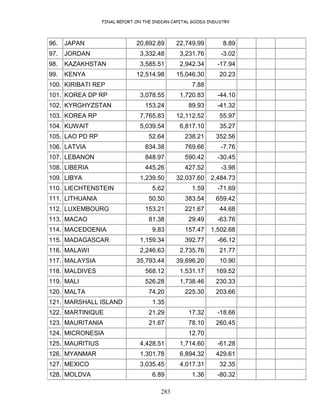
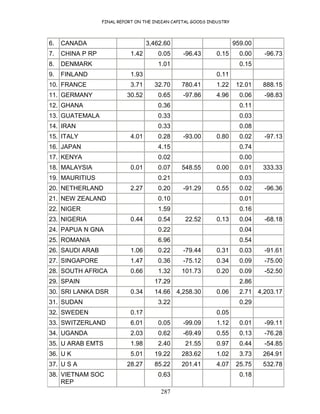
![FINAL REPORT ON THE INDIAN CAPITAL GOODS INDUSTRY
290
Authorizer Home
Country
Description of
Projects
Capacity Host
Country
Projected
Amount
(Rs.Crores)
[1 USD=
Rs45.27]
and 1
RAND =
RS.6.78
and 1
EURO =
Rs 53.65
Date of
Expiry
Fundi
ng
Auth
ority
17 Technip America Refinery Project America
End
2006
18
Oman Oil
Company Middle East Refinery project
3000
metric
ton per
day Oman
End
2008
19
Snamproget
ti Middle East Refinery project
24400
tons/day
of NGL UAE 6473.61 2008
20 BP Indonesia LNG Project
Indonesi
a 22635 2007
21
Aker
Kvaerner Netherlands
New Polythylene
plant
400,000
tpa China 2008
22
Foster
Wheeler Australia LNG Project
4.2
mntpa 7152.66 2008
23
Kupe
Limited Australia
New Gas production
station 2007
Posco South Korea Setting up Steel Plant India 54324 2016
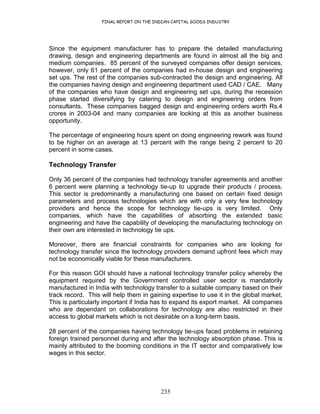
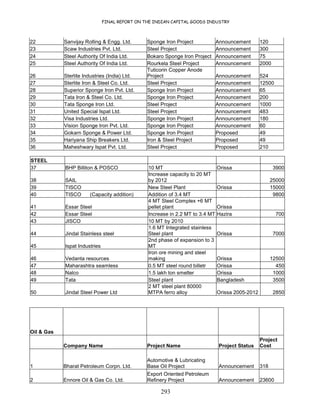
Other Global opportunities
EPC activity and
size
Region /
country
Thrust areas Competitive
landscape
Strategy for Indian firms
Refineries:
New capacity
(3.3 mn b/d)
China, Canada,
India, Iran,
Oman, Russia,
Venezuela
• Strategic partnership
with global majors
• Target lower scale
projects
• Strategic alliance with
Indian players owning
oil-fields abroad
Refineries:
Expansion
(271500 b/d)
France, Spain,
Germany, USA
Hydrotreater,
Hydrocracker,
De-sulphurisation
Profitable growth is
expected as new
projects emerge to
meet stricter
domestic regulations
and international
agreements
• Join hands with local
majors
• Target the operations
and maintenance
components of
contracts](https://image.slidesharecdn.com/processplantequipment-130815055215-phpapp01/85/Process-plant-equipment-66-320.jpg)

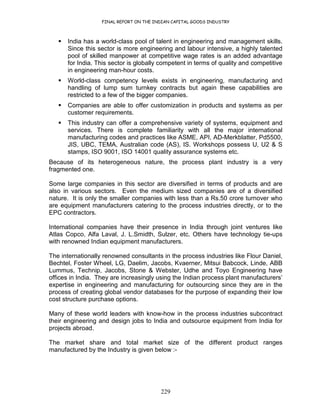
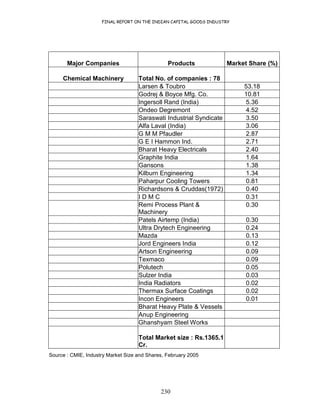
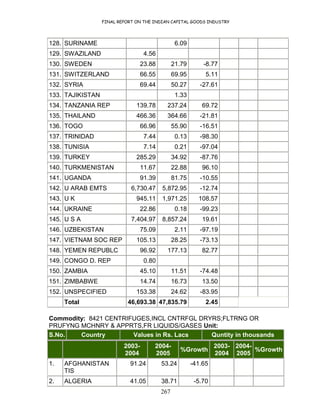
This document provides a summary of the process plant equipment industry in India. It discusses the background and historical trends of the industry, including its establishment and growth. It then discusses international trends in heavy engineering and shifts in manufacturing bases. Current status of the Indian industry is also examined, including major companies, products, market shares and the structure of the sector. The industry is projected to potentially consolidate in the future as smaller players may act as sub-contractors to larger companies.


