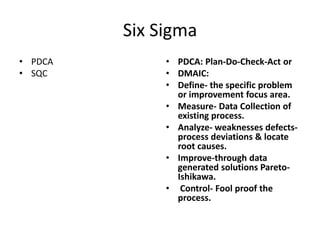
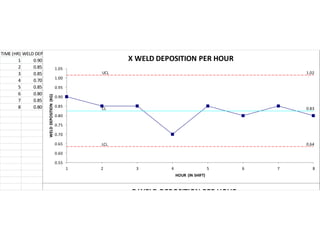
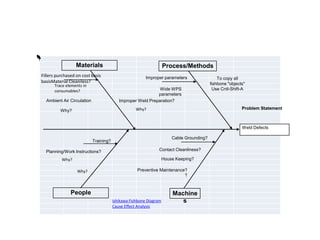
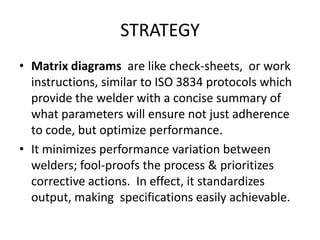
Process Optimization & Innovation
   in a Fabrication Environment
   Lean - Six Sigma implementation. A
      force multiplier for Increasing
       Performance & Profitability
Profitability gap with the competition

• A recent study by the NAM and the
  Manufacturers Alliance (MAPI) found that U.S.
  companies have a 22 percent unit-cost
  disadvantage compared with overseas
  competitors in a number of process operational
  cost areas, a major one being energy.
• According to EDC Chief Economist Peter Hall;
  "Managing through the upcoming slow months
  and a continued high dollar will require ingenuity
  and grit,........ Canada can expect even more
  intense competition.”
Process Optimization is the most cost effective solution to
improving productivity. Implementation improves a
company’s ability to lower operating costs & compete
internationally.

Lean targets the root cause of operational inefficiencies
identifying and eliminating waste and in tandem with Six
Sigma based statistical quality control protocols ensures the
production of an error or defect free product.

Process Optimization has 2 dependences/components;
Lean-which focuses on processing efficiency & Six Sigma-
which focuses on product (or service) accuracy by targeting
variation in output. Both are data-driven approaches to
problem resolution rather than personal opinions or
beliefs.
Lean - Six Sigma implementation is thus that silver bullet;
that can level the playground of global competitiveness.
It is that force multiplier for Increasing Performance &
Profitability; that minimizes the effect of lower labor
costs; by significantly
increasing the productivity of the work force.

LEAN targets WASTE. Delay, waste, non-value added work
such as, unnecessary transportation, and motion, waiting
for information needed for a decision, making mistakes
that have to be corrected, etc. are all forms of waste and
rework that affect costs & schedules.
The October 2011 issue of the Harvard Business
Review, states:
 "Lean principles can generate significant benefits: faster
response time, higher quality and creativity, lower
costs, reduced drudgery and frustration and greater job
satisfaction." ………….. "Knowledge workers ... grossly
underestimate the amount of inefficiency that could be
eradicated from their jobs."

Delay, waste, non-value added work such as, unnecessary
transportation, and motion, waiting for information needed
for a decision, making mistakes that have to be
corrected, etc are all forms of waste and rework that affect
costs & schedules.
According to Tata Steel "To remain competitive, companies
essentially have to improve business performance. They have to
create a focus on the bottom line.
They have to reduce mistakes in every aspect of the company:
product defects, incorrect billing, wasted materials and
inefficient production
processes. Six Sigma is a disciplined methodology that focuses
on moving every process, product and service toward near-
perfect quality."

The example of GE, Ford, Tata & many others, validate that
implementing Lean & Six Sigma is a proven driver to corporate
profits.
Implementing a Lean mindset also means accurately
                     analyzing costs.
        The following is a case study from Lean.org
•   When a customer approached its aluminum casting supplier, a job shop near
    Chicago, with the "China price" in hand for a key part, the supplier made an
    unusual suggestion: Before relocating the work, let's do some "lean math"
    together.

•   The lean math analysis looked beyond piece price plus slow freight costs from
    China and counted such factors, among others, as:

•   Increasing lead time from 12 days to 115
•   Additional freight
•   Duty
•   Carrying costs for additional safety stock inventory
•   Increased warranty and scrap costs.
•   Instead of re-sourcing, the customer pursued cost, quality, and lead time savings
    through extended value-stream mapping with its current supplier in Chicago.
LEAN & SIX SIGMA protocols of Quality Assurance involve data collection &
analysis.
The root cause of any problem can be located & in effect solved.
In the fabrication industry this is almost not done, with the emphasis being
on QC (code compliance), which by definition is resource draining.
My own theory is that fabrication industry, by & large, considers welding as
an art; never mind that welding procedures (WPS) are rigorously
documented. Till such time as the industry makes an effort to collect
operational data; the value (resource) enhancing ability of QA cannot be
leveraged.
Analyzing process data and identifying root causes for defects & deviations
leads to implementation of corrective actions & fool-proofing of errors
Lean Six Sigma Strategies
Problem Statement    Goal
• DELAY              • FASTER PROCESSING (LEAN)

• DEFECT             • BETTER PRODUCT (6 Sigma)

• DEVIATION          • CHEAPER PRODUCTION
                       COSTS (6 Sigma)
Lean promotes efficiency by
ensuring breakdown free
production & targets operational
waste through drastic reduction in
repair or re-work.

Six Sigma targets product (or
service) variation by tracking
process/product metrics. The goal
is to reduce process or product
variation (or process/product
defects) to 3.4 (6 Sigma); spaced
over a million operations.
LEAN targets Waste as the enemy of any process.
WASTES like Delay, Repair, Rework, any value depleting
operations such as, unnecessary transportation and motion of
material or people, waiting for information needed for a
decision, etc.; anything that affect costs and schedules.

By identifying and eliminating it, you can transform your
company into a Leaner, and ultimately, a more profitable
organization.
Lean targets the root cause of operational inefficiencies
identifying and eliminating waste and in tandem with Six
Sigma based statistical quality control protocols ensures the
production of an error or defect free product.
Lean & Six Sigma
   Process Optimization has 2 dependences/components; Lean-which focuses on processing
efficiency & Six Sigma- which focuses on product (or service) accuracy by targeting variation in
output. Both are data-driven approaches to problem resolution rather than personal opinions or
                                           beliefs.

LEAN                                              SIX SIGMA
• Lean promotes efficiency by                     • Six Sigma targets product
  ensuring breakdown free                            (or service) variation by
  production & targets                               tracking process/product
  operational waste through                          metrics. The goal is to
  drastic reduction in repair                        reduce process or product
  or re-work.                                        variation (or
                                                     process/product defects) to
                                                     3.4; spaced over a million
                                                     operations.
Lean
•   Waste is the enemy of any process. By identifying   •   Over production. E.g. E.g. Over re-inforcing the
    and eliminating it, you can transform your              weld. Worse, welding a root pass too wide leads to
    company into a Leaner, and ultimately, a more           the bead sagging in the overhead position.
    profitable organization.                            •   Waiting (time delays or idle time between
                                                            processes). E.g. completion of NDE, poor scheduling
                                                            of filling passes.
                                                        •   Transportation ( Improper or unnecessary
                                                            handling);E.g. Poor logistics planning, leading to
                                                            repeated moving welded cans or plates.
                                                        •   Inventory Holding or purchasing excessive
                                                            material, or materials not meeting code or client
                                                            specification.
                                                        •   Motion Non productive/non value adding
                                                            operations such as Materials & tools needing to be
                                                            located (poor housekeeping);located at a distance;
                                                        •   or for repair of defects.
                                                        •   Over processing (Unnecessary processing steps that
                                                            lead to producing scrap or parts that require
                                                            rework.
                                                        •   Defects
                                                        •   Ignoring innovation. Not using human resources
                                                            optimally (not implementing the ideas / suggestions
                                                            of employees).Not empowering/involving
                                                            employees in optimization campaigns.
Six Sigma
• PDCA        • PDCA: Plan-Do-Check-Act or
• SQC         • DMAIC:
              • Define- the specific problem
                or improvement focus area.
              • Measure- Data Collection of
                existing process.
              • Analyze- weaknesses defects-
                process deviations & locate
                root causes.
              • Improve-through data
                generated solutions Pareto-
                Ishikawa.
              • Control- Fool proof the
                process.
STRATEGY
• One does not need to invest in exotic & expensive
  statistical protocols & further invest in training to
  accrue benefits. Leveraging QA personnel into simple
  data collection & analysis duties as enumerated below.
• Mapping (flow-charting) the process.
• Value Stream Maps will identify the process steps that
  are causing delays. Action can then be taken to remove
  the source of those delays.
• Spaghetti Diagrams will in turn identify and eliminate
  unnecessary movement of people or materials.
STRATEGY
• Control Charting to measure and monitor the
  performance of any process.
• See the example of tracking weld deposition
  rates of various welders through a shift, as
  well as, an individual welder through an 8
  hour shift.
• The plan of action is to locate a root cause or
  causes that contribute to performance.
welder id weld deposit
                    UCL                                    +2 Sigma +1 Sigma Average -1 Sigma -2 Sigma LCL       LastCell Range     UCL        +2 Sigma +1 Sigma Average
A               8.0                                 9.1          8.6      8.0       7.5    7.0 X weld deposition
                                                                                                    6.4      5.9         8                                             0.6
B               7.5                                 9.1          8.6      8.0       7.5    7.0      6.4      5.9       7.5      0.5      2.0         1.5      1.1      0.6
                                                   9.8
C               6.5                                 9.1          8.6      8.0       7.5    7.0      6.4      5.9       6.5      1.0      2.0         1.5      1.1      0.6
D               6.0                                 9.1
                                                   9.3           8.6 UCL 8.0        7.5    7.0      6.4      5.9         6      0.5      2.0         1.5      1.1   9.10.6
E               7.0                                 9.1          8.6      8.0       7.5    7.0      6.4      5.9         7      1.0      2.0         1.5      1.1      0.6
                                                   8.8
F               7.5                                 9.1          8.6      8.0       7.5    7.0      6.4      5.9       7.5      0.5      2.0         1.5      1.1      0.6
                     weld deposition in Kg/shift


G               8.0                                 9.1
                                                   8.3           8.6      8.0       7.5    7.0      6.4      5.9         8      0.5      2.0         1.5      1.1      0.6
H               7.5                                 9.1          8.6      8.0       7.5    7.0      6.4      5.9       7.5      0.5      2.0         1.5      1.1      0.6
                                                   7.8
I               8.5                                 9.1          8.6 CL 8.0         7.5    7.0      6.4      5.9       8.5      1.0      2.0         1.5      1.1   7.50.6
J               8.5                                 9.1
                                                   7.3           8.6      8.0       7.5    7.0      6.4      5.9       8.5      0.0      2.0         1.5      1.1      0.6
                                                    9.1          8.6      8.0       7.5    7.0      6.4      5.9       8.5            1.9965    1.534704 1.072907      0.6
                                                   6.8
                                                    9.1          8.6      8.0       7.5    7.0      6.4      5.9       8.5            1.9965    1.534704 1.072907      0.6
                                                    9.1
                                                   6.3
                                                                 8.6      8.0       7.5    7.0      6.4      5.9       8.5            1.9965    1.534704 1.072907      0.6
                                                    9.1          8.6 LCL 8.0        7.5    7.0      6.4      5.9       8.5            1.9965    1.534704 1.072907   5.9
                                                                                                                                                                       0.6
                                                    9.1
                                                   5.8           8.6      8.0       7.5    7.0      6.4      5.9       8.5            1.9965    1.534704 1.072907      0.6
                                                    9.1          8.6      8.0       7.5    7.0      6.4      5.9       8.5            1.9965    1.534704 1.072907      0.6
                                                   5.3
                                                    9.1A         8.6 B 8.0        C
                                                                                    7.5    7.0
                                                                                             D
                                                                                                    6.4 E    5.9     F
                                                                                                                       8.5       G
                                                                                                                                      1.9965   H
                                                                                                                                                1.534704 1.072907
                                                                                                                                                            I
                                                                                                                                                                       0.6
                                                                                                                                                                       J
                                                    9.1          8.6      8.0       7.5    7.0      6.4      5.9       8.5            1.9965    1.534704 1.072907      0.6
                                                                                                           welder ID
                                                    9.1          8.6      8.0       7.5    7.0      6.4      5.9       8.5            1.9965    1.534704 1.072907      0.6
                                                    9.1          8.6      8.0       7.5    7.0      6.4      5.9       8.5            1.9965    1.534704 1.072907      0.6
                                                                                              mR weld deposition
TIME (HR) WELD DEPOSIT
                   UCL                          +2 Sigma +1 Sigma Average -1 Sigma -2 Sigma LCL       LastCell Range     UCL         +2 Sigma +1 Sigma Average
        1     0.90                         1.02      0.95     0.89     0.83 X WELD DEPOSITION PER HOUR
                                                                                0.76     0.70    0.64         0.9                                           0.07
        2     0.85                         1.02
                                           1.05      0.95     0.89     0.83     0.76     0.70    0.64       0.85    0.05      0.23        0.18      0.13    0.07
        3     0.85                         1.02      0.95       UCL
                                                              0.89     0.83     0.76     0.70    0.64       0.85    0.00      0.23        0.18      0.13  1.02
                                                                                                                                                            0.07
                                           1.00
        4     0.70                         1.02      0.95     0.89     0.83     0.76     0.70    0.64         0.7   0.15      0.23        0.18      0.13    0.07
        5     0.85                         1.02
                                           0.95      0.95     0.89     0.83     0.76     0.70    0.64       0.85    0.15      0.23        0.18      0.13    0.07
        6     0.80                         1.02      0.95     0.89     0.83     0.76     0.70    0.64         0.8   0.05      0.23        0.18      0.13    0.07
                    WELD DEPOSITION (KG)


                                           0.90
        7     0.85                         1.02      0.95     0.89     0.83     0.76     0.70    0.64       0.85    0.05      0.23        0.18      0.13    0.07
        8     0.80                         0.85
                                           1.02      0.95     0.89     0.83     0.76     0.70    0.64         0.8   0.05      0.23        0.18      0.13    0.07
                                                                CL                                                                                        0.83
                                           1.02
                                           0.80      0.95     0.89     0.83     0.76     0.70    0.64         0.8         0.233357   0.179381 0.125405      0.07
                                           1.02      0.95     0.89     0.83     0.76     0.70    0.64         0.8         0.233357   0.179381 0.125405      0.07
                                           0.75
                                           1.02      0.95     0.89     0.83     0.76     0.70    0.64         0.8         0.233357   0.179381 0.125405      0.07
                                           1.02
                                           0.70      0.95     0.89     0.83     0.76     0.70    0.64         0.8         0.233357   0.179381 0.125405      0.07
                                           1.02      0.95     0.89     0.83     0.76     0.70    0.64         0.8         0.233357   0.179381 0.125405      0.07
                                           0.65                 LCL                                                                                       0.64
                                           1.02      0.95     0.89     0.83     0.76     0.70    0.64         0.8         0.233357   0.179381 0.125405      0.07
                                           0.60
                                           1.02      0.95     0.89     0.83     0.76     0.70    0.64         0.8         0.233357   0.179381 0.125405      0.07
                                           1.02
                                           0.55      0.95     0.89     0.83     0.76     0.70    0.64         0.8         0.233357   0.179381 0.125405      0.07
                                           1.02 1    0.95     0.89
                                                                2      0.83   3 0.76     0.70 4  0.64         0.8
                                                                                                              5           0.233357
                                                                                                                            6        0.179381 7 0.125405    0.07
                                                                                                                                                             8
                                           1.02      0.95     0.89     0.83     0.76     0.70 HOUR (IN SHIFT) 0.8
                                                                                                 0.64                     0.233357   0.179381 0.125405      0.07
                                           1.02      0.95     0.89     0.83     0.76     0.70    0.64         0.8         0.233357   0.179381 0.125405      0.07
                                           1.02      0.95     0.89     0.83     0.76     0.70    0.64         0.8         0.233357   0.179381 0.125405      0.07
                                                                         mR WELD DEPOSITION PER HOUR
STRATEGY
• These control charts can then be used to
  identify & benchmark best performance.
• Using the benchmarked performance of
  FIG.1, the individual control chart FIG.2 can
  now be analyzed to locate reasons for
  performance deviation.
• Aside from time, factors such as current, arc
  distance, time to change the electrode, etc.
  can all be analyzed.
STRATEGY
• Once identified, the root causes of the bottle-
  necks in the process can now be
  targeted, using Pareto graphing, & Ishikawa
  (fish bone) diagrams.
• The example below, shows types of
  defects/discontinuities noticed during a
  standard vessel fabrication campaign & the
  methodology of eliminating them.
Pareto Chart
Materials                                         Process/Methods
Fillers purchased on cost basis                          Improper parameters                   To copy all
basisMaterial Cleaniless?                                                                  fishbone "objects"
      Trace elements in
      consumables?                                            Wide WPS                      Use Cntl-Shift-A
                                                             parameters
  Ambient Air Circulation                  Improper Weld Preparation?
                                                    Why?                                                   Problem Statement
          Why?


                                                                                                           Weld Defects

                                                                        Cable Grounding?
                            Training?

  Planning/Work Instructions?                                  Contact Cleanliness?

          Why?                                                      House Keeping?

                  Why?                              Preventive Maintenance?
                                                                          ?


               People                                                   Machine
                                        Ishikawa Fishbone Diagram          s
                                        Cause Effect Analysis
The Fish bone or Ishikawa diagram is a systematic way of generating and sorting
hypotheses about possible causes of a problem., through CAUSE & ANALYSIS.
The effect of Process Variables can be demonstrated through a problem statement.
Following a protocol known as 5 Why’s, that is, asking “Why” 5 times for any problem
occurrence; a foundation is laid for identifying the root causes of any problem.
Once the root causes of problems are identified, an action plan can be put in place to
solve the source of production disruption rather than just the symptoms.
STRATEGY
• Matrix diagrams are like check-sheets, or work
  instructions, similar to ISO 3834 protocols which
  provide the welder with a concise summary of
  what parameters will ensure not just adherence
  to code, but optimize performance.
• It minimizes performance variation between
  welders; fool-proofs the process & prioritizes
  corrective actions. In effect, it standardizes
  output, making specifications easily achievable.
Conclusion
• Call to Management.
• Spending time on grinding spatter, chipping
  slag, grinding welds down to final size or
  reworking/repairing parts, is a resource depleting
  effort. It slows production rates, reduces operational
  efficiencies dramatically; & drains value from the
  project.
• Not tracking performance on the shop floor is
  equivalent to not tracking your personal finances or
  instruments. It is a recipe for disaster especially in
  competitive international environments.
Cost effective solutions are readily available to remove
Defects, Deviations & Delays from your process.
You don’t have to spend huge amounts on consultants,
expensive software or training &/or hiring statisticians to
optimize your operations.
You can leverage your existing QC personnel from their
current function as statutory (code) requirement
enforcers, which does not add value to the process.
Instead of a regime of pass-fail, essentially pointing out a
problem (non-conformance) after the fact; have them
initiate a data collection & analysis drive. The root causes
will be located & the process re-designed to eliminate the
source of the defects or deviations.
Conclusion
• Call to QC/QA personnel.
• Get out of the rut of constant conflict with production, issuing
  warnings, NCR’s , basically conducting a janitorial clean up every
  time a code violation occurs.
• Take a leaf out of the project management groups’ operational
  protocols. Chart out an action plan; plan a schedule. Begin with just
  a small amount of data & control chart it.
• Involve welders & supervisors in locating the root cause. You will
  generate a shop floor ally.
• It is a statistical fact that over 95% of the problems can be
  attributed to the process, not to the individual.
• The documented results & the joint effort solutions will result in a
  reduction in repair & schedule delay, something that will be noticed
  & appreciated.
• Nothing shines like documented profit.
Conclusion
• RTS can provide guidance & training through
  simple, uncomplicated collection & analysis of
  process data, using very cost effective &
  uncomplicated software (under $300) to expose
  the root cause.
• Once the root cause or process deficiencies are
  eliminated; the Quality function will become a
  value addition & improve the bottom line.
• Get a true understanding of the cost of welding, &
  use Lean & Six Sigma to generate corrective actions
  to become internationally competitive.
Raya Technical Services
• We provide process Optimization services
  through implementation of Lean & Six Sigma

• http://www.rayatechnicalservices.com/lean_si
  x_sigma
• http://rayatechnicalservices.com/submerged_
  arc_welding_nozzles
• http://rayatechnicalservices.com/rfid_process
  _optimization_through_traceability

Process optimization & innovation in fabrication

  • 1.
    Process Optimization &Innovation in a Fabrication Environment Lean - Six Sigma implementation. A force multiplier for Increasing Performance & Profitability
  • 2.
    Profitability gap withthe competition • A recent study by the NAM and the Manufacturers Alliance (MAPI) found that U.S. companies have a 22 percent unit-cost disadvantage compared with overseas competitors in a number of process operational cost areas, a major one being energy. • According to EDC Chief Economist Peter Hall; "Managing through the upcoming slow months and a continued high dollar will require ingenuity and grit,........ Canada can expect even more intense competition.”
  • 3.
    Process Optimization isthe most cost effective solution to improving productivity. Implementation improves a company’s ability to lower operating costs & compete internationally. Lean targets the root cause of operational inefficiencies identifying and eliminating waste and in tandem with Six Sigma based statistical quality control protocols ensures the production of an error or defect free product. Process Optimization has 2 dependences/components; Lean-which focuses on processing efficiency & Six Sigma- which focuses on product (or service) accuracy by targeting variation in output. Both are data-driven approaches to problem resolution rather than personal opinions or beliefs.
  • 4.
    Lean - SixSigma implementation is thus that silver bullet; that can level the playground of global competitiveness. It is that force multiplier for Increasing Performance & Profitability; that minimizes the effect of lower labor costs; by significantly increasing the productivity of the work force. LEAN targets WASTE. Delay, waste, non-value added work such as, unnecessary transportation, and motion, waiting for information needed for a decision, making mistakes that have to be corrected, etc. are all forms of waste and rework that affect costs & schedules.
  • 5.
    The October 2011issue of the Harvard Business Review, states: "Lean principles can generate significant benefits: faster response time, higher quality and creativity, lower costs, reduced drudgery and frustration and greater job satisfaction." ………….. "Knowledge workers ... grossly underestimate the amount of inefficiency that could be eradicated from their jobs." Delay, waste, non-value added work such as, unnecessary transportation, and motion, waiting for information needed for a decision, making mistakes that have to be corrected, etc are all forms of waste and rework that affect costs & schedules.
  • 6.
    According to TataSteel "To remain competitive, companies essentially have to improve business performance. They have to create a focus on the bottom line. They have to reduce mistakes in every aspect of the company: product defects, incorrect billing, wasted materials and inefficient production processes. Six Sigma is a disciplined methodology that focuses on moving every process, product and service toward near- perfect quality." The example of GE, Ford, Tata & many others, validate that implementing Lean & Six Sigma is a proven driver to corporate profits.
  • 7.
    Implementing a Leanmindset also means accurately analyzing costs. The following is a case study from Lean.org • When a customer approached its aluminum casting supplier, a job shop near Chicago, with the "China price" in hand for a key part, the supplier made an unusual suggestion: Before relocating the work, let's do some "lean math" together. • The lean math analysis looked beyond piece price plus slow freight costs from China and counted such factors, among others, as: • Increasing lead time from 12 days to 115 • Additional freight • Duty • Carrying costs for additional safety stock inventory • Increased warranty and scrap costs. • Instead of re-sourcing, the customer pursued cost, quality, and lead time savings through extended value-stream mapping with its current supplier in Chicago.
  • 8.
    LEAN & SIXSIGMA protocols of Quality Assurance involve data collection & analysis. The root cause of any problem can be located & in effect solved. In the fabrication industry this is almost not done, with the emphasis being on QC (code compliance), which by definition is resource draining. My own theory is that fabrication industry, by & large, considers welding as an art; never mind that welding procedures (WPS) are rigorously documented. Till such time as the industry makes an effort to collect operational data; the value (resource) enhancing ability of QA cannot be leveraged. Analyzing process data and identifying root causes for defects & deviations leads to implementation of corrective actions & fool-proofing of errors
  • 9.
    Lean Six SigmaStrategies Problem Statement Goal • DELAY • FASTER PROCESSING (LEAN) • DEFECT • BETTER PRODUCT (6 Sigma) • DEVIATION • CHEAPER PRODUCTION COSTS (6 Sigma)
  • 10.
    Lean promotes efficiencyby ensuring breakdown free production & targets operational waste through drastic reduction in repair or re-work. Six Sigma targets product (or service) variation by tracking process/product metrics. The goal is to reduce process or product variation (or process/product defects) to 3.4 (6 Sigma); spaced over a million operations.
  • 11.
    LEAN targets Wasteas the enemy of any process. WASTES like Delay, Repair, Rework, any value depleting operations such as, unnecessary transportation and motion of material or people, waiting for information needed for a decision, etc.; anything that affect costs and schedules. By identifying and eliminating it, you can transform your company into a Leaner, and ultimately, a more profitable organization. Lean targets the root cause of operational inefficiencies identifying and eliminating waste and in tandem with Six Sigma based statistical quality control protocols ensures the production of an error or defect free product.
  • 12.
    Lean & SixSigma Process Optimization has 2 dependences/components; Lean-which focuses on processing efficiency & Six Sigma- which focuses on product (or service) accuracy by targeting variation in output. Both are data-driven approaches to problem resolution rather than personal opinions or beliefs. LEAN SIX SIGMA • Lean promotes efficiency by • Six Sigma targets product ensuring breakdown free (or service) variation by production & targets tracking process/product operational waste through metrics. The goal is to drastic reduction in repair reduce process or product or re-work. variation (or process/product defects) to 3.4; spaced over a million operations.
  • 13.
    Lean • Waste is the enemy of any process. By identifying • Over production. E.g. E.g. Over re-inforcing the and eliminating it, you can transform your weld. Worse, welding a root pass too wide leads to company into a Leaner, and ultimately, a more the bead sagging in the overhead position. profitable organization. • Waiting (time delays or idle time between processes). E.g. completion of NDE, poor scheduling of filling passes. • Transportation ( Improper or unnecessary handling);E.g. Poor logistics planning, leading to repeated moving welded cans or plates. • Inventory Holding or purchasing excessive material, or materials not meeting code or client specification. • Motion Non productive/non value adding operations such as Materials & tools needing to be located (poor housekeeping);located at a distance; • or for repair of defects. • Over processing (Unnecessary processing steps that lead to producing scrap or parts that require rework. • Defects • Ignoring innovation. Not using human resources optimally (not implementing the ideas / suggestions of employees).Not empowering/involving employees in optimization campaigns.
  • 14.
    Six Sigma • PDCA • PDCA: Plan-Do-Check-Act or • SQC • DMAIC: • Define- the specific problem or improvement focus area. • Measure- Data Collection of existing process. • Analyze- weaknesses defects- process deviations & locate root causes. • Improve-through data generated solutions Pareto- Ishikawa. • Control- Fool proof the process.
  • 15.
    STRATEGY • One doesnot need to invest in exotic & expensive statistical protocols & further invest in training to accrue benefits. Leveraging QA personnel into simple data collection & analysis duties as enumerated below. • Mapping (flow-charting) the process. • Value Stream Maps will identify the process steps that are causing delays. Action can then be taken to remove the source of those delays. • Spaghetti Diagrams will in turn identify and eliminate unnecessary movement of people or materials.
  • 16.
    STRATEGY • Control Chartingto measure and monitor the performance of any process. • See the example of tracking weld deposition rates of various welders through a shift, as well as, an individual welder through an 8 hour shift. • The plan of action is to locate a root cause or causes that contribute to performance.
  • 17.
    welder id welddeposit UCL +2 Sigma +1 Sigma Average -1 Sigma -2 Sigma LCL LastCell Range UCL +2 Sigma +1 Sigma Average A 8.0 9.1 8.6 8.0 7.5 7.0 X weld deposition 6.4 5.9 8 0.6 B 7.5 9.1 8.6 8.0 7.5 7.0 6.4 5.9 7.5 0.5 2.0 1.5 1.1 0.6 9.8 C 6.5 9.1 8.6 8.0 7.5 7.0 6.4 5.9 6.5 1.0 2.0 1.5 1.1 0.6 D 6.0 9.1 9.3 8.6 UCL 8.0 7.5 7.0 6.4 5.9 6 0.5 2.0 1.5 1.1 9.10.6 E 7.0 9.1 8.6 8.0 7.5 7.0 6.4 5.9 7 1.0 2.0 1.5 1.1 0.6 8.8 F 7.5 9.1 8.6 8.0 7.5 7.0 6.4 5.9 7.5 0.5 2.0 1.5 1.1 0.6 weld deposition in Kg/shift G 8.0 9.1 8.3 8.6 8.0 7.5 7.0 6.4 5.9 8 0.5 2.0 1.5 1.1 0.6 H 7.5 9.1 8.6 8.0 7.5 7.0 6.4 5.9 7.5 0.5 2.0 1.5 1.1 0.6 7.8 I 8.5 9.1 8.6 CL 8.0 7.5 7.0 6.4 5.9 8.5 1.0 2.0 1.5 1.1 7.50.6 J 8.5 9.1 7.3 8.6 8.0 7.5 7.0 6.4 5.9 8.5 0.0 2.0 1.5 1.1 0.6 9.1 8.6 8.0 7.5 7.0 6.4 5.9 8.5 1.9965 1.534704 1.072907 0.6 6.8 9.1 8.6 8.0 7.5 7.0 6.4 5.9 8.5 1.9965 1.534704 1.072907 0.6 9.1 6.3 8.6 8.0 7.5 7.0 6.4 5.9 8.5 1.9965 1.534704 1.072907 0.6 9.1 8.6 LCL 8.0 7.5 7.0 6.4 5.9 8.5 1.9965 1.534704 1.072907 5.9 0.6 9.1 5.8 8.6 8.0 7.5 7.0 6.4 5.9 8.5 1.9965 1.534704 1.072907 0.6 9.1 8.6 8.0 7.5 7.0 6.4 5.9 8.5 1.9965 1.534704 1.072907 0.6 5.3 9.1A 8.6 B 8.0 C 7.5 7.0 D 6.4 E 5.9 F 8.5 G 1.9965 H 1.534704 1.072907 I 0.6 J 9.1 8.6 8.0 7.5 7.0 6.4 5.9 8.5 1.9965 1.534704 1.072907 0.6 welder ID 9.1 8.6 8.0 7.5 7.0 6.4 5.9 8.5 1.9965 1.534704 1.072907 0.6 9.1 8.6 8.0 7.5 7.0 6.4 5.9 8.5 1.9965 1.534704 1.072907 0.6 mR weld deposition
  • 18.
    TIME (HR) WELDDEPOSIT UCL +2 Sigma +1 Sigma Average -1 Sigma -2 Sigma LCL LastCell Range UCL +2 Sigma +1 Sigma Average 1 0.90 1.02 0.95 0.89 0.83 X WELD DEPOSITION PER HOUR 0.76 0.70 0.64 0.9 0.07 2 0.85 1.02 1.05 0.95 0.89 0.83 0.76 0.70 0.64 0.85 0.05 0.23 0.18 0.13 0.07 3 0.85 1.02 0.95 UCL 0.89 0.83 0.76 0.70 0.64 0.85 0.00 0.23 0.18 0.13 1.02 0.07 1.00 4 0.70 1.02 0.95 0.89 0.83 0.76 0.70 0.64 0.7 0.15 0.23 0.18 0.13 0.07 5 0.85 1.02 0.95 0.95 0.89 0.83 0.76 0.70 0.64 0.85 0.15 0.23 0.18 0.13 0.07 6 0.80 1.02 0.95 0.89 0.83 0.76 0.70 0.64 0.8 0.05 0.23 0.18 0.13 0.07 WELD DEPOSITION (KG) 0.90 7 0.85 1.02 0.95 0.89 0.83 0.76 0.70 0.64 0.85 0.05 0.23 0.18 0.13 0.07 8 0.80 0.85 1.02 0.95 0.89 0.83 0.76 0.70 0.64 0.8 0.05 0.23 0.18 0.13 0.07 CL 0.83 1.02 0.80 0.95 0.89 0.83 0.76 0.70 0.64 0.8 0.233357 0.179381 0.125405 0.07 1.02 0.95 0.89 0.83 0.76 0.70 0.64 0.8 0.233357 0.179381 0.125405 0.07 0.75 1.02 0.95 0.89 0.83 0.76 0.70 0.64 0.8 0.233357 0.179381 0.125405 0.07 1.02 0.70 0.95 0.89 0.83 0.76 0.70 0.64 0.8 0.233357 0.179381 0.125405 0.07 1.02 0.95 0.89 0.83 0.76 0.70 0.64 0.8 0.233357 0.179381 0.125405 0.07 0.65 LCL 0.64 1.02 0.95 0.89 0.83 0.76 0.70 0.64 0.8 0.233357 0.179381 0.125405 0.07 0.60 1.02 0.95 0.89 0.83 0.76 0.70 0.64 0.8 0.233357 0.179381 0.125405 0.07 1.02 0.55 0.95 0.89 0.83 0.76 0.70 0.64 0.8 0.233357 0.179381 0.125405 0.07 1.02 1 0.95 0.89 2 0.83 3 0.76 0.70 4 0.64 0.8 5 0.233357 6 0.179381 7 0.125405 0.07 8 1.02 0.95 0.89 0.83 0.76 0.70 HOUR (IN SHIFT) 0.8 0.64 0.233357 0.179381 0.125405 0.07 1.02 0.95 0.89 0.83 0.76 0.70 0.64 0.8 0.233357 0.179381 0.125405 0.07 1.02 0.95 0.89 0.83 0.76 0.70 0.64 0.8 0.233357 0.179381 0.125405 0.07 mR WELD DEPOSITION PER HOUR
  • 19.
    STRATEGY • These controlcharts can then be used to identify & benchmark best performance. • Using the benchmarked performance of FIG.1, the individual control chart FIG.2 can now be analyzed to locate reasons for performance deviation. • Aside from time, factors such as current, arc distance, time to change the electrode, etc. can all be analyzed.
  • 20.
    STRATEGY • Once identified,the root causes of the bottle- necks in the process can now be targeted, using Pareto graphing, & Ishikawa (fish bone) diagrams. • The example below, shows types of defects/discontinuities noticed during a standard vessel fabrication campaign & the methodology of eliminating them.
  • 21.
  • 22.
    Materials Process/Methods Fillers purchased on cost basis Improper parameters To copy all basisMaterial Cleaniless? fishbone "objects" Trace elements in consumables? Wide WPS Use Cntl-Shift-A parameters Ambient Air Circulation Improper Weld Preparation? Why? Problem Statement Why? Weld Defects Cable Grounding? Training? Planning/Work Instructions? Contact Cleanliness? Why? House Keeping? Why? Preventive Maintenance? ? People Machine Ishikawa Fishbone Diagram s Cause Effect Analysis
  • 23.
    The Fish boneor Ishikawa diagram is a systematic way of generating and sorting hypotheses about possible causes of a problem., through CAUSE & ANALYSIS. The effect of Process Variables can be demonstrated through a problem statement. Following a protocol known as 5 Why’s, that is, asking “Why” 5 times for any problem occurrence; a foundation is laid for identifying the root causes of any problem. Once the root causes of problems are identified, an action plan can be put in place to solve the source of production disruption rather than just the symptoms.
  • 24.
    STRATEGY • Matrix diagramsare like check-sheets, or work instructions, similar to ISO 3834 protocols which provide the welder with a concise summary of what parameters will ensure not just adherence to code, but optimize performance. • It minimizes performance variation between welders; fool-proofs the process & prioritizes corrective actions. In effect, it standardizes output, making specifications easily achievable.
  • 25.
    Conclusion • Call toManagement. • Spending time on grinding spatter, chipping slag, grinding welds down to final size or reworking/repairing parts, is a resource depleting effort. It slows production rates, reduces operational efficiencies dramatically; & drains value from the project. • Not tracking performance on the shop floor is equivalent to not tracking your personal finances or instruments. It is a recipe for disaster especially in competitive international environments.
  • 26.
    Cost effective solutionsare readily available to remove Defects, Deviations & Delays from your process. You don’t have to spend huge amounts on consultants, expensive software or training &/or hiring statisticians to optimize your operations. You can leverage your existing QC personnel from their current function as statutory (code) requirement enforcers, which does not add value to the process. Instead of a regime of pass-fail, essentially pointing out a problem (non-conformance) after the fact; have them initiate a data collection & analysis drive. The root causes will be located & the process re-designed to eliminate the source of the defects or deviations.
  • 27.
    Conclusion • Call toQC/QA personnel. • Get out of the rut of constant conflict with production, issuing warnings, NCR’s , basically conducting a janitorial clean up every time a code violation occurs. • Take a leaf out of the project management groups’ operational protocols. Chart out an action plan; plan a schedule. Begin with just a small amount of data & control chart it. • Involve welders & supervisors in locating the root cause. You will generate a shop floor ally. • It is a statistical fact that over 95% of the problems can be attributed to the process, not to the individual. • The documented results & the joint effort solutions will result in a reduction in repair & schedule delay, something that will be noticed & appreciated. • Nothing shines like documented profit.
  • 28.
    Conclusion • RTS canprovide guidance & training through simple, uncomplicated collection & analysis of process data, using very cost effective & uncomplicated software (under $300) to expose the root cause. • Once the root cause or process deficiencies are eliminated; the Quality function will become a value addition & improve the bottom line. • Get a true understanding of the cost of welding, & use Lean & Six Sigma to generate corrective actions to become internationally competitive.
  • 29.
    Raya Technical Services •We provide process Optimization services through implementation of Lean & Six Sigma • http://www.rayatechnicalservices.com/lean_si x_sigma • http://rayatechnicalservices.com/submerged_ arc_welding_nozzles • http://rayatechnicalservices.com/rfid_process _optimization_through_traceability

Editor's Notes

  • #2 Process Optimization by implementation of Lean improves a company’s ability to lower operating costs & compete internationally. It targets the root cause of operational inefficiencies identifying and eliminating waste and in tandem with Six Sigma based statistical quality control protocols ensures the production of an error or defect free product.
  • #10 Master the economies of Speed: Producing Faster, Reducing Delay & Reducing Cycle time.