Downloaded 17 times

![PROCESS IMPROVEMENT CYCLE
29
17. Conclusion
Process improvement holds the key to quality improvement and eventually to improvement in
organizational performance, when applied to all business processes core as well as support. And the
key to process improvement lies these days with improved process planning, given that competence in
implementing a process plan is already in place. Process planning has to be target-oriented and, at the
same time, resource-based. It should take due advantage of relevant tools mostly quantitative and of
relevant information about processes to be improved from sources wherein such processes are carried
out.
During process execution, appropriate preventive actions including devices have to be introduced to
prevent the process failing to meet plan requirements and, that way, to meet requirements of internal
and/or external customers.
Such requirements have often to be found out from the voice of the customer and not just visible or
directly available. Improved process monitoring to detect deviations from an improved process plan as
soon after such a deviation takes place also plays an important role.
Improvement in process design contributes the most to improved process quality. And this improvement
preceded process implementation, followed by process monitoring and control, and process changes for
the better. Improving process design can take advantage of many inputs and also various techniques.
REFERENCES
Athuraliya, A. (2018). The Easy Guide to Process Improvement Techniques. Cinergix. Retrieved from
https://creately.com/blog/diagrams/process-improvement-methodologies/
BD. (2020). Quality. BusinessDictionary.com. Retrieved from http://www.businessdictionary.com/
Encyclopedia of Management. (2020). Poka-yoke. Retrieved from
https://www.referenceforbusiness.com/management/Or-Pr/Poka-Yoke.html#ixzz6I5x8EGu3
Hoyle, D. (2007). Quality Management Essentials. Amsterdam: B-H, Elsevier.
MSG. (2020). Total Quality Management. Management Study Guide. Retrieved from
https://www.managementstudyguide.com/what-is-kaizen.htm
Mukherjee, S. P. (2019). Quality: Domains and Dimensions. Gateway East, Singapore: Springer.
Q-1. (2020). Failure Mode and Effects Analysis (FMEA). Quality-One International. Retrieved from
https://quality-one.com/fmea/
Ross, J. E., & Perry, S. (1999). Total quality management: Text, cases, and readings. CRC Press.
Tallyfy. (2020). Process Improvement. Retrieved from https://tallyfy.com/continuous-process-
improvement/
Vijayakumar, C. (2013, May 08). Total Quality Management and Continuous Improvement. Ramco
[blog]. Retrieved from https://blogs.ramco.com/total-quality-management-continuous-
improvement](https://image.slidesharecdn.com/5575-tqm-report-processimprovementcycle-upload-201205161519/85/PROCESS-IMPROVEMENT-CYCLE-31-320.jpg)

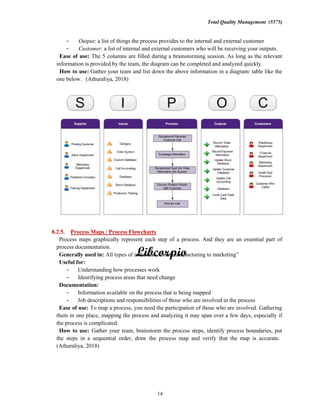
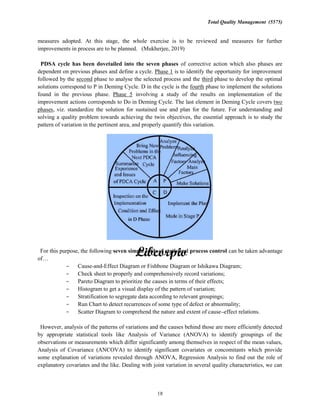
The document discusses various process improvement techniques. It begins by defining key terms like quality, total quality management, processes, and process models. It then discusses assessing process quality and a model for process analysis. The main part of the document outlines different process improvement techniques, including popular Lean tools like 5S, value stream mapping and Kaizen as well as Six Sigma tools like DMAIC and DMADV. It emphasizes that these tools can help identify inefficiencies, eliminate waste, reduce costs and lead times, and improve process and product quality.