Pro disc l replacement vs circumferential arthrodesis of spine
•Download as PPTX, PDF•
5 likes•1,359 views

Pro disc l replacement vs circumferential arthrodesis of spine

Recommended
Recommended
More Related Content
What's hot
What's hot (20)
Similar to Pro disc l replacement vs circumferential arthrodesis of spine
Similar to Pro disc l replacement vs circumferential arthrodesis of spine (20)
More from Queen Mary Hospital
More from Queen Mary Hospital (10)
Recently uploaded
Recently uploaded (20)
Pro disc l replacement vs circumferential arthrodesis of spine
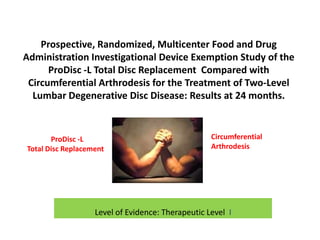
- 1. Prospective, Randomized, Multicenter Food and Drug Administration Investigational Device Exemption Study of the ProDisc -L Total Disc Replacement Compared with Circumferential Arthrodesis for the Treatment of Two-Level Lumbar Degenerative Disc Disease: Results at 24 months. ProDisc -L Total Disc Replacement Circumferential Arthrodesis Level of Evidence: Therapeutic Level I
- 2. Performed by : • Rick Delamarter, MD The Spine Institute at Saint John's Health Center, 1301 20th Street, Suite 400, Santa Monica, CA 90404 • Jack E. Zigler, MD Texas Back Institute/Texas Health Research Institute, 6020 West Parker Road, Suite 200, Plano, TX 75093 • Richard A. Balderston, MD Pennsylvania Hospital, 800 Spruce Street, 1st Floor, 3B, Philadelphia, PA 19107 • Frank P. Cammisa, MD Hospital for Special Surgery, 523 East 72nd Street, New York, NY 10021 • Jeffrey A. Goldstein, MD and Jeffrey M. Spivak, MD Hospital for Joint Diseases Spine Center, 301 East 17th Street, New York, NY 10038
- 3. Presented in : • The Journal of Bone & Joint Surgery. 2011; 93:705715 doi:10.2106/JBJS.I.00680
- 4. Degenerative Disc Disorder - Low Back Ache A major public health problem The leading cause of disability for people < 45 2nd leading cause for physician visits 3rd most common cause for surgical procedures 5th most common reason for hospitalizations Lifetime prevalence: 49%–80% Pai et al. 2004, Orthop Clin N Am
- 5. AIM Arthrodesis / Spinal fusion had become a standard surgical procedure , a more predictable and reproducible. symptomatic degenerative disease, degenerative spondylolisthesis, degenerative lumbar scoliosis, postdiscectomy-syndromes or segmental instability adjacent to a previous fusion. Arthrodesis alters the biomechanics of the spine , loss of motion and overall shift in the sagittal alingment Induces degenerative changes in the nearby spinal motion segments.
- 6. Total Disc Replacement • Disc removal , assuming it to be the main source of pain • Restoration of disc height (increase the foraminal diameter, relieve loads across the facet joints and improve the pattern of load bearing between vertebrae) • Segmental stability • Preservation or improvement of segmental motion • Lordosis curve (rebalance the spine - preserves the motion, protect adjacent segment from accelerated degeneration.) • Limit Disability & early return to work. Total lumbar disc replacement, H. M. Mayer, MD, PhD, Orthopaedic Surgeon, Neurosurgeon, Associate Professor, 2005, JBJS
- 7. TDA > Arthodesis • • • • • • • • • Guyer RD et al 2009 Delamarter R et al 2008 * Cunningham BW et al 2008’ Siepe CJ et al 2007 Zigler J et al 2007 * Panjabi et al 2007 * Panjabi et al 2007’ Blumenthal S et al 2005* Bertagnoli R et al 2005 * • The purpose of this study is to determine clinical results of Pro Disc L Total Disc Replacement as compared with Circumferential Spinal fusion for the treatment of degenerative disease at two contagious vertebral levels from L3 to S1.
- 8. MATERIAL & METHOD • From January 2002 to June 2004, a total of 256 patients were randomized by 38 spine surgeons at 16 sites across the United States. • Blocked randomization was performed in a controlled design • with use of a 2:1 ratio of total disc arthroplasty to circumferential arthrodesis • Overall, 237 patients (165 in the total disc replacement group & 72 in the arthrodesis group) were treated. • At the end of the study of 24 months a total of 203 patients (including 143 in the total disc replacement group and 60 in the arthrodesis group were available.
- 9. FLOW CHART of STUDY PATTERN
- 10. STUDY DESIGN Inclusion criteria • With degenrative disc disease at two levels from L3 to S1. • Patients who had minimum of 6 months of unsuccessful nonoperative treatment • +/- Leg pain • With a minimum Oswestry Disability Index ODI score of >_ 40 Exclusion criteria • spondylolisthesis >grade I, • degenerative disc disease at more than two levels, • previous arthrodesis • inability to comply with the study protocol.
- 11. Degenerative Disc Disease includes • Lumbar spine instability, • loss of intervertebral disc height, • scarring of the annulus fibrosus, • herniated nucleus pulposus, • vaccum phenomenon of disc INVESTIGATION MODES : • • • • • Flexion-extension Radiographs, Computed Tomography (CT), Magnetic Resonance Imaging (MRI), Discography, Myelography
- 12. STUDY PATTERN • Study approval was obtained from each site's institutional review board prior to the start of the study. Patient randomization was performed with use of a 2:1 ratio of TDR to circumferential arthrodesis. • Patients in the investigational group were managed with TDR at both levels. • The control group was managed with a two-level anterior lumbar interbody arthrodesis with use of a commercially available femoral ring allograft and posterolateral arthrodesis with autogenous iliac crest bone graft in combination with pedicle screw instrumentation.
- 14. ProDisc-L Device Description • a semi-constrained design based on the ball-and-socket principle • consists of 2 End Plates manufactured from cobaltchromium-molybdenum (CoCrMo) alloy and a convex ultra-high molecular weight polyethylene (UHMWPE) insert. • Fixation is provided by a central keel and titanium plasma spray coating on each end plate. • Bone ingrowth
- 15. Pro Disc L
- 18. Pro Disc L
- 19. Pro Disc L allowing movement during flexion and extension
- 20. SURGICAL METHOD The surgical technique of performing the two-level lumbar arthroplasty is similar to that of a single-level lumbar arthroplasty • The entire disc is removed from an anterior approach . • The disc space is distracted. • The TDR device is inserted. Lumbar Total Disc Replacement, Surgical Techniques ,Patrick Tropiano, MD; Russel C. Huang, MD; Federico P. Girardi, MD; Frank P. CammisaJr., MD; Thierry Marnay, MD , March 01, 2006, JBJS (Am)
- 21. Lumbar Total Disc Replacement, Surgical Techniques ,Patrick Tropiano, MD; Russel C. Huang, MD; Federico P. Girardi, MD; Frank P. CammisaJr., MD; Thierry Marnay, MD , March 01, 2006, JBJS (Am)
- 22. Lumbar Total Disc Replacement, Surgical Techniques ,Patrick Tropiano, MD; Russel C. Huang, MD; Federico P. Girardi, MD; Frank P. CammisaJr., MD; Thierry Marnay, MD , March 01, 2006, JBJS (Am)
- 23. PRE OPERATIVE DEMOGRAPHIC DATA • *Continuous variables were analyzed with the Wilcoxon rank-sum test, and categorical variables were analyzed with the Fisher exact test. †The values are given as the mean and the standard deviation. ‡Data were unavailable for one patient in the total disc replacement group. §Patients may be included in more than one category. #Previous conservative treatment other than medication.
- 24. Demographic characteristics Total Disc Replacement (N = 165) Arthrodesis (N= 72) Sex No. of patients P Value * 0.6701 Male 95 39 Female 70 33 Age (yrs) 41.8+_ 7.73 41.8 +- 7.81 0.9745 Body mass Index (kg/m2) 27+-4.52 27.1+_4.05 0.8723 Smoking status 0.1373 Never 86 29 Former 31 21 Current 47 22
- 25. Demographic characteristics Total Disc Replacement (N = 165) Arthrodesis (N= 72) Previous surgical treatment P Value * 0.8864 None 96 43 Any 69 29 Discectomy 32 13 Intradiscal electrothermic theraphy 17 7 Laminectomy 31 9 Laminotomy 4 2 other 12 8
- 26. Demographic characteristics Total Disc Replacement (N = 165) Arthrodesis (N= 72) Previous conservative treatment P Value* 0.9436 injection 127 52 Physical therapy 135 61 Corset/Brace 68 28 chiropractic 60 28 other 35 12 Duration of pain in the Back / leg 0.6145 < 6 months 1 0 6 months to 1 year 16 4 > 1 year 148 68
- 27. Statistical methods • For the purpose of FDA evaluation, a composite, binary end point consisting of ten criteria was estabilished for each treatment group. • At the end of 24 months , the pateint had to meet all the 10 criteria for to be labelled as a successive or statistical failure
- 28. Components of Composite End Point at 24 Months 1. >_ 15% improvement in ODI compared with baseline 2. Improvement in SF-36 PCS compared with baseline 3. Neurological status improved or maintained from baseline 4. No secondary surgical procedures to remove or modify the total disc replacement implant or arthrodesis implant/site Radiographic success 5. No subsidence >3 mm 6. No migration >3 mm 7. No radiolucency/loosening 8. No loss of disc height >3 mm Motion status 9. Total disc replacement: range of motion improved or maintained from baseline 10.Arthrodesis: no motion (<10° angulation, total for two levels combined) on flexion and extension radiographs *ODI = Oswestry Disability Index; SF-36 PCS = Short Form-36 physical component score.
- 30. Intraoperative data showed that the TDR group had •significantly decreased operative times (p < 0.0001), •estimated blood loss (p = 0.0013), and •length of hospital stay (p < 0.0001) Intraoperative Data Total Disc Replacement (N = 165) Arthrodesis (N= 72) Implant level P Value* 1.0000 L3 – L5 14 8 L4- L5 151 64 Operative time in min 160.2 +_ 73.30 272.8+_ 81.68 < 0.0001 Estimated blood loss in ml 398.1+_451.48 569.3 +- 466.63 0.0013 Length of hospital stay in days 3.8+_ 1.53 5+_1.93 <0.0001 *Continuous variables were analyzed with the Wilcoxon rank-sum test, and categorical variables were analyzed with the Fisher exact test. †The values are given as the mean and the standard deviation. ‡Data were unavailable for three patients in the total disc replacement group.
- 31. Clinical Outcome Measurements • patient was clinically evaluated preoperatively, at 6 weeks postoperatively, and at 3,6,12,18,24 months postoperatively. • Every visit included physical and neurological examinations, radiographic evaluation, determination of medication use, work and recreation status, and completion of self-assessment questionnaires (including the ODI, Short Form of the Medical Outcomes Study [SF-36], and visual analog scales [VAS] for pain and satisfaction. • Physical and neurological examinations were performed to assess nerve root tension, reflexes, muscle strength, and sensory deficits. Radiographic evaluation consisted of neutral anteroposterior and lateral views, flexionextension views, and lateral bending views.
- 32. Clinical Outcomes: Primary • At twenty-four months, eighty-seven (58.8%) of 148 patients in the total disc replacement group and thirty-two (47.8%) of sixty-seven patients in the arthrodesis group met all ten criteria and were considered a study succes • non-inferiority was demonstrated between the two groups with use of a Blackwelder hypothesis with ? = 0.125 (p = 0.0008). • The difference between the two treatments was not significant (p = 0.0874).
- 33. Oswestry Disability Index (ODI) • The ODI low back pain disability questionnaire is a validated method of assessing a patient's level of pain and functional disability. • Baseline preoperative ODI values were similar for both treatment groups (64.7 points for the TDR group, compared with 64.8 points for the arthrodesis group) • In both groups, patients showed significant improvement in ODI scores from baseline at all follow-up periods (p < 0.0001). • The total disc replacement group demonstrated significantly greater improvement than the arthrodesis group did at all follow-up time points (p = 0.0474). • At twenty-four months, the mean improvement from baseline was 52.4% in the total disc replacement group compared with 40.9% in the arthrodesis group (p = 0.0282).
- 34. Oswestry Disability Index Scores Oswestry Disability Index Score*(points) Percentage Change from Baseline*(%) Time Point Total Disc Replacement Arthrodesis Total Disc Replacement Arthrodesis P Value* Baseline 64.7 ± 11.4 64.8 ± 9.5 - - - 6 wks 43.8 ± 18.2 50.8 ± 17.8 30.8 ± 28.9 22.2 ± 27.2 0.0228 3 months 38.1 ± 20.7 44.4 ± 15.7 40.5 ± 32.3 30.9 ± 24.6 0.0445 6 months 35.1 ± 21.9 43.9 ± 17.1 45.3 ± 34.6 32.3 ± 26.7 0.0068 12 months 33.7 ± 23.9 41.1 ± 23.0 48.0 ± 36.4 37.9 ± 34.7 0.0474 18 months 32.8 ± 24.7 42.3 ± 22.5 49.3 ± 37.9 36.1 ± 33.8 0.0215 24 months 30.3 ± 24.3 38.7 ± 24.1 52.4 ± 38.1 40.9 ± 36.0 0.0282 *The values are given as the mean and the standard deviation. †The Wilcoxon rank-sum test was used to compare total disc replacement and arthrodesis with regard to the percentage change from baseline.
- 35. OSWESTRY DISABILITY INDEX - ODI • • • • • • • • • • Pain intensity Personal care Lifting Walking Sitting Standing Sleeping Sex life Social life Travelling • 0 to 20 % Minimal disability • 21 to 40 % Moderate disability • 41 to 60 % Severe disability • 61 to 80% crippled • 81 to 100 % Bed bound
- 36. SF-36 Physical Component Score • Baseline preoperative values for the SF-36 physical component score (PCS) were similar for both treatment groups (29.5 points for the total disc replacement group, compared with 30.1 points for the arthrodesis group) • Both treatment groups showed significant improvement at all follow-up time-points in comparison with baseline (p < 0.0279). • The total disc replacement group showed significant improvement compared with the arthrodesis group at six weeks and at three, six, and twenty-four months (p = 0.0379, p = 0.0044, p = 0.0068, and p = 0.0141, respectively). • At twenty-four months, the score for the total disc replacement group improved to a mean of 43.9 points and the score for the arthrodesis group improved to a mean of 39.2 points.
- 37. Short Form-36 Physical Component Scores Short Form-36 Physical Component Score*(points) Percentage Change from Baseline*(%) Time Point Total Disc Arthrodesis Replacement Total Disc Arthrodesis Replacement P Value† Baseline 29.5 ± 5.4 30.1 ± 6.7 — — — 6 weeks 34.8 ± 7.7 31.9 ± 6.9 21.4 ± 33.4 12.2 ± 32.2 0.0379 3 months 38.7 ± 9.4 34.7 ± 7.3 34.9 ± 38.2 20.7 ± 37.7 0.0044 6 months 41.2 ± 10.3 37.0 ± 9.1 43.8 ± 45.6 30.1 ± 48.3 0.0068 12 months 42.4 ± 11.2 39.3 ± 9.9 48.8 ± 51.6 38.3 ± 47.0 0.1108 18 months 42.7 ± 11.5 38.1 ± 10.7 51.4 ± 55.6 37.7 ± 52.0 0.0899 24 months 43.9 ± 11.9 39.2 ± 11.2 54.2 ± 54.6 36.2 ± 44.9 0.0141 *The values are given as the mean and the standard deviation. †The Wilcoxon rank-sum test was used to compare the total disc replacement and arthrodesis groups with regard to the percentage change from baseline.
- 38. Neurological Success • Neurological success was defined as the maintenance or improvement of patient responses to all neurological criteria, including motor status, sensory status, reflexes, and a straight leg raise test • At six months, the percentage of patients with neurological success was significantly higher in the TDR group (87.3%; 131 of 150) than in the arthrodesis group (71.6%; forty-eight of sixty-seven) (p = 0.0068). • At twenty-four months, the percentage remained higher in the total disc replacement group (89.2%; 132 of 148) than in the arthrodesis group (80.6%, fifty of sixty-two), but this small difference was not significant. • The Fisher exact test (two-sided) was used to compare the total disc replacement and arthrodesis groups.
- 39. 6 weeks Overall neurological success Total disc 82.1% replacement 24 months 3 Months 6 Months 12Months 18Months 80.9% 87.3% 86.2% 86.4% 89.2% Arthrodesis 83.3% 81.2% 71.6% 76.2% 77.6% 80.6% P value* 1.0000 1.0000 0.0068 0.1037 0.1730 0.1192 Total disc 94.9% replacement 97.5% 96.0% 97.8% 98.6% 98.0% Arthrodesis 95.5% 97.1% 97.0% 96.9% 98.0% 100.0% P value* 1.0000 1.0000 1.0000 0.6514 1.0000 0.5567 Total disc 88.5% replacement 88.5% 95.3% 94.2% 93.6% 93.9% Arthrodesis 91.0% 88.4% 86.6% 85.9% 88.0% 91.9% P value* 0.6446 1.0000 0.0446 0.0581 0.2277 0.5601 Motor status Sensory
- 40. Secondary Surgical Procedures • Overall, four (2.4%) of 165 patients in the total disc replacement group and six (8.3%) of seventy-two patients in the arthrodesis group required a secondary surgical procedure at the index level or levels. • This fourfold difference in the rate of secondary surgery for the arthrodesis group was significant (p = 0.0465). • The average number of days from the index procedure to secondary surgery was 567.7 (range, 480 to 736) in the total disc replacement group and 255.5 (range, twenty-one to 560) in the arthrodesis group.
- 41. SECONDARY SURGICAL PROCEDURES • One patient (0.6%) in the total disc replacement group had anterior migration of the superior arthroplasty implant and underwent revision arthrodesis at that level. • The remaining 3 patients (1.8%) in the TDR group underwent a secondary surgical procedure (foraminotomy and/or facetectomy) for posterior decompression; 2 these patients underwent a one-level decompression, and one patient underwent a decompression at both levels. • Of the 6 patients who underwent a secondary surgical procedure in the arthrodesis group, 5 had spinal implant removal because of ongoing pain and one had implant removal, decompression (bilateral medial facetectomy and hemilaminectomy), and revision of the bone fusion sites because of a pseudarthrosis at L5-S1.
- 42. Radiographic Outcomes • The radiographic outcomes that were assessed included • device migration ( 1 anterior migration of the superior arthroplasty implant) • device subsidence(3 patients in TDR of > 3 mm-clinically insignificant), • disc height, • radiolucency around the implant, • Fusion status in the arthrodesis group • Flexion-Extension range of motion in the TDR group averaged 7.8° ± 5.3° at the level of the superior disc 6.2° ± 4.1° at the level of the inferior disc
- 43. Lateral views of Lumbar spineof a 38 yr old treated with ProDisc L Total Disc Replacement at L3 -4 and L4-5 level made at end of 24 month followup . X Rays are taken in Neutral , Flexion and in Extension of lumbar spine.
- 44. Clinical Outcomes: Secondary Visual Analog Scale for Pain • For both groups, the VAS pain assessment showed significant improvement from preoperative levels at all time points postoperatively (p < 0.0001) • At twenty-four months, the mean VAS score demonstrated a 43.3-mm mean reduction from baseline for the total disc replacement group compared with a 36.7-mm mean reduction for the arthrodesis group. • A significant difference between the treatment groups was observed only at the eighteen-month follow-up (p = 0.0248).
- 45. Visual Analog Pain Scores Visual Analog Pain Score* Change from Baseline* Time Point Total Disc Arthrodesis Replacement Total Disc Arthrodesis Replacement P Value† Baseline 75.7 ± 16.0 74.7 ± 13.6 — — — 6 weeks 41.5 ± 25.4 46.5 ± 24.9 34.5 ± 28.6 28.7 ± 28.4 0.1437 3 months 38.9 ± 27.6 42.1 ± 23.4 36.7 ± 28.5 32.3 ± 26.0 0.3170 6 months 37.9 ± 27.5 44.3 ± 26.0 38.1 ± 29.6 30.4 ± 28.6 0.0715 12 months 35.6 ± 28.5 40.3 ± 27.9 40.4 ± 29.4 34.9 ± 28.5 0.2527 18 months 35.2 ± 29.8 45.6 ± 30.3 40.3 ± 31.9 28.7 ± 31.0 0.0248 24 months 31.9 ± 30.5 38.4 ± 29.8 43.3 ± 33.3 36.7 ± 30.3 0.1177 *The values are given as the mean and the standard deviation. †The Wilcoxon rank-sum test was used to compare the total disc replacement and arthrodesis groups.
- 46. Visual Analog Scale for Patient Satisfaction and Willingness to Undergo Surgery Again • At twenty-four months, the mean score was 77.7 mm for the total disc replacement group compared with 68.9 mm for the arthrodesis group (p = 0.0126). • Patients were asked whether they would have the same surgical treatment again. • At 6 weeks through eighteen months, patients responded "yes" at a significantly higher rate in the total disc replacement group than in the arthrodesis group (p < 0.0384). • At 24 months, the percentage of patients who responded "yes" was 78.2% (111 of 142) in the total disc replacement group compared with 62.1% (thirty-six of fifty-eight) in the arthrodesis group (p = 0.0546).
- 47. Visual Analog Scores for Satisfaction Time Point Total Disc Replacement Arthrodesis P Value† 6 weeks 78.93 ± 21.80 72.44 ± 25.03 0.0731 3 months 78.17 ± 23.46 70.87 ± 25.39 0.0056 6 months 77.67 ± 23.02 67.81 ± 24.87 0.0015 12 months 76.53 ± 26.45 67.76 ± 31.01 0.0244 18 months 75.40 ± 28.06 65.49 ± 30.76 0.0375 24 months 77.70 ± 27.95 68.89 ± 30.50 0.0126 *The values are given as the mean and the standard deviation. †The Wilcoxon rank-sum test was used to compare the total disc replacement and arthrodesis groups.
- 48. Narcotic Use • Preoperatively, 69.1% (114) of 165 patients in the total disc replacement group and 63.9% (forty-six) of seventy-two patients in the arthrodesis group reported using narcotics. • At twenty-four months, there was a significant decrease, favoring the total disc replacement group, in terms of the percentage of patients using narcotics (p = 0.0020).
- 49. Line graph showing the percentage of patients using narcotics for each surgical treatment over time. (TDR = Total Disc Replacement)
- 50. Work and Recreation Status • Preoperatively, there was no significant difference between the total disc replacement group (79.4%; 131 of 165) and the arthrodesis group (83.3%; sixty of seventy-two) in terms of the employment rate (p = 0.5928). Similarly, at twenty-four months, there was no significant difference between the total disc replacement group (80.4%; 115 of 143) and the arthrodesis group (86.0%; forty-nine of fifty-seven) in terms of the employment rate (p = 0.4193). • Preoperatively, there was no significant difference between the total disc replacement group (36.4%; sixty of 165) and the arthrodesis group (43.7%; thirty-one of seventy-one) in terms of the percentage of patients participating in recreational activities (p = 0.3099). The percentage of patients participating in recreational activities had increased in both groups at twenty-four months, with no significant difference between the total disc replacement group (84.6%; 121 of 143) and the arthrodesis group (79.7%; forty-seven of fiftynine) (p = 0.4121).
- 51. Complications • Major surgery-related complications included one dural tear in the total disc replacement group (0.6%; 1/165) and 3 dural tears in the arthrodesis group (4.2%; 3/72). • Blood loss of >1500 mL occurred in 2/165 (1.2%) of patients in the TDR group and 2/72(2.8%) of patients in the arthrodesis group. • One of the two patients in the total disc replacement group sustained an iliac artery tear • One patient in the total disc replacement group and the 2 patients in the arthrodesis group had excessive Oozing from the decompression, decorticated bone, and graft sites. • Postoperatively DVT was reported in 2/165 (1.2%) .of patients in the TDR group and 2/72 (2.8%) of in the arthrodesis group
- 52. RESULTS • At twenty-four months, 58.8% (87/ 148 )patients in the TDR group were classified as a statistical success, compared with 47.8% (32/67)patients in the arthrodesis group; non-inferiority was demonstrated. • The mean Oswestry Disability Index in both groups significantly improved from baseline (p < 0.0001); the mean percentage improvement for the total disc replacement group was significantly better than that for the arthrodesis group (p = 0.0282). • An established clinical criterion for success, a =15-point improvement in the Oswestry Disability Index from baseline, occurred in 73.2% (109/149 ) patients in the total disc replacement group and 59.7% (37/62)patients in the arthrodesis group.
- 53. RESULTS • The SF-36 physical component scores were significantly better for the total disc replacement group as compared with the arthrodesis group (p = 0.0141 at twenty-four months). • VAS scores for satisfaction significantly favored total disc replacement from 3 to 24 months. At twenty-four months, 78.2% (111/142) patients in the total disc replacement group and 62.1% (36/58) patients in the arthrodesis group responded "yes" when asked if they would have the same surgery again. • Lumbar spine range of motion on radiographs averaged 7.8° at the superior disc and 6.2° at the inferior disc in patients with total disc replacement. Auerbach JD et al 2007, 2009. • Reduction in narcotics usage significantly favored the total disc replacement group at twenty-four months after surgery (p = 0.0020).
- 54. CONCLUSION • Despite the relatively short duration of follow-up and design limitations, the present study suggests that two-level lumbar disc arthroplasty is an alternative to and offers clinical advantages in terms of pain relief and functional recovery in comparison with arthrodesis. • Longer-term follow-up is needed to determine the risks for implant wear and/or degenerative segment changes.
- 55. SB Charité III (Metal – poly - metal) • SB Charite III • Pro Disc L • Maverick (Metal on Metal) • Flexicore • Mobidisc
- 57. Ideal properties of an Implant • Biocompatible (endure in vivo for up to 40 yrs) • Biomechanical properties should allow for a nearnormal range of movement and function. • The design should facilitate safe implantation, preferably through a modest incision • The implant must not preclude modern imaging techniques for periodic monitoring and regard must be given to the possible need for revision or salvage procedures. Total lumbar disc replacement, H. M. Mayer, MD, PhD, Orthopaedic Surgeon, Neurosurgeon, Associate Professor, 2005, JBJS
- 58. HOME CARRYING MESSAGE • Total Disc Replacement proves to an ideal choice of surgical procedure for the treatment of DDD. • The promise of Disc tissue regeneration via Gene therapy , Tissue engineering is on the horizon.
- 59. THANKS
- 60. …….. Known is a drop…. …………………..unknown is an ocean……….. Dr. Kalaivanan Kanniyan Senior Resident– Orthopaedics UCMS, GTB Hospital, Delhi,India.