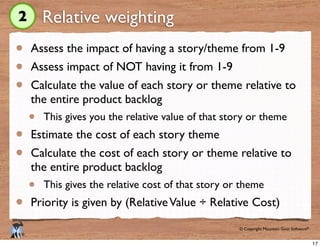
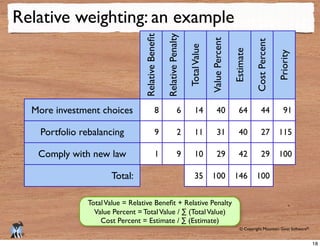
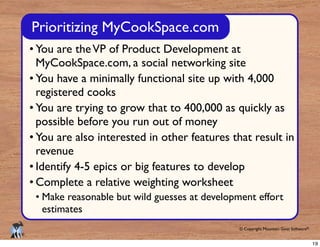
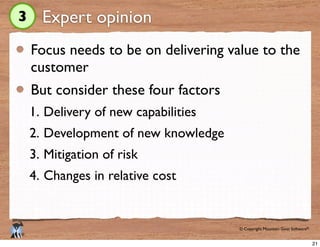
Download as PDF, PPTX

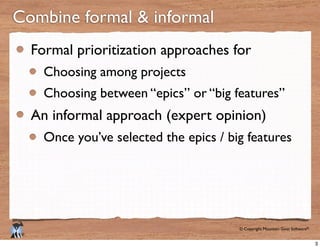
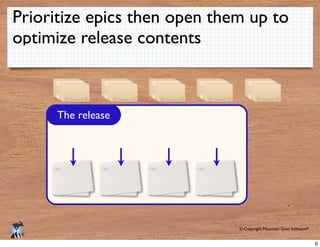
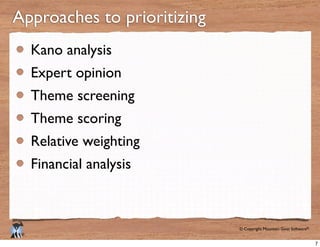

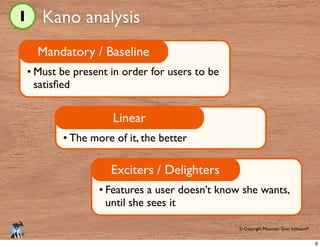
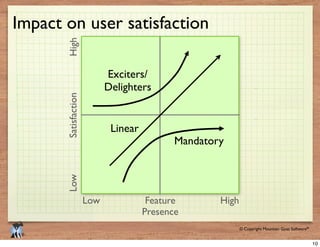
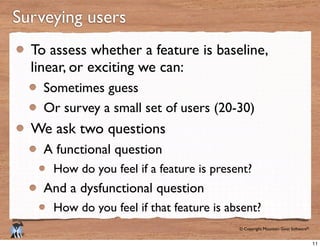


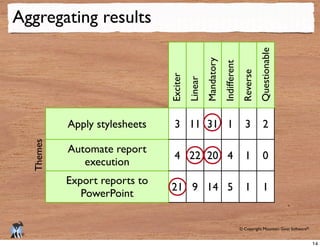


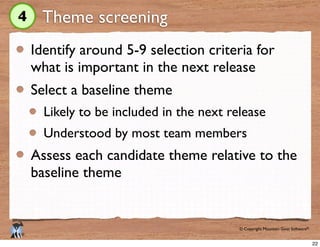
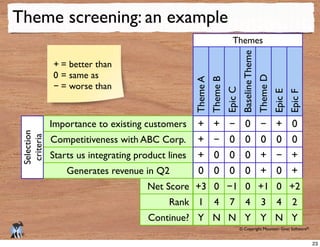
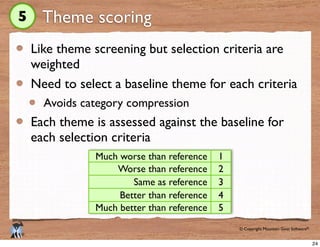
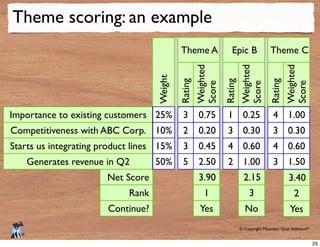


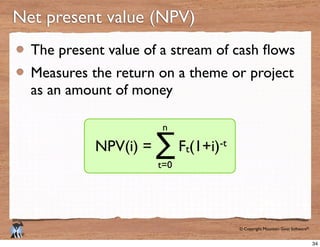
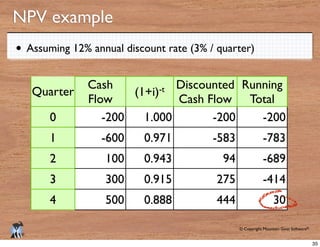
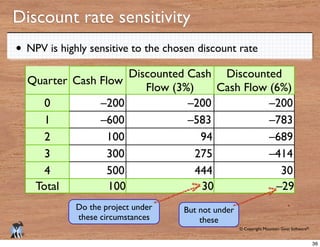
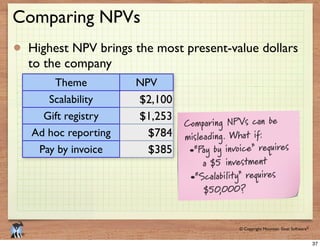
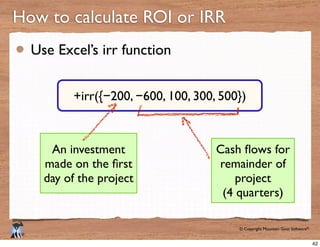
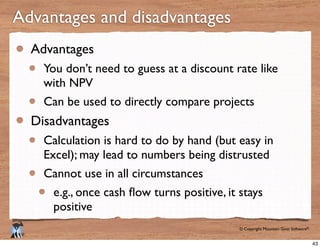

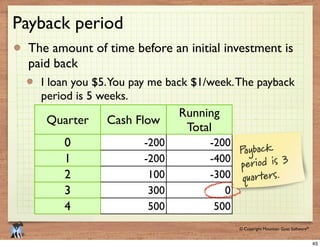
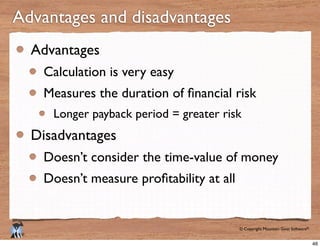
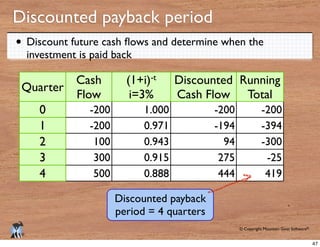
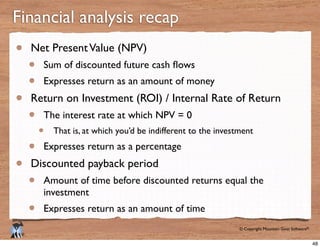
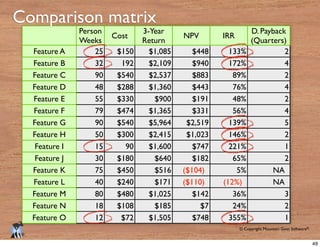


The document discusses various techniques for prioritizing product backlogs, including combining formal and informal approaches, prioritizing epics before optimizing releases, and using financial methods like net present value, internal rate of return, and payback period to evaluate the value and risk of different features. It also covers non-financial techniques like Kano analysis, expert opinion, theme screening, theme scoring, and relative weighting to help product owners determine what features to focus on developing. Worked examples are provided to illustrate how to apply these prioritization methods.