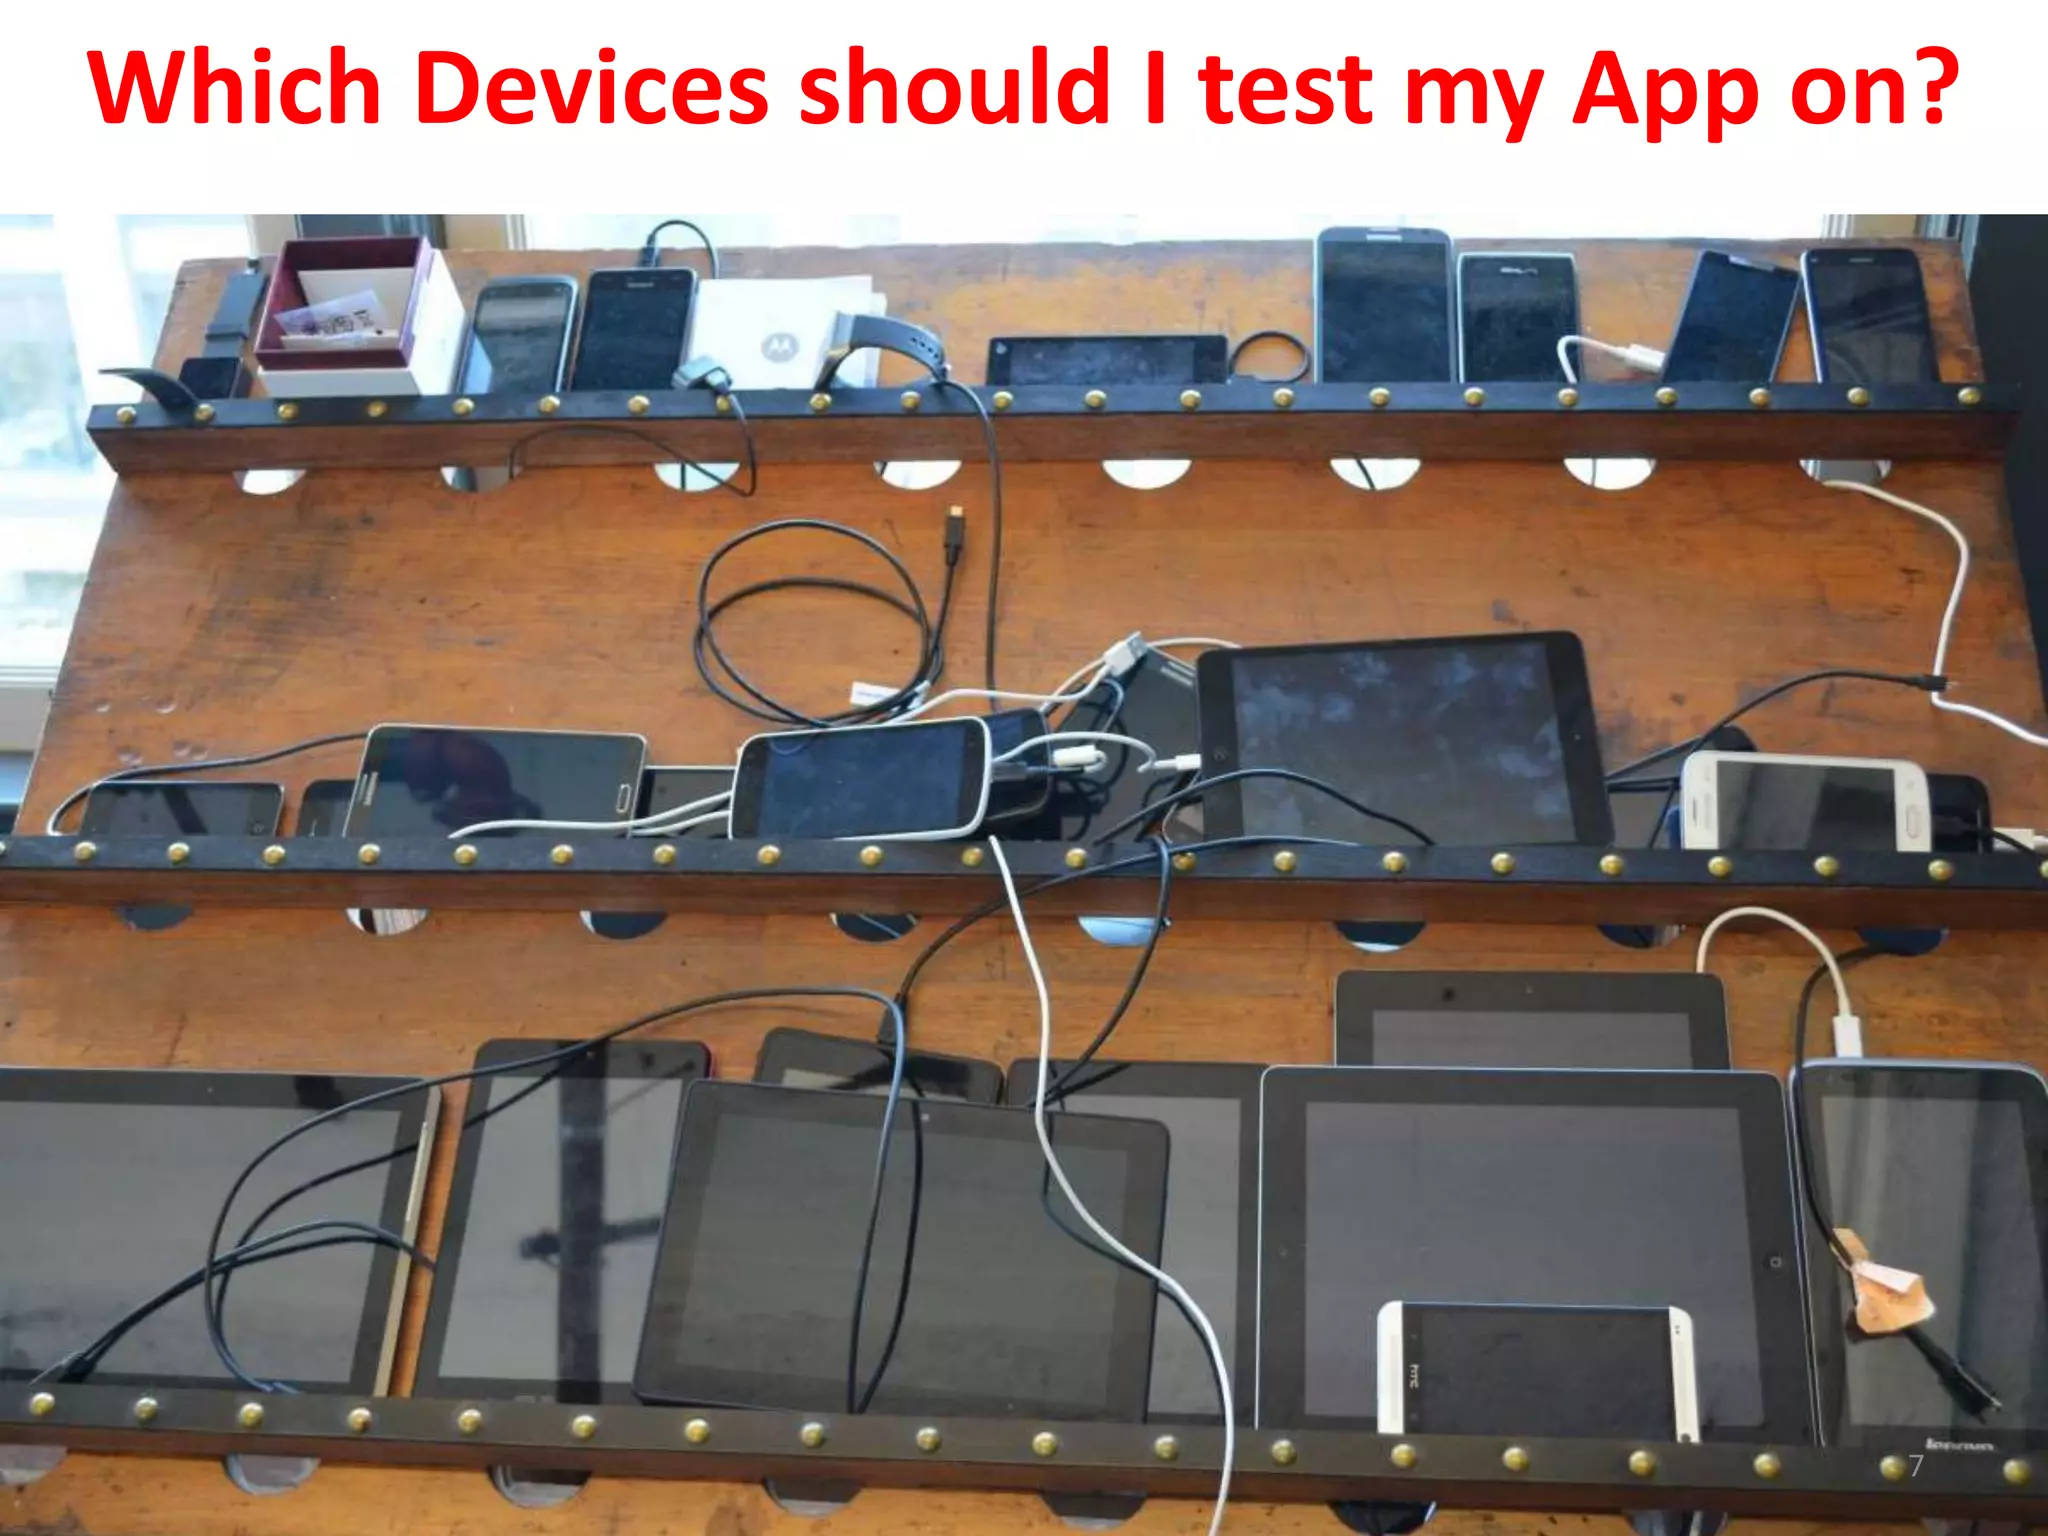
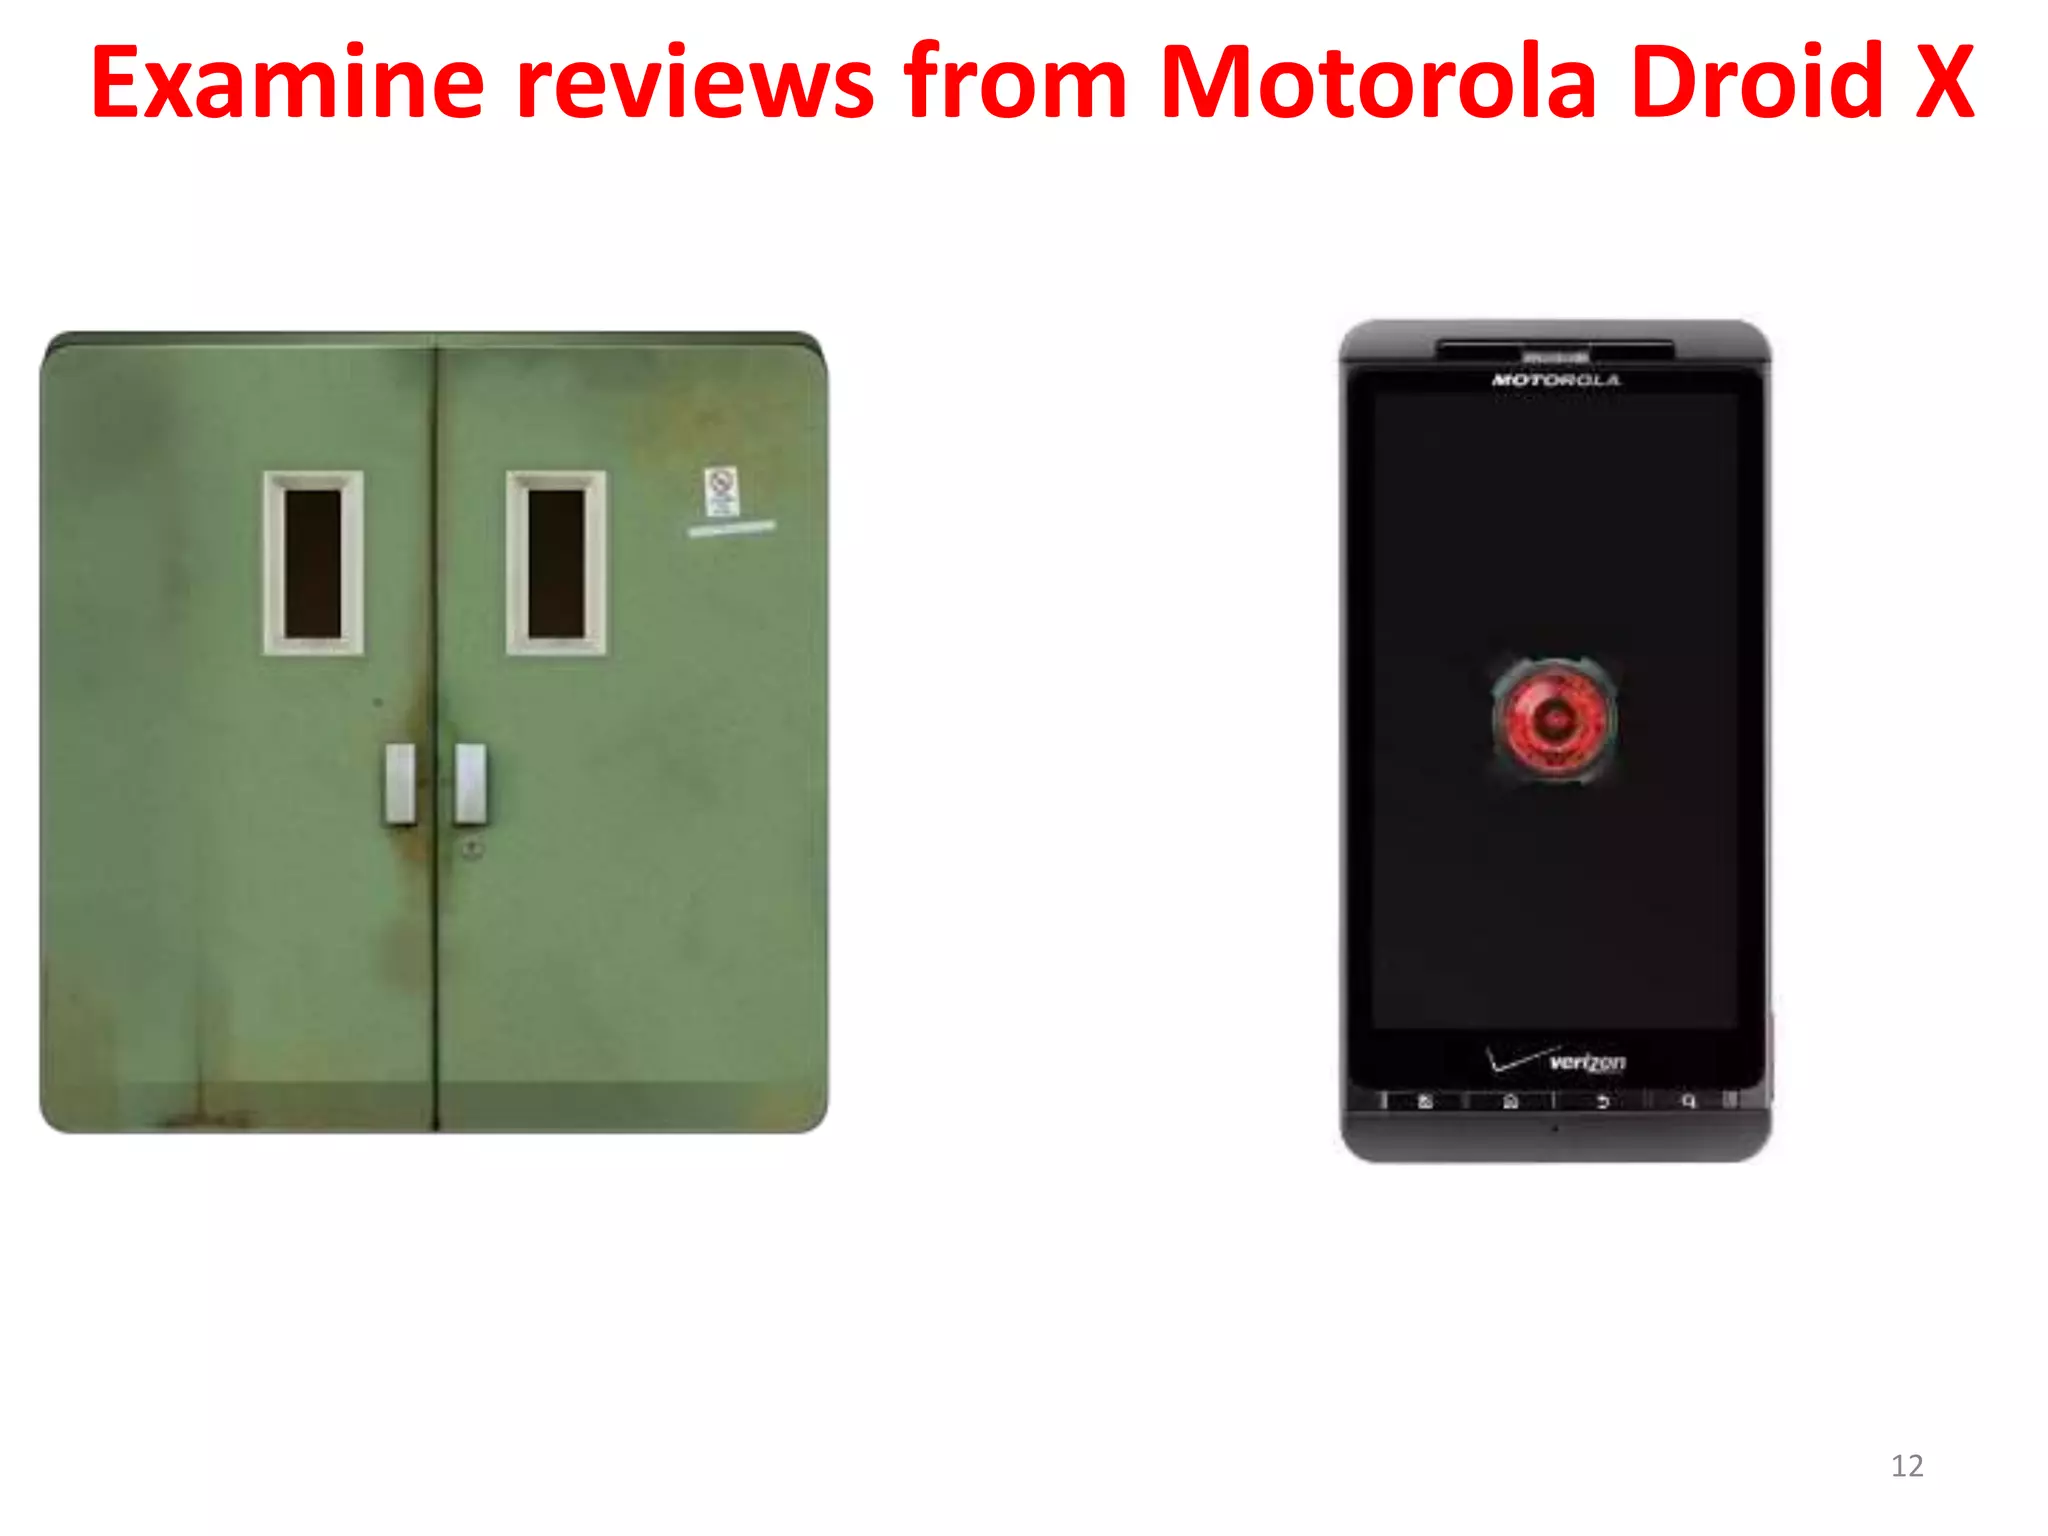
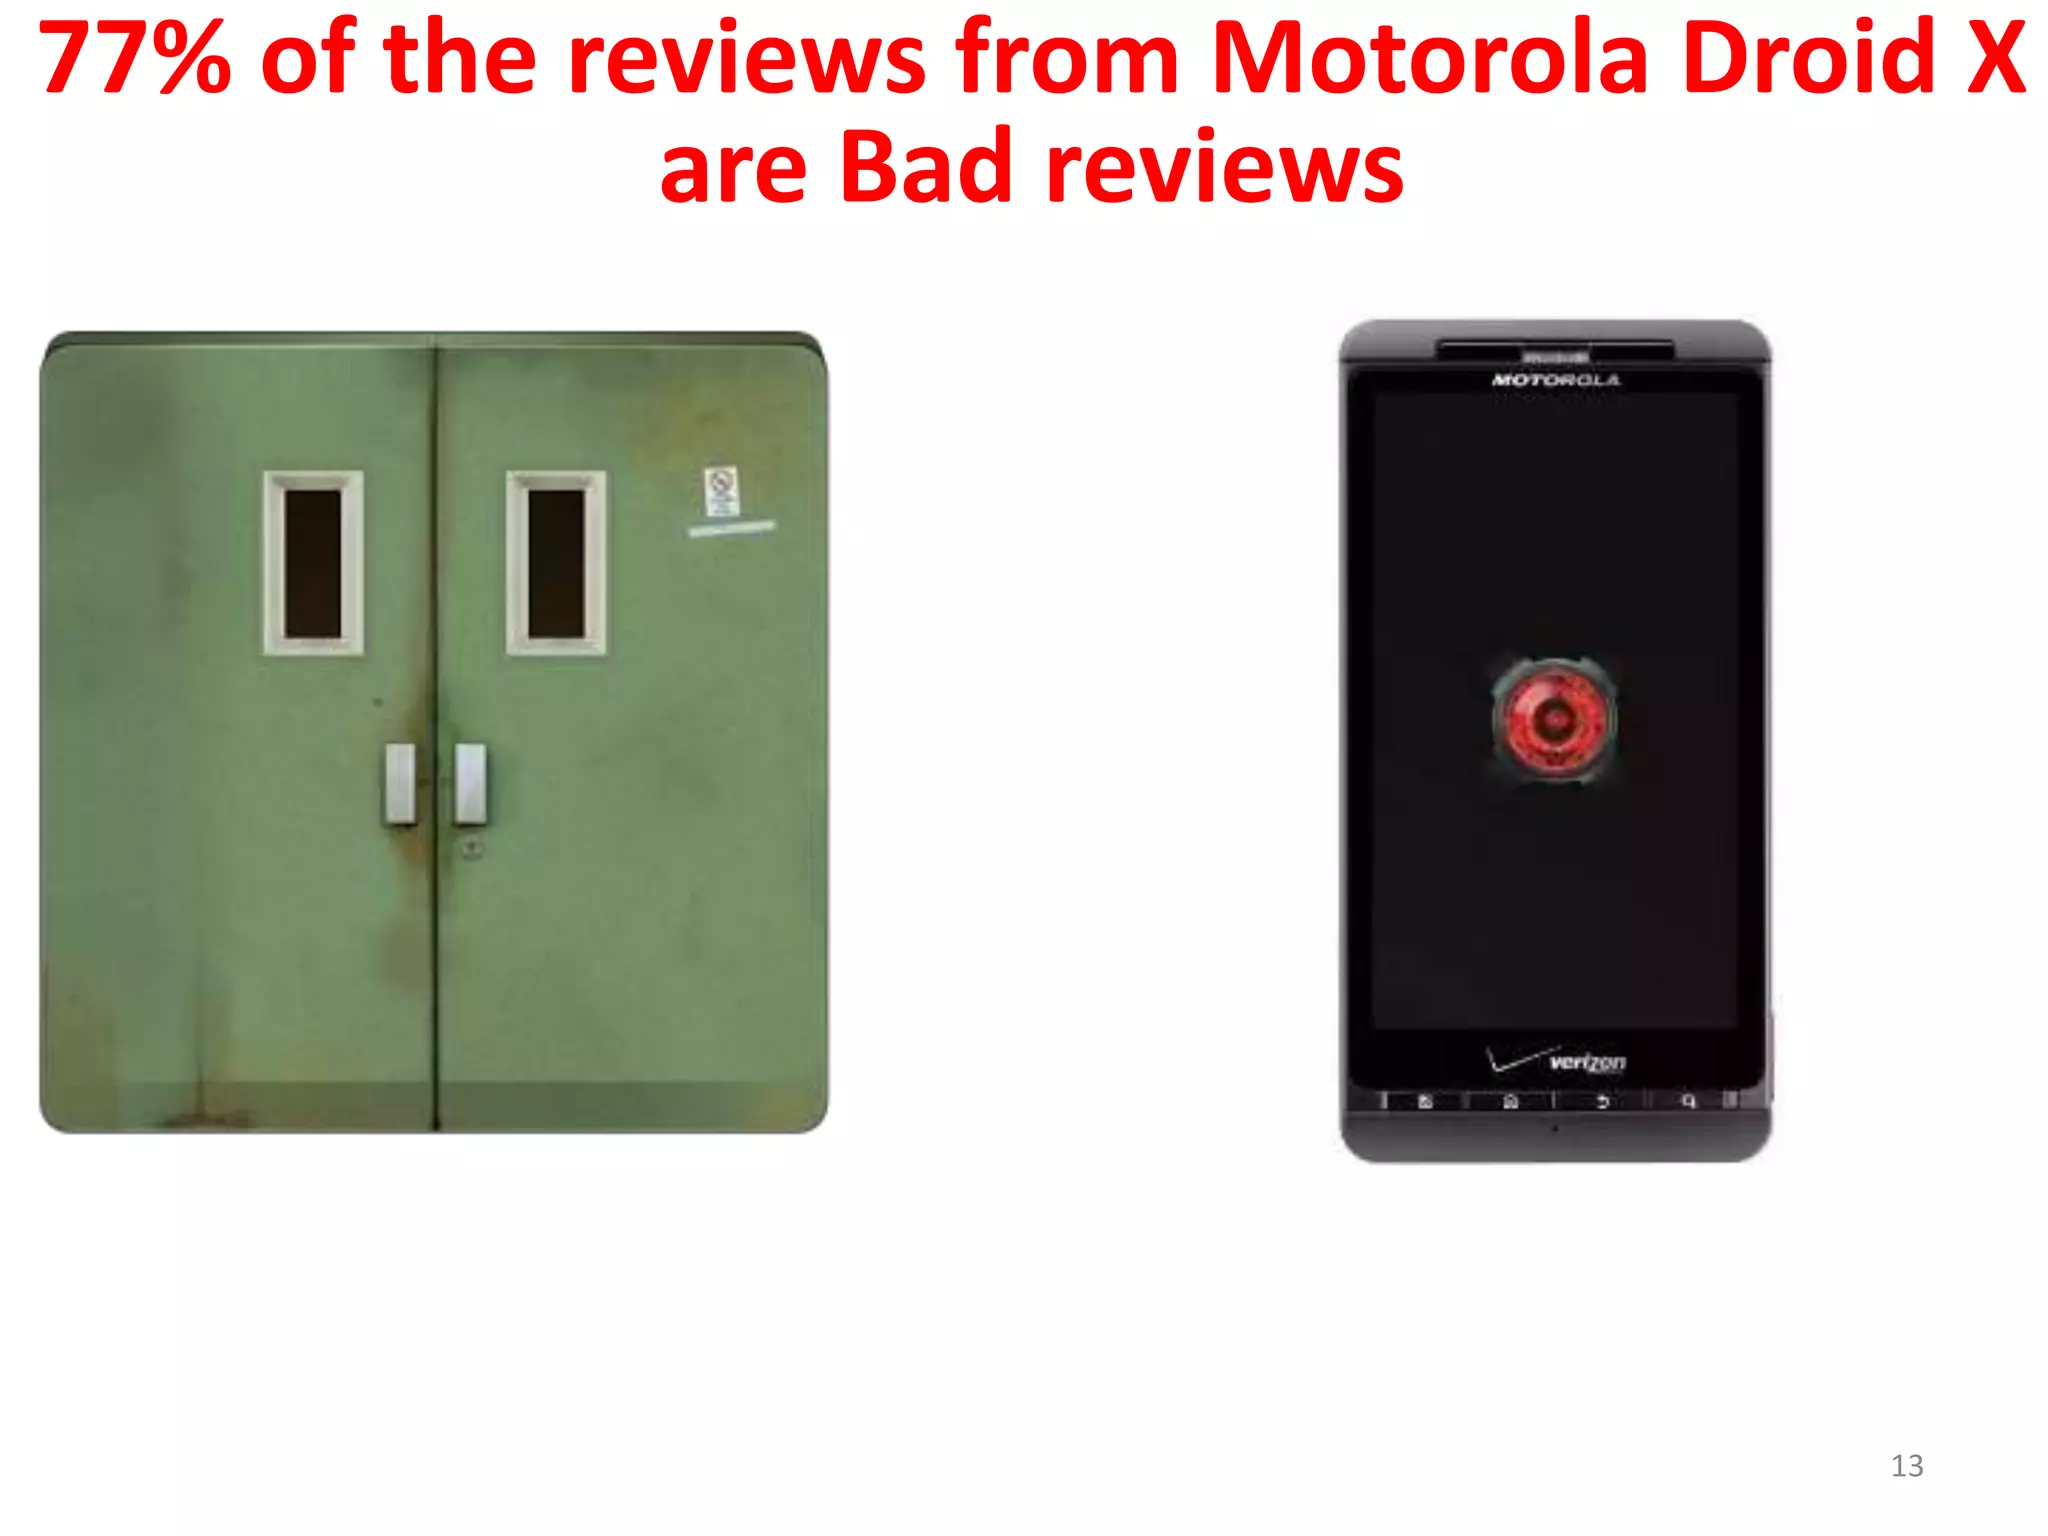
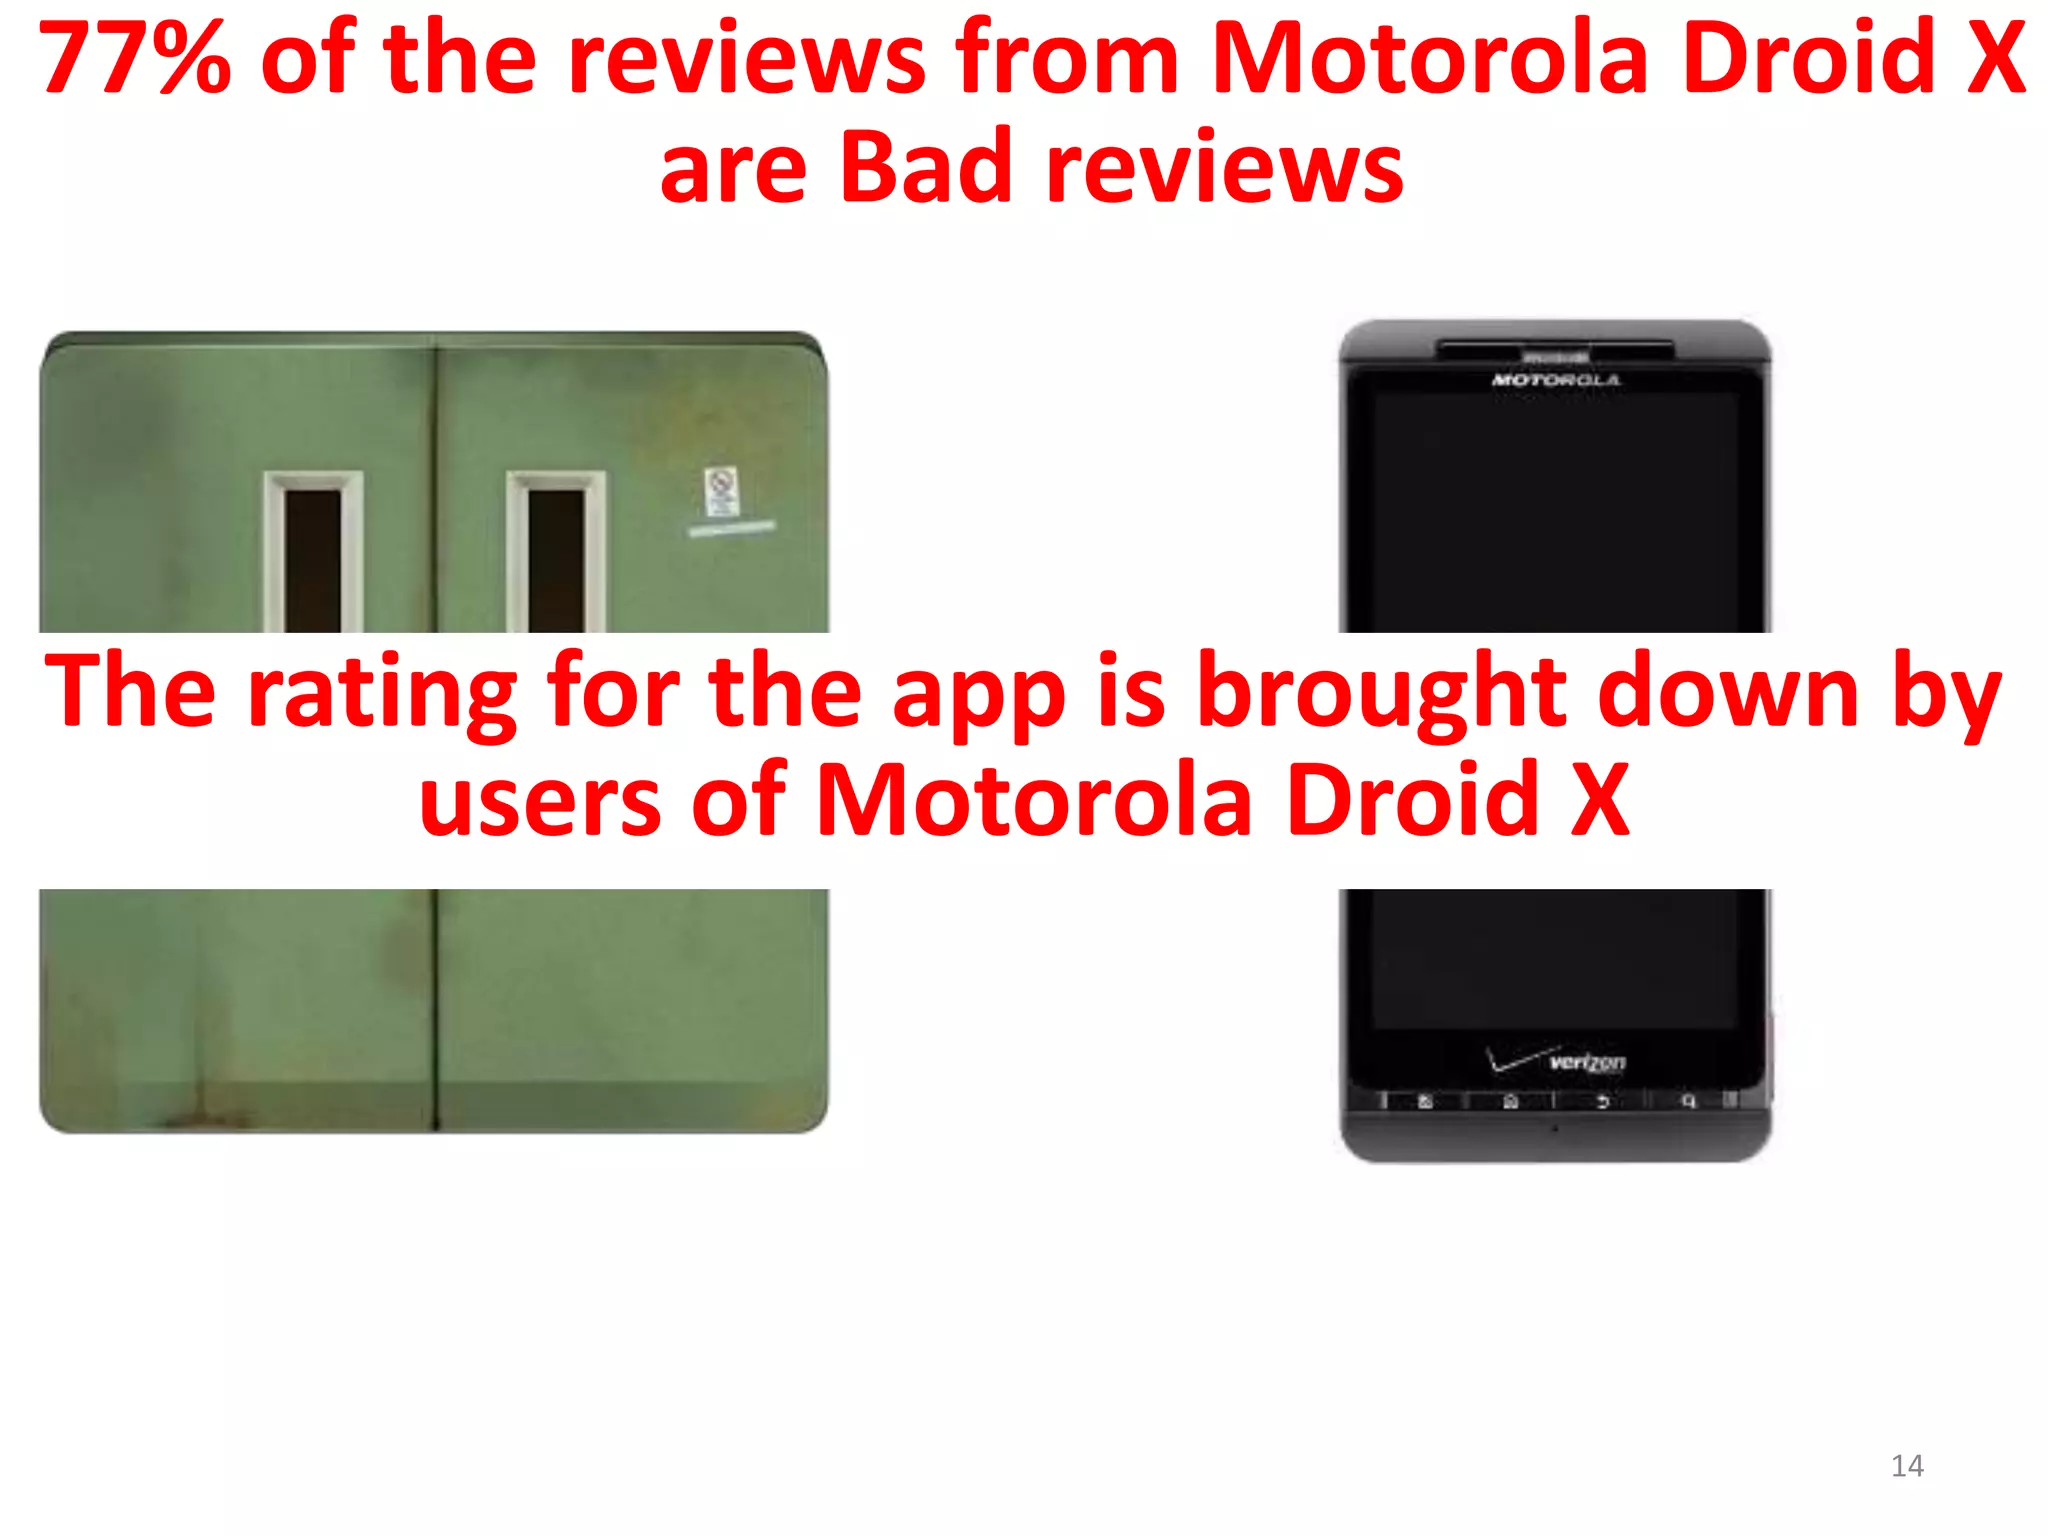
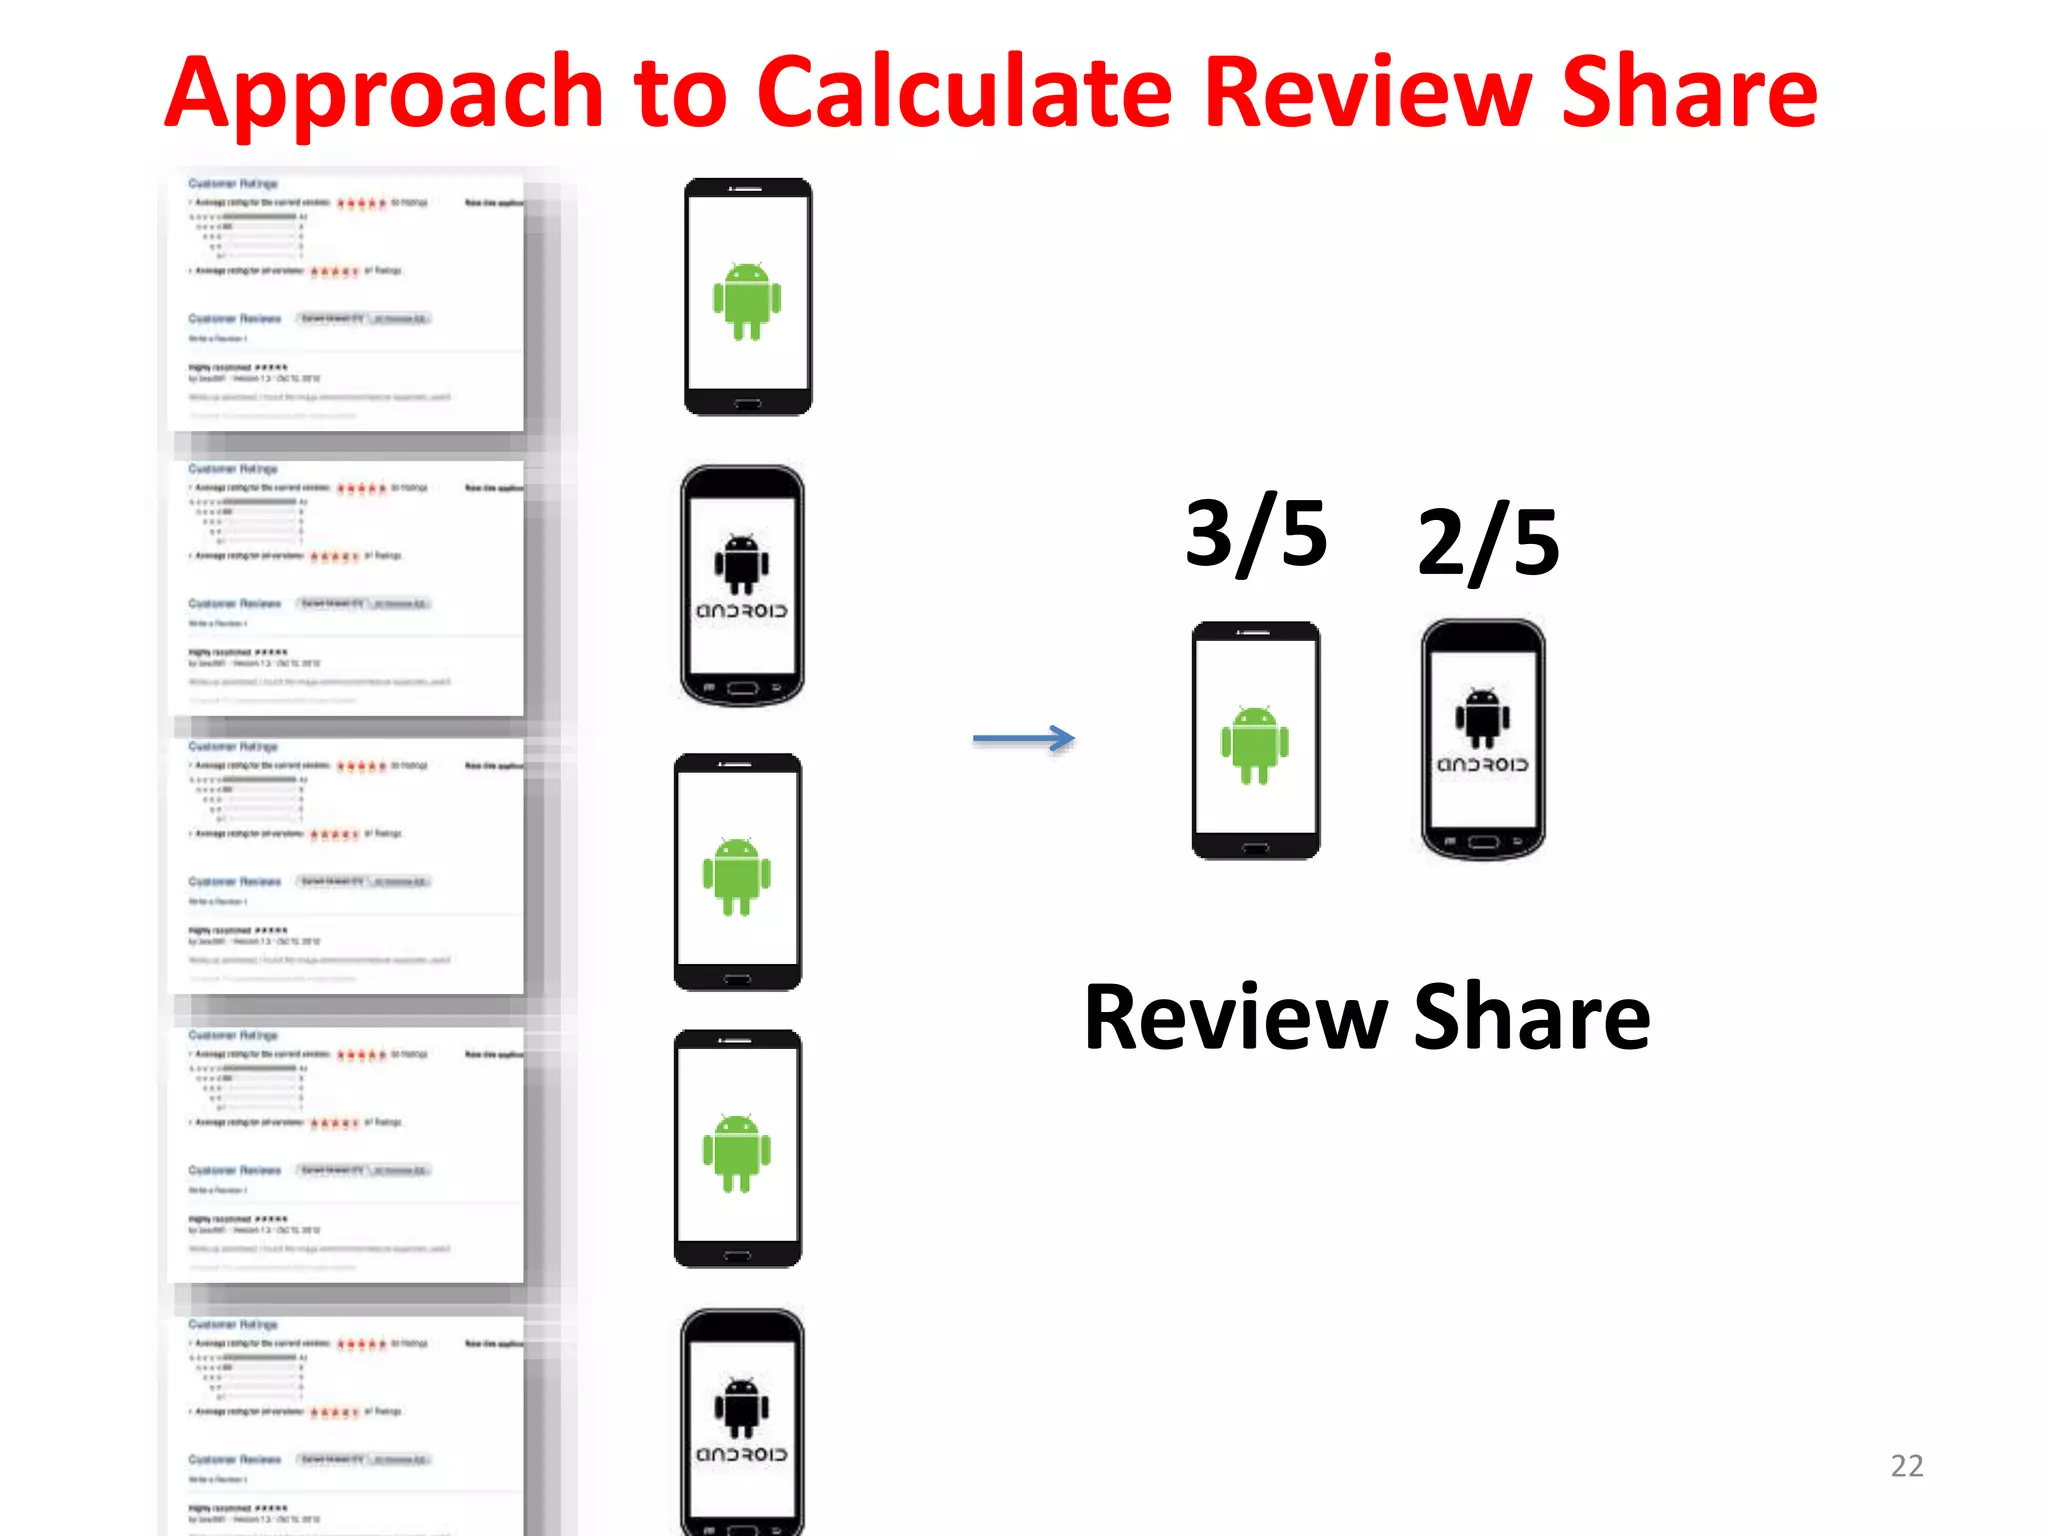
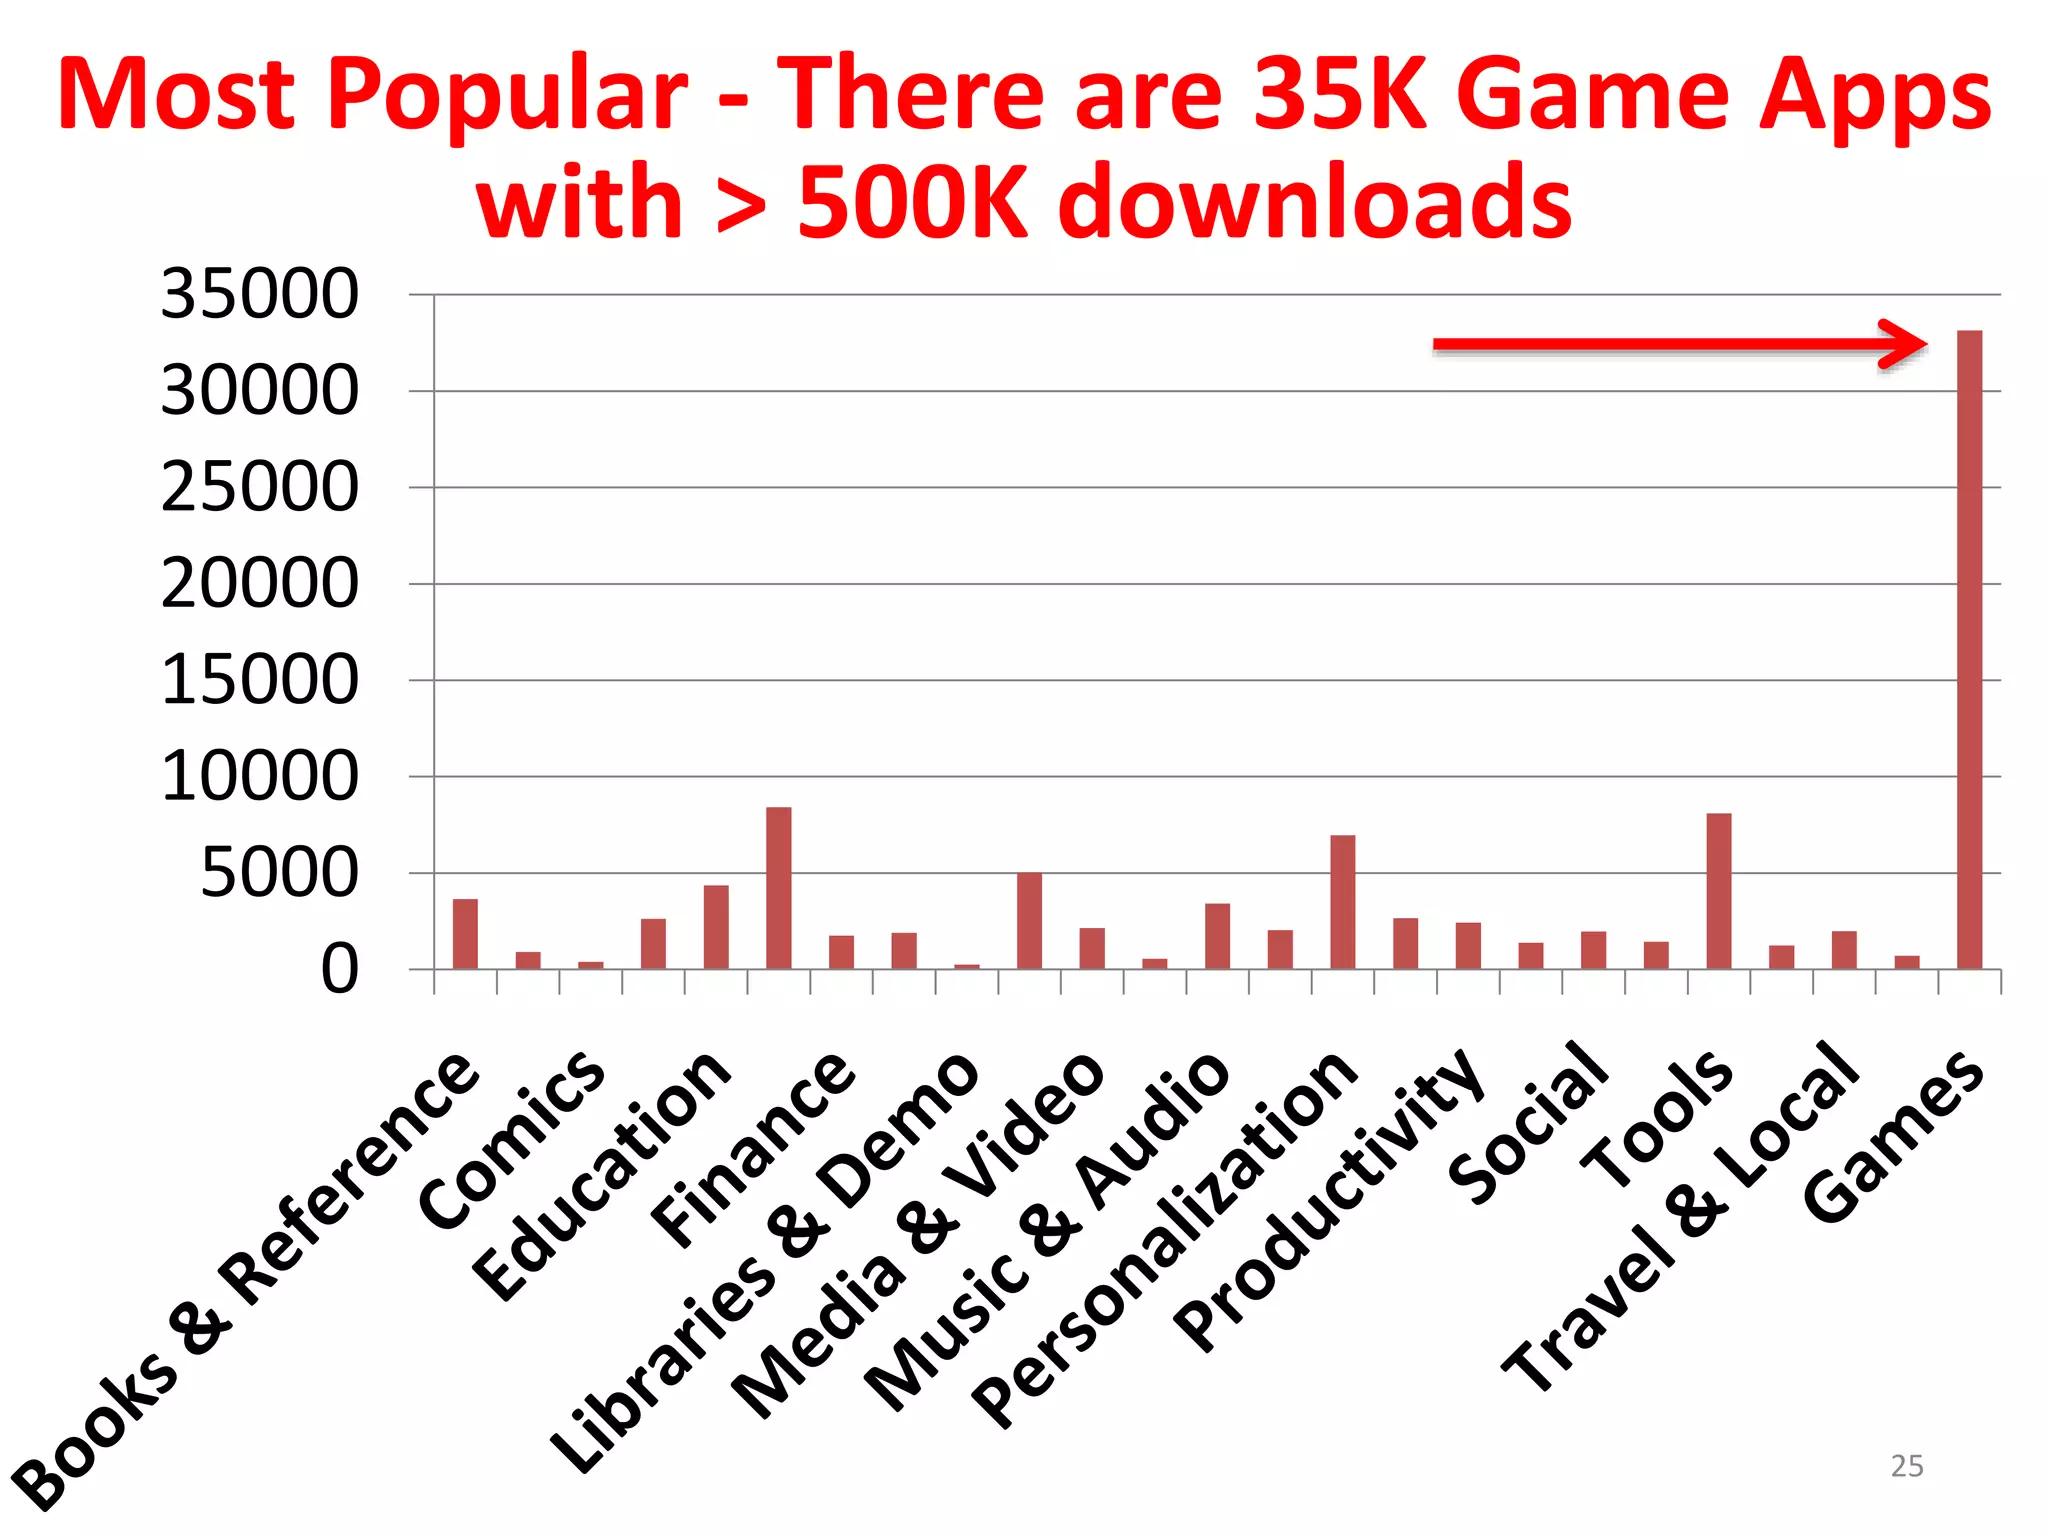
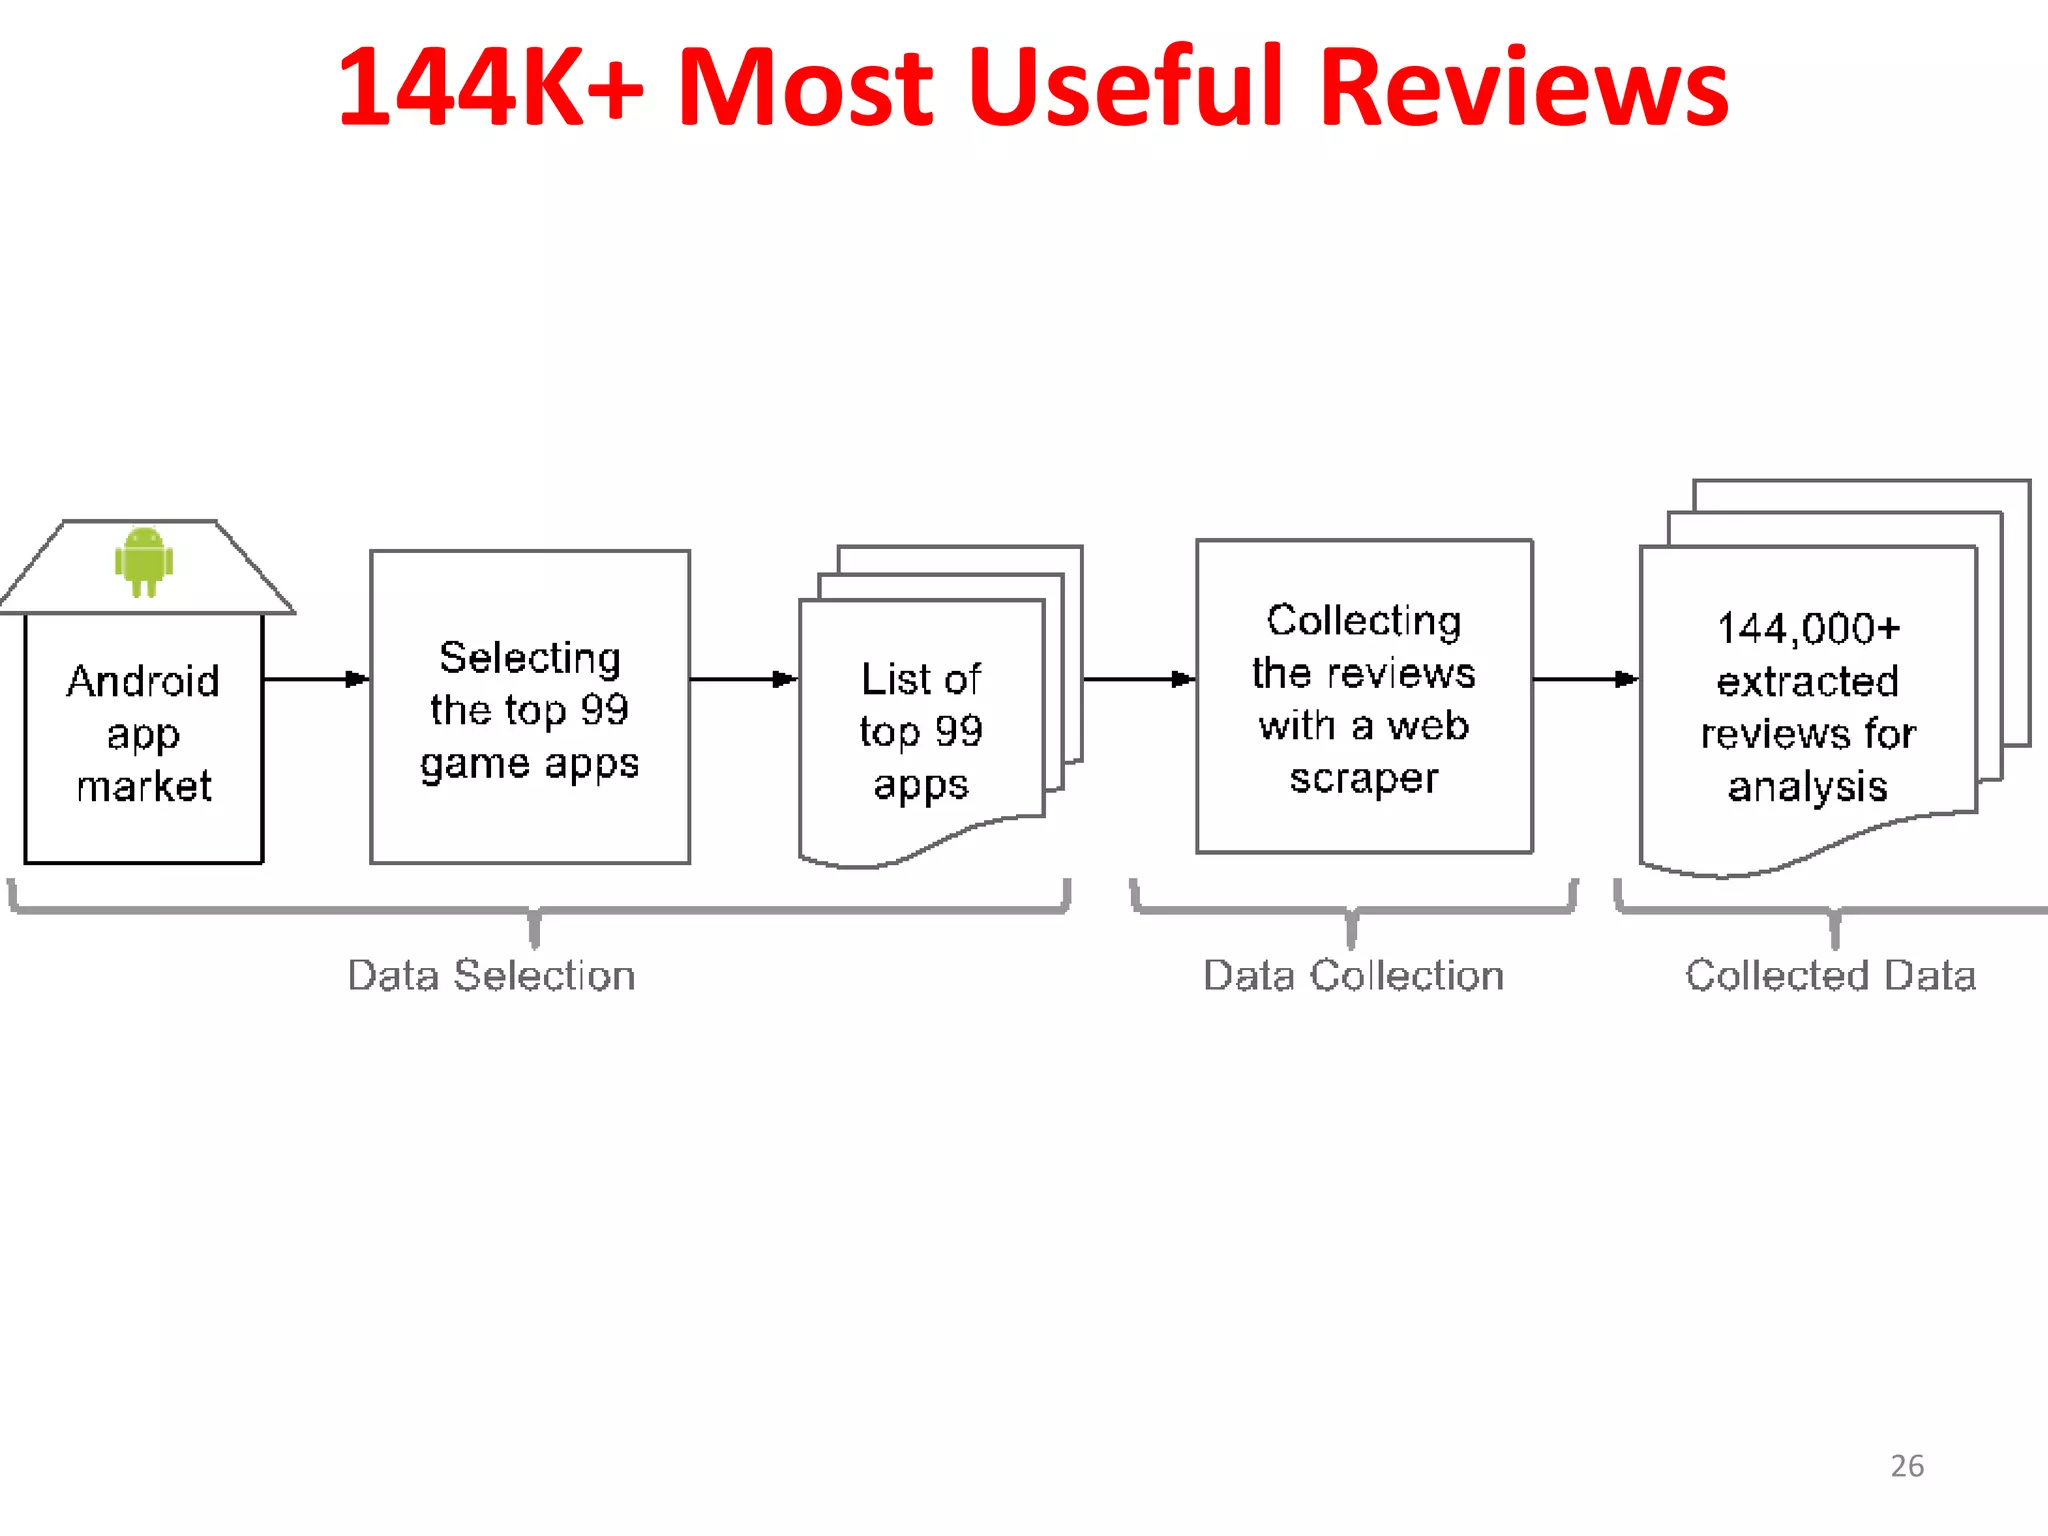
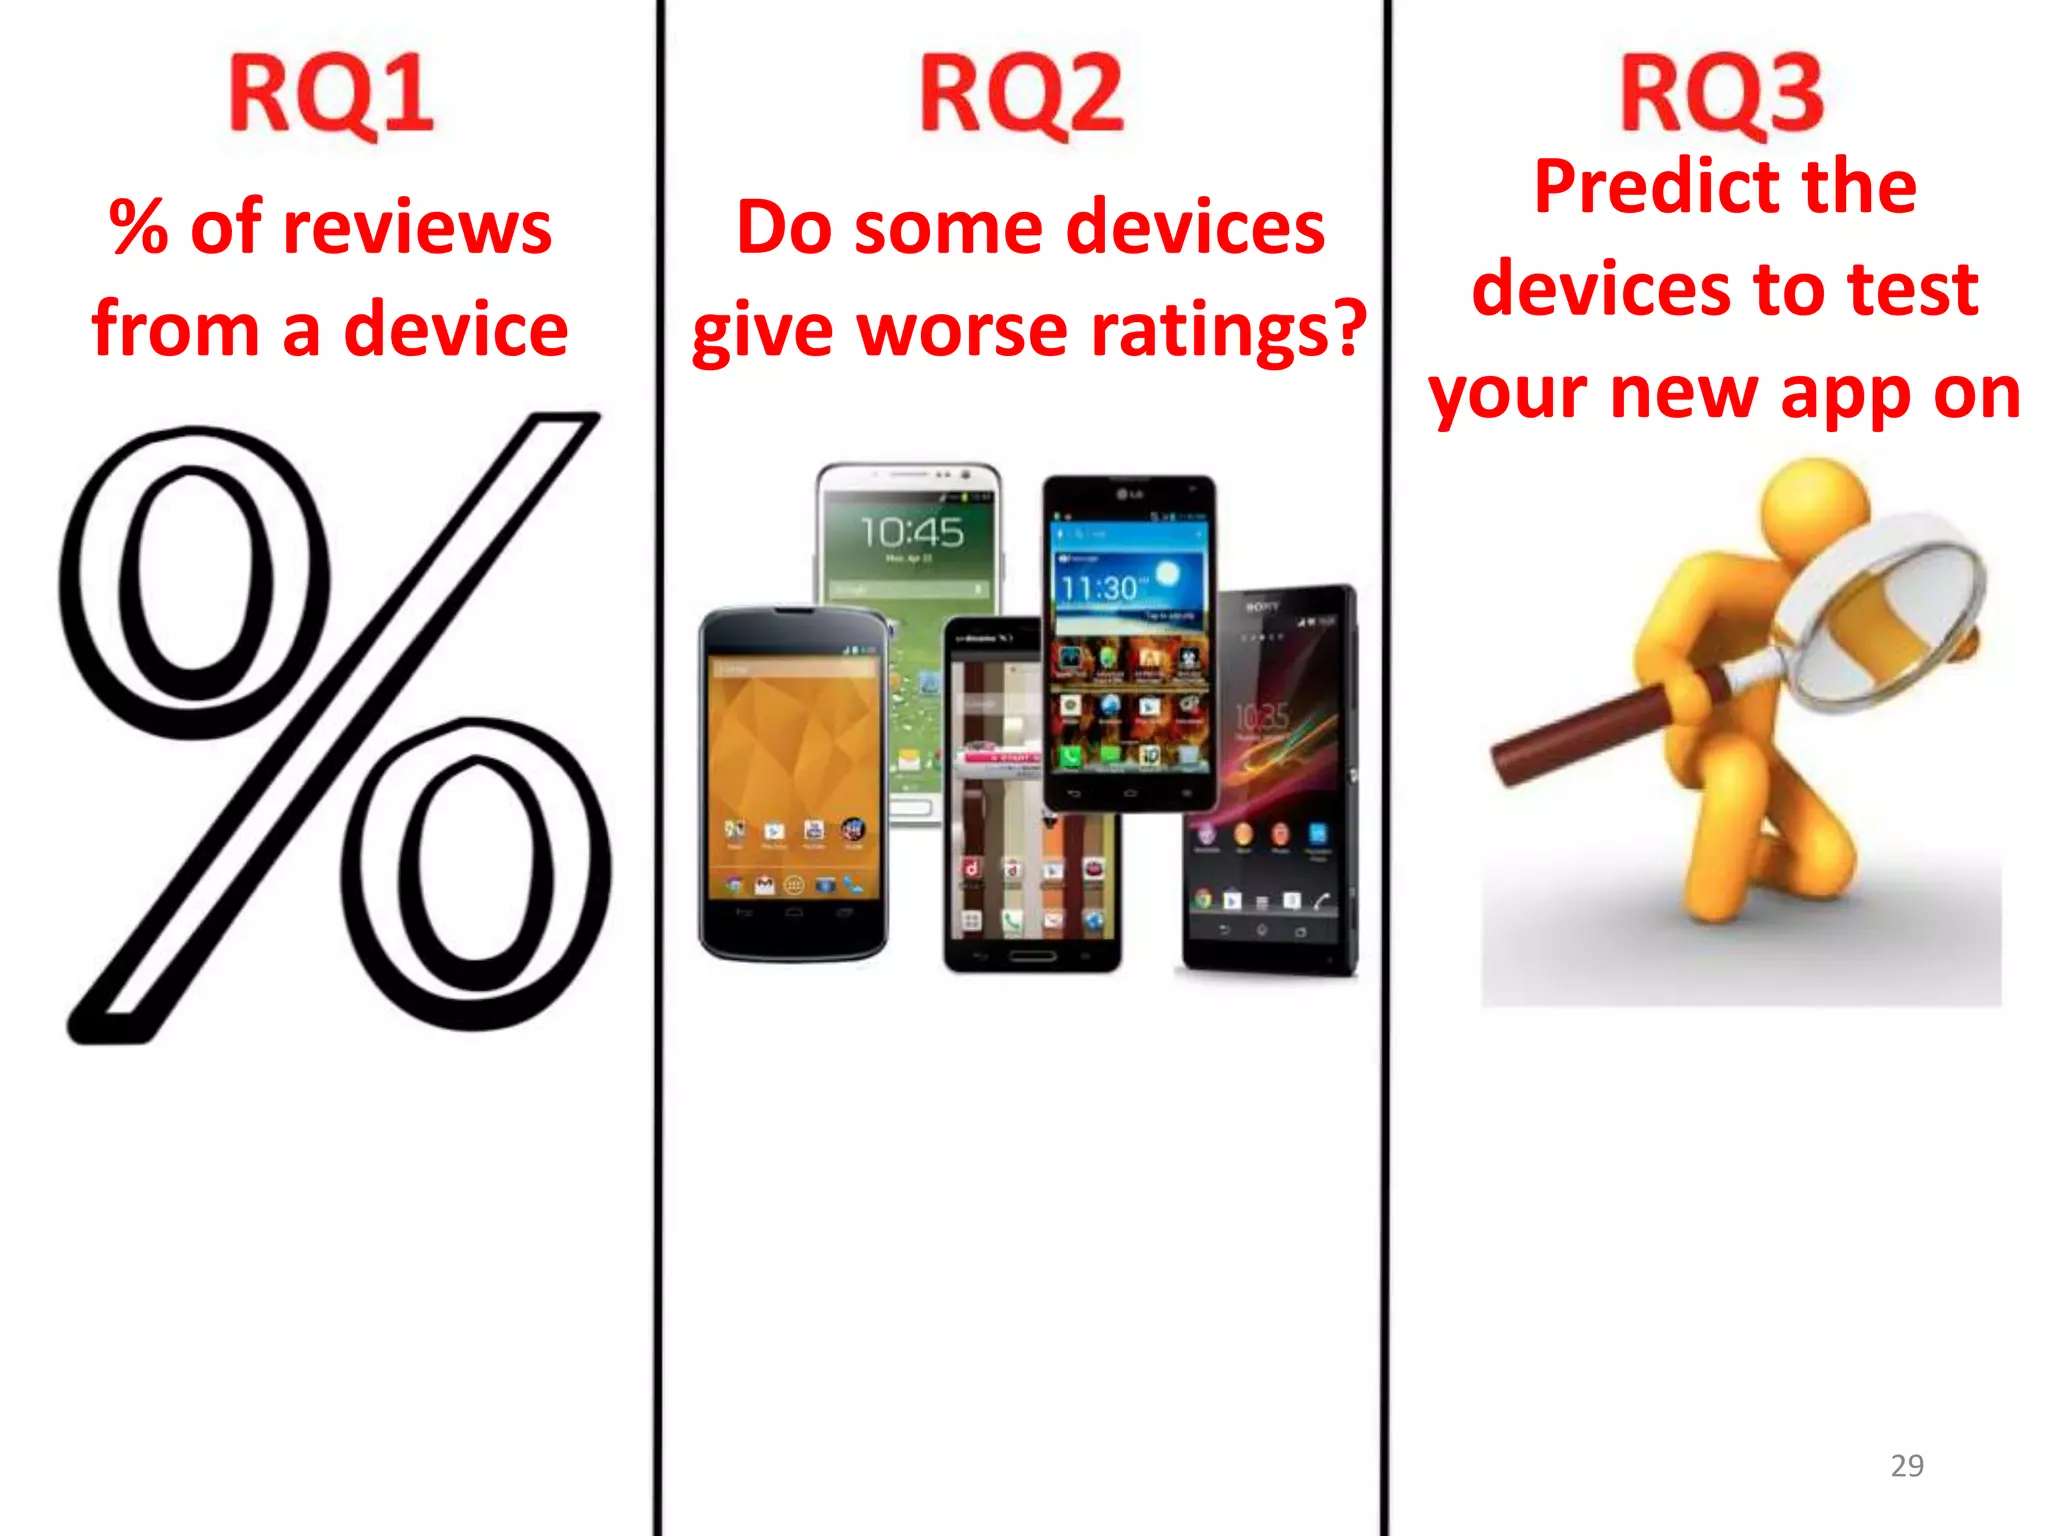
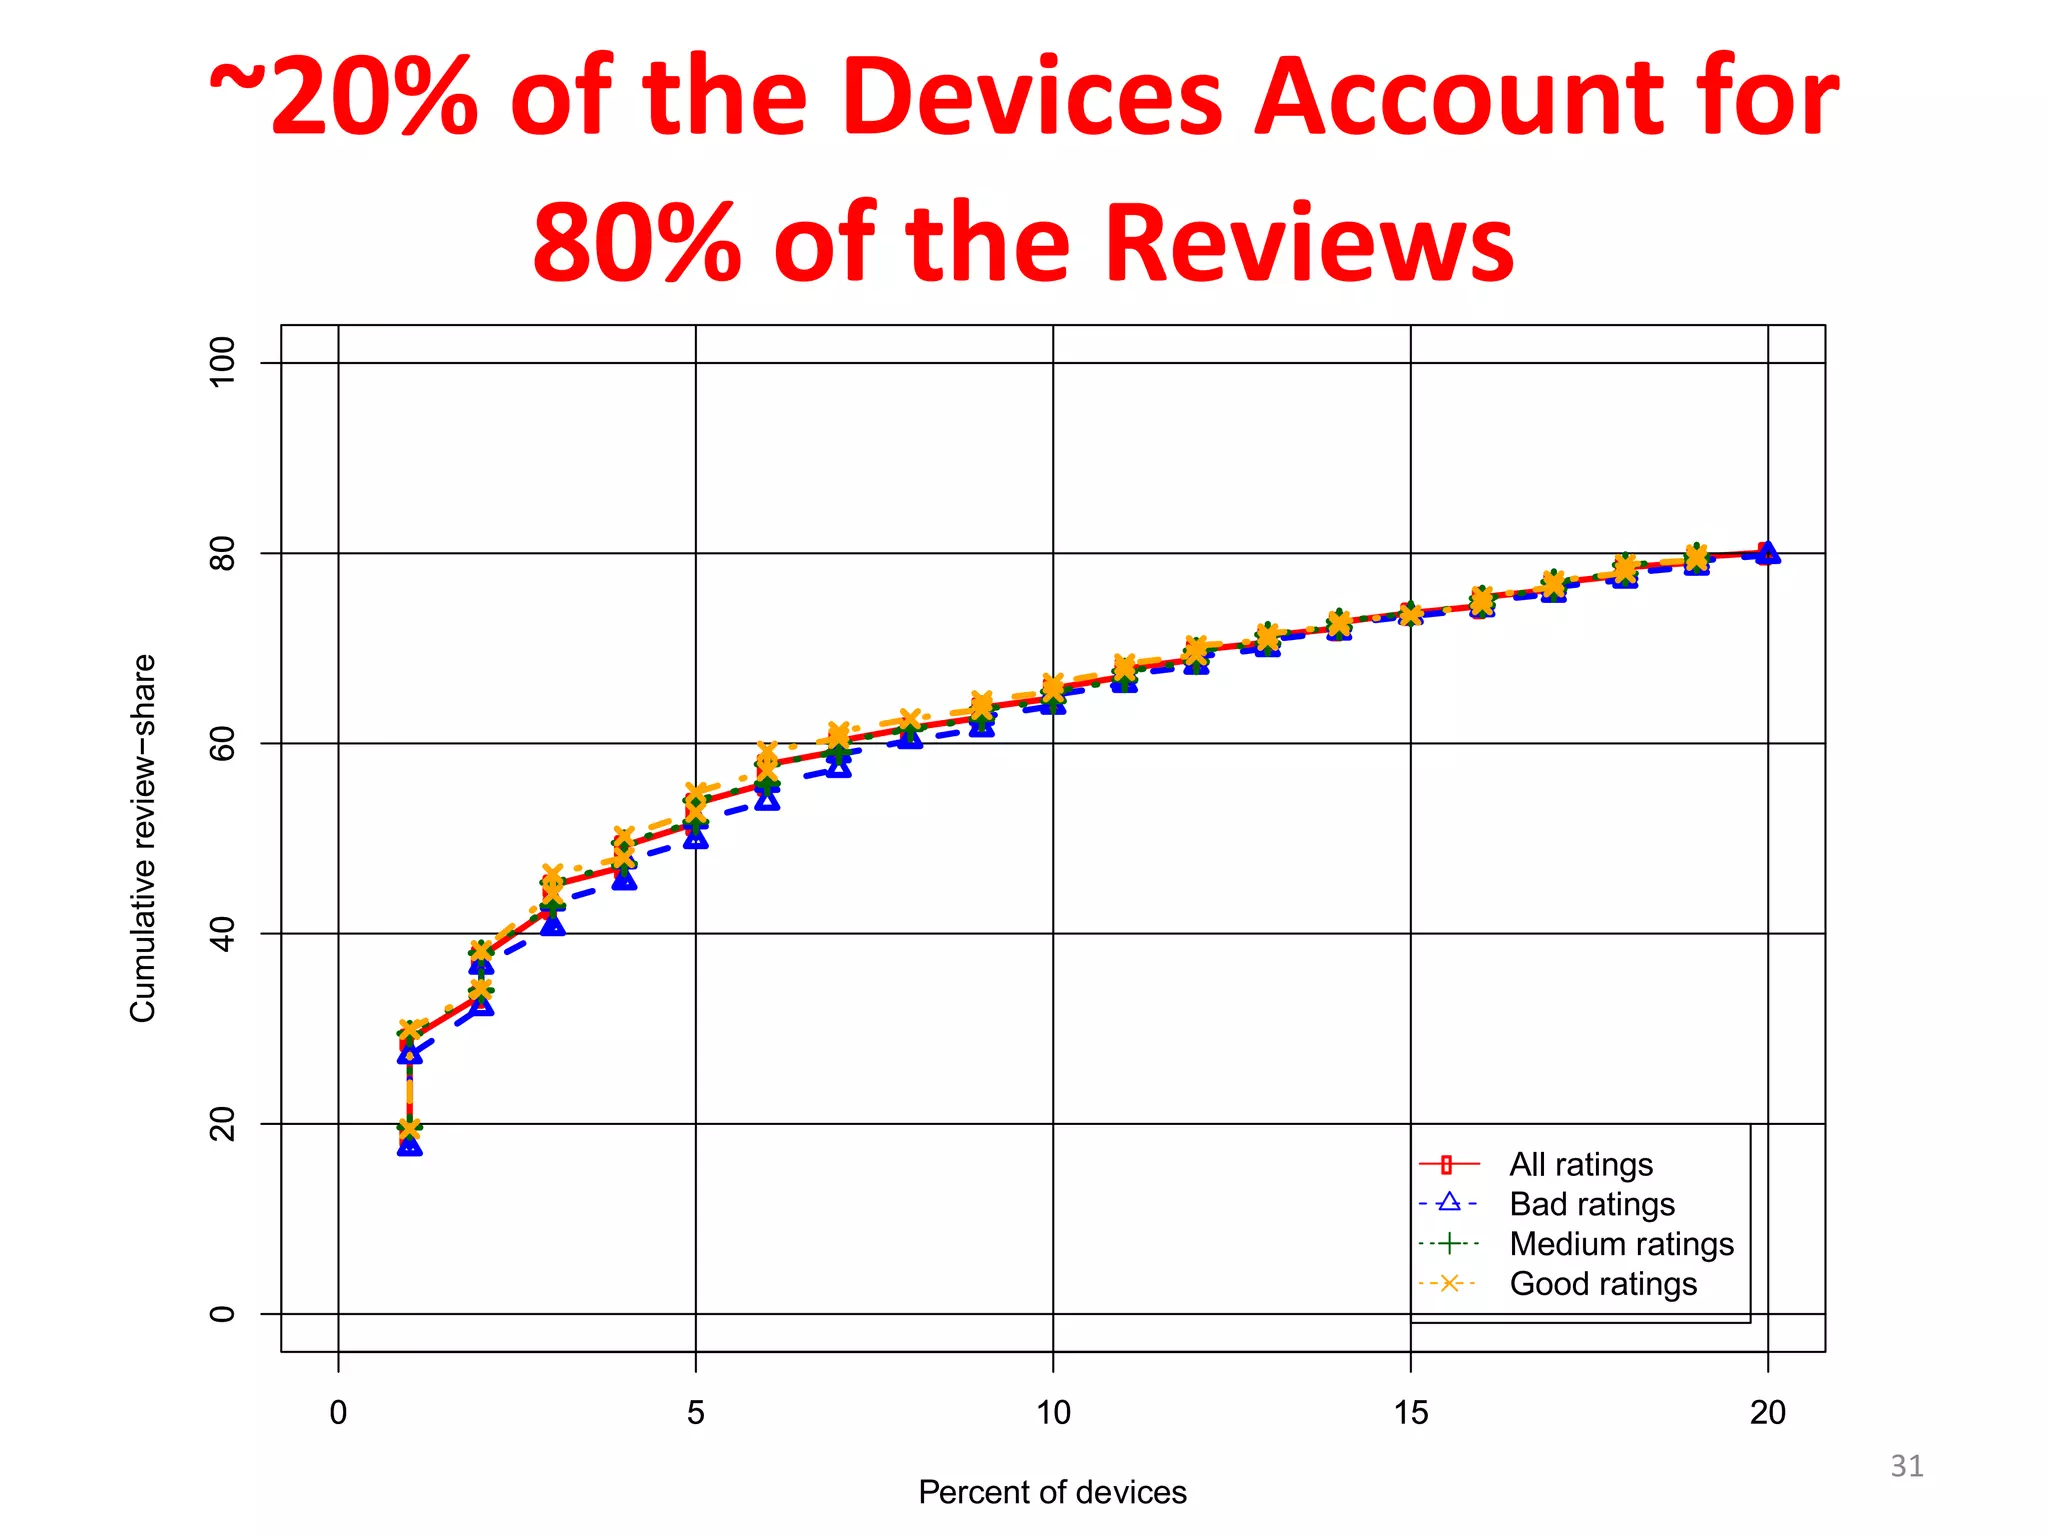
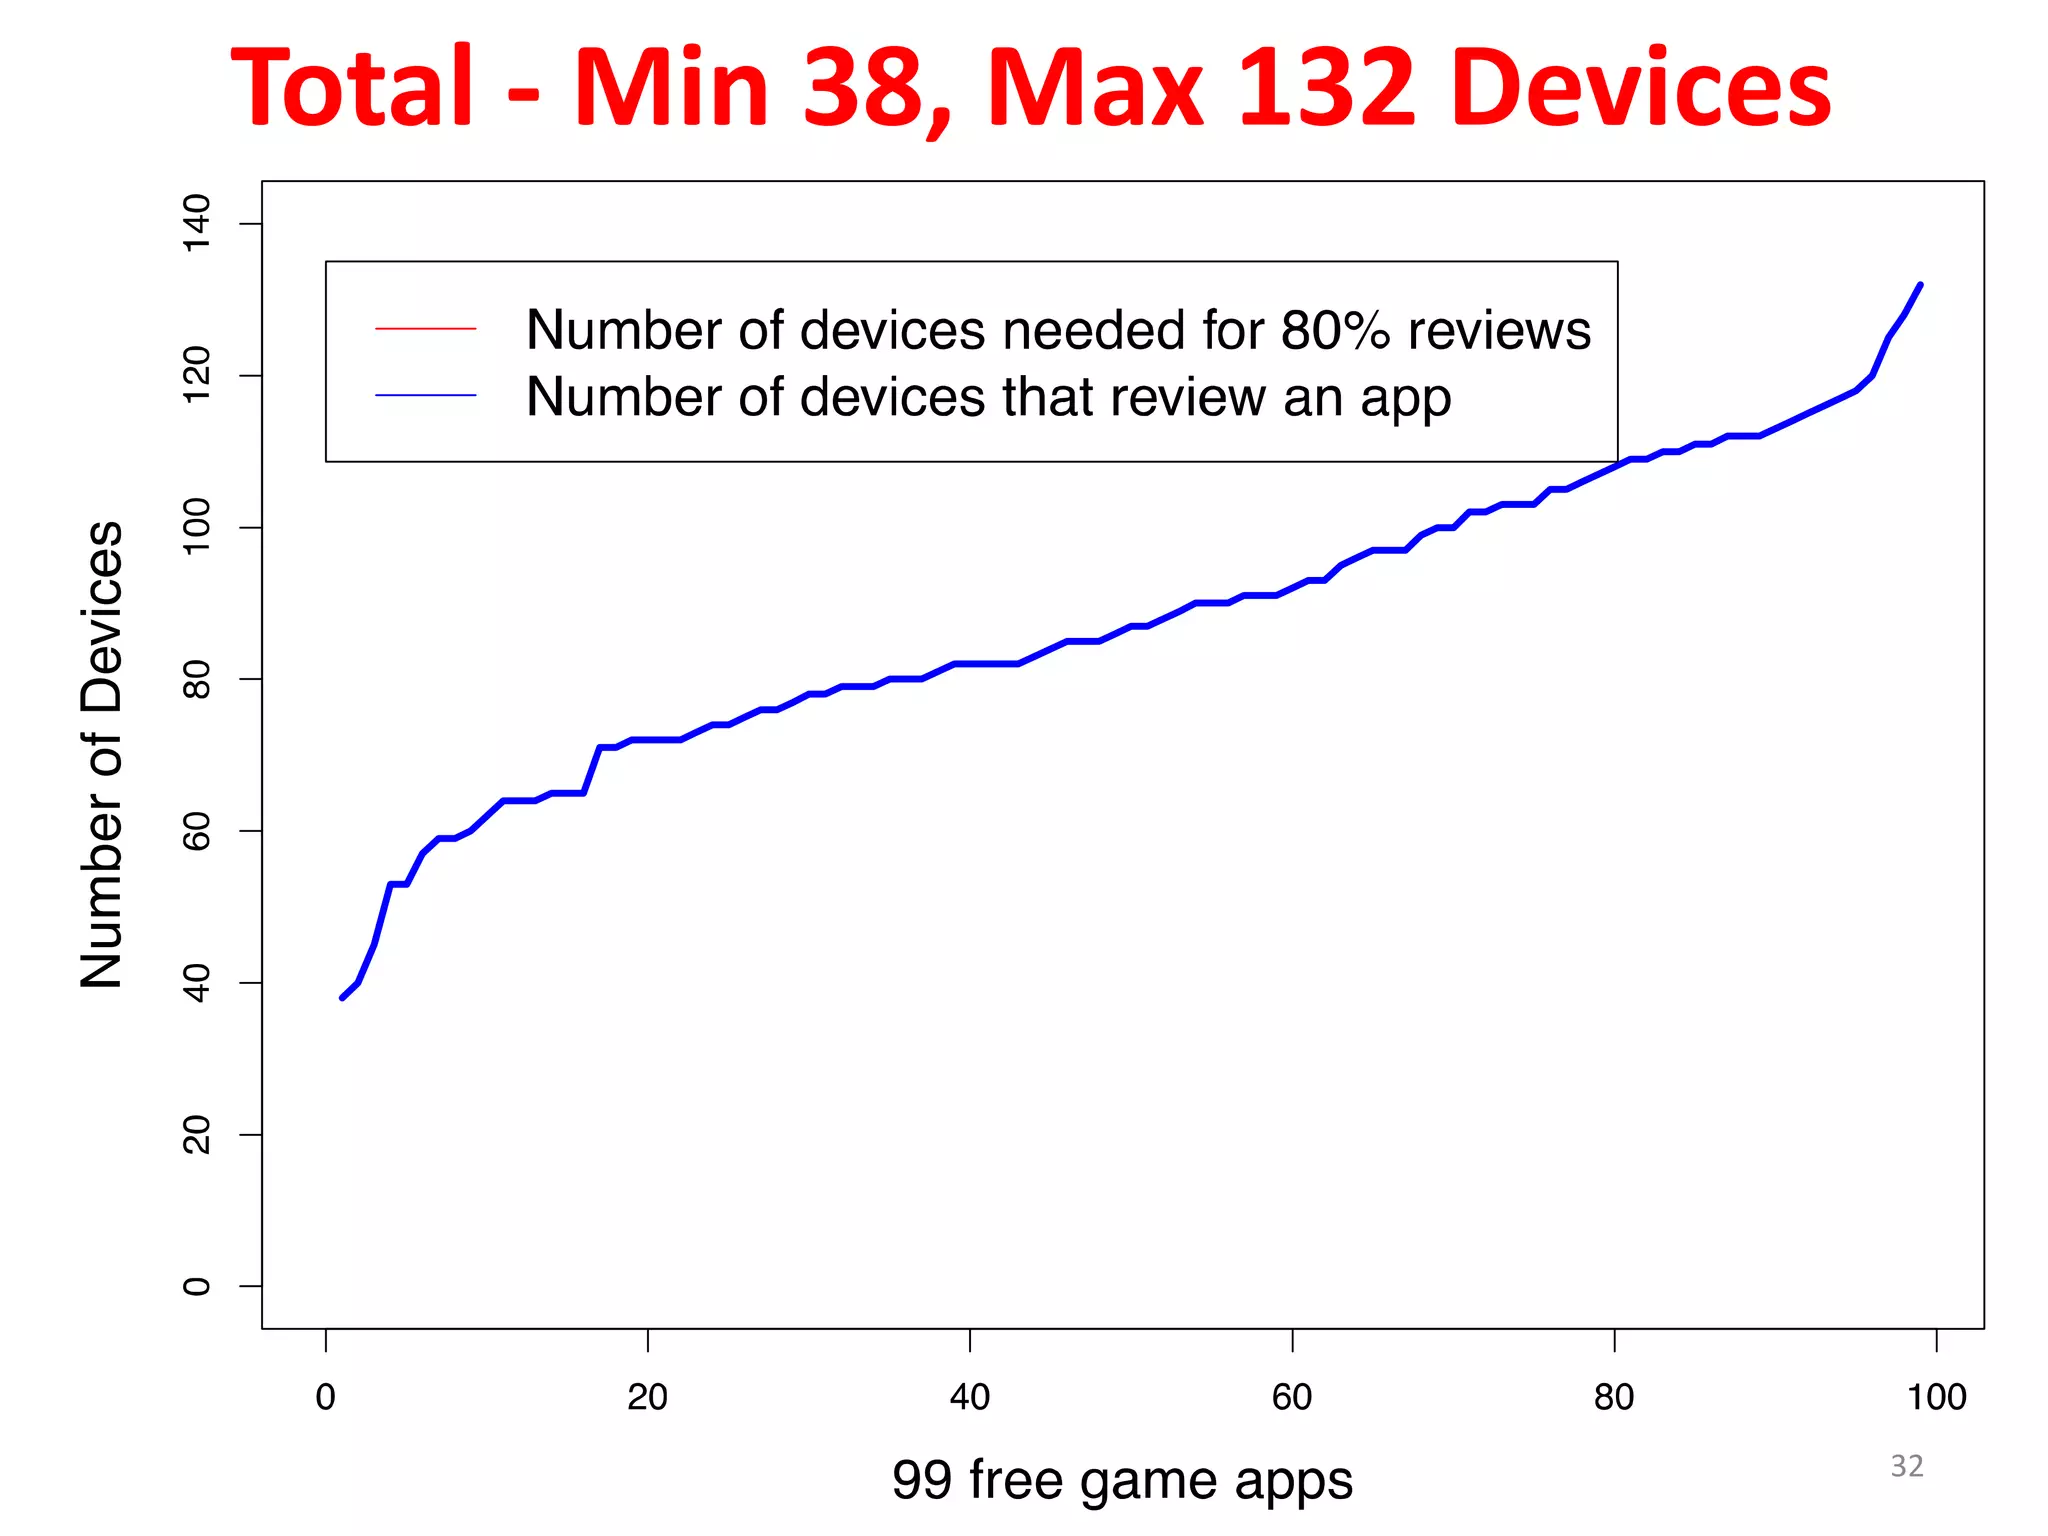
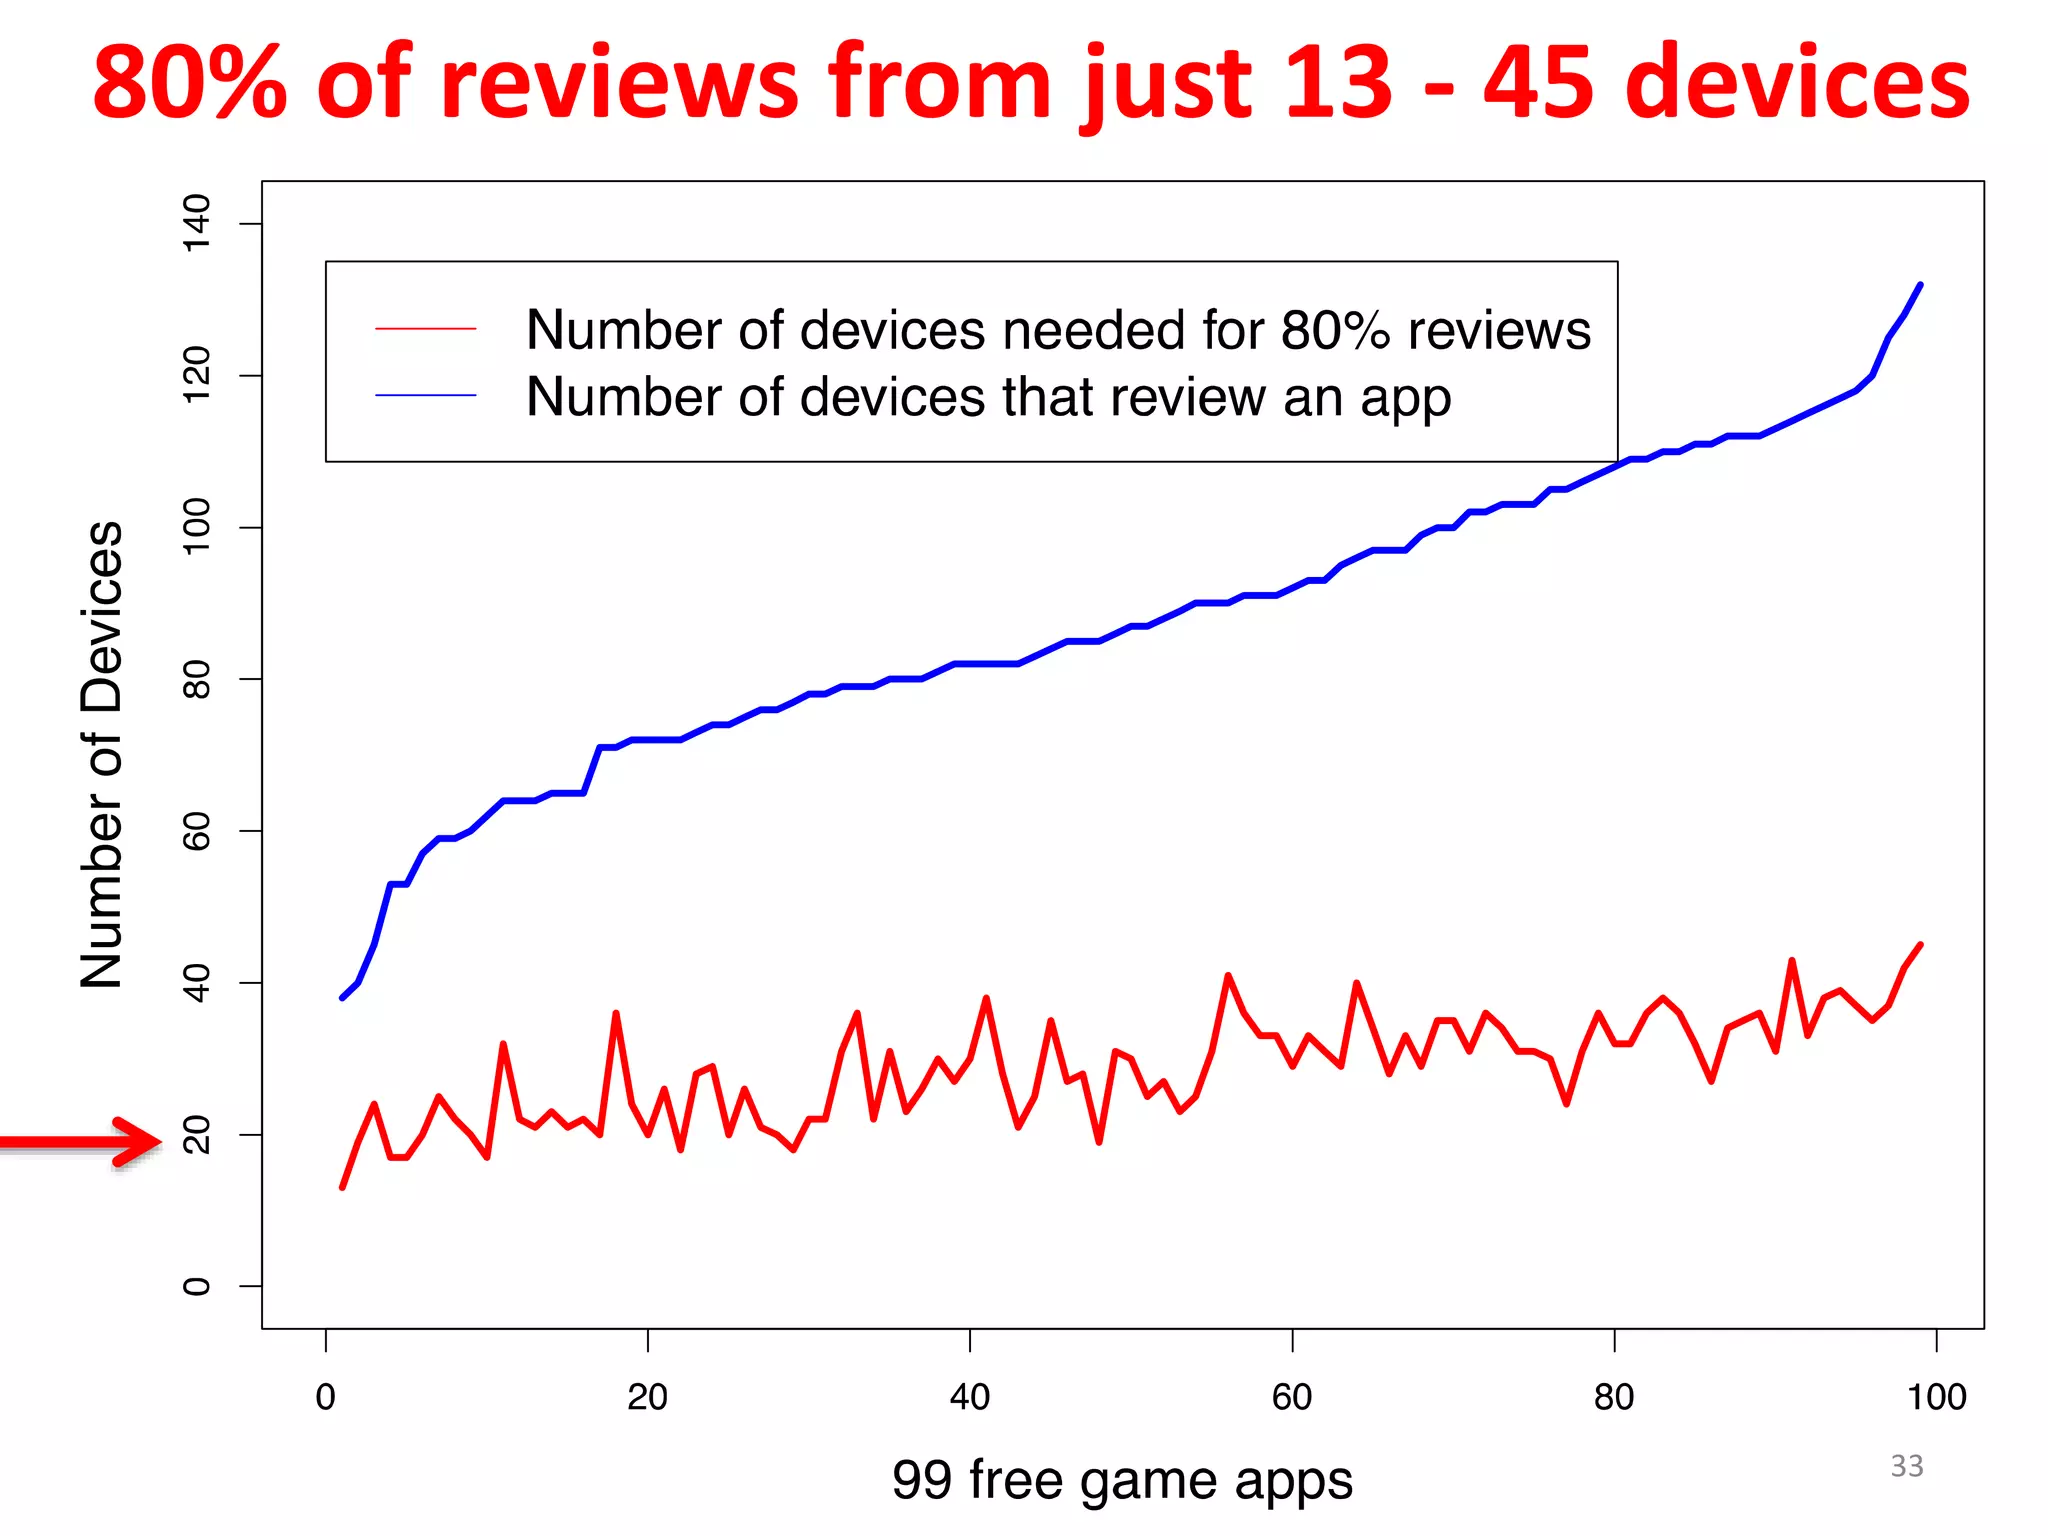
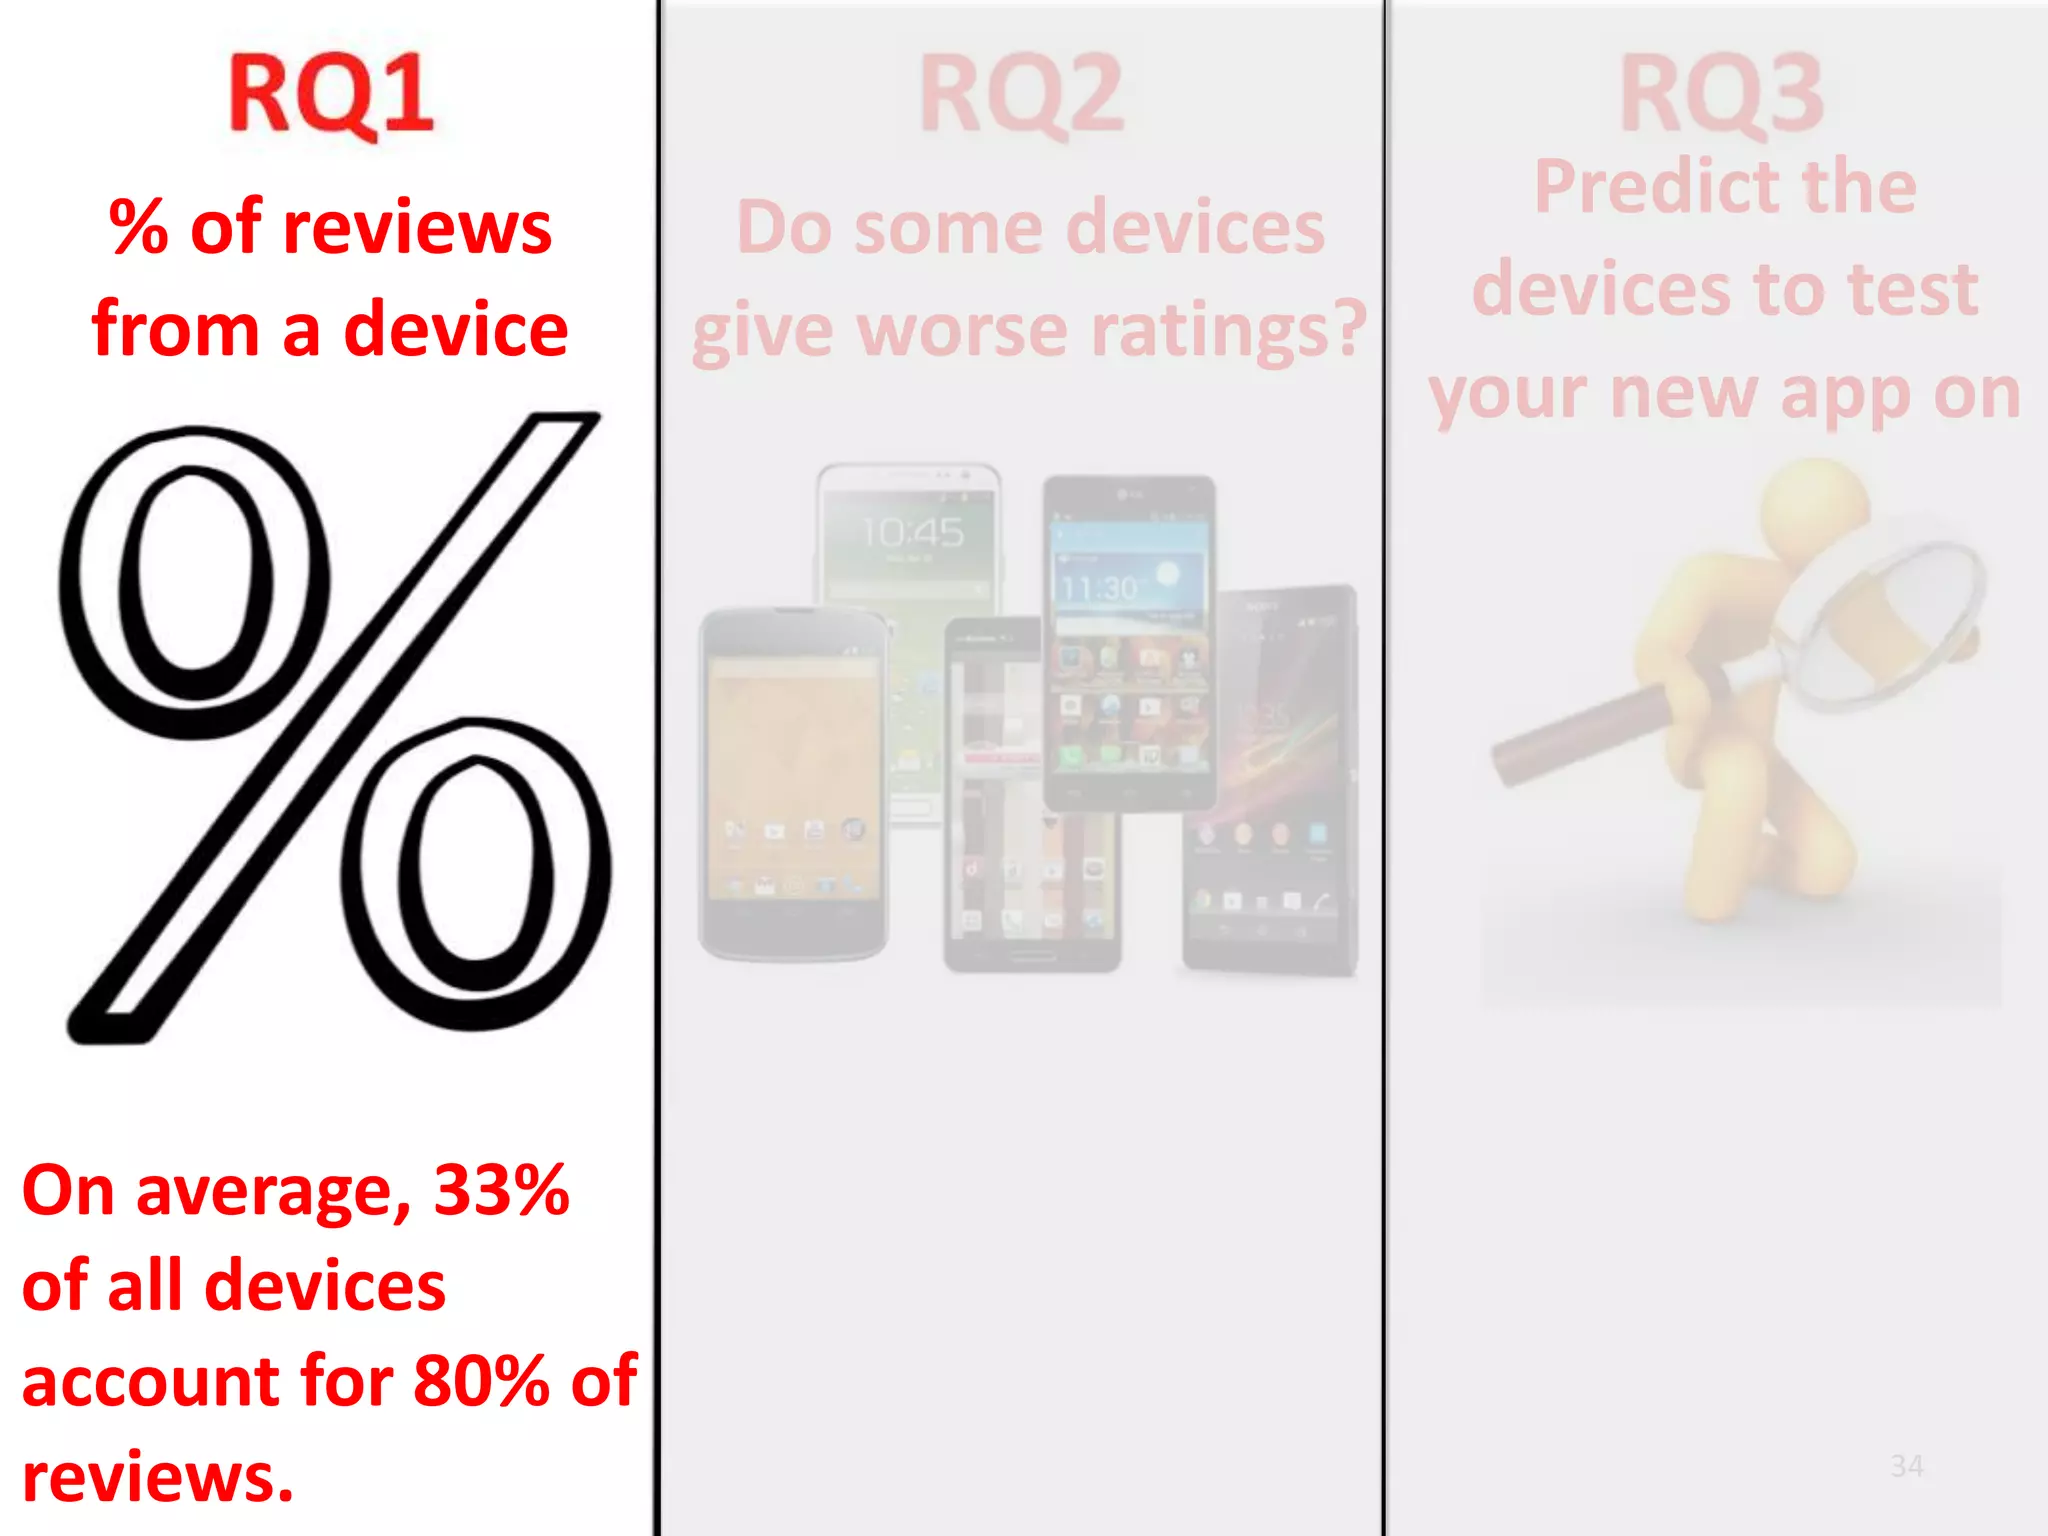
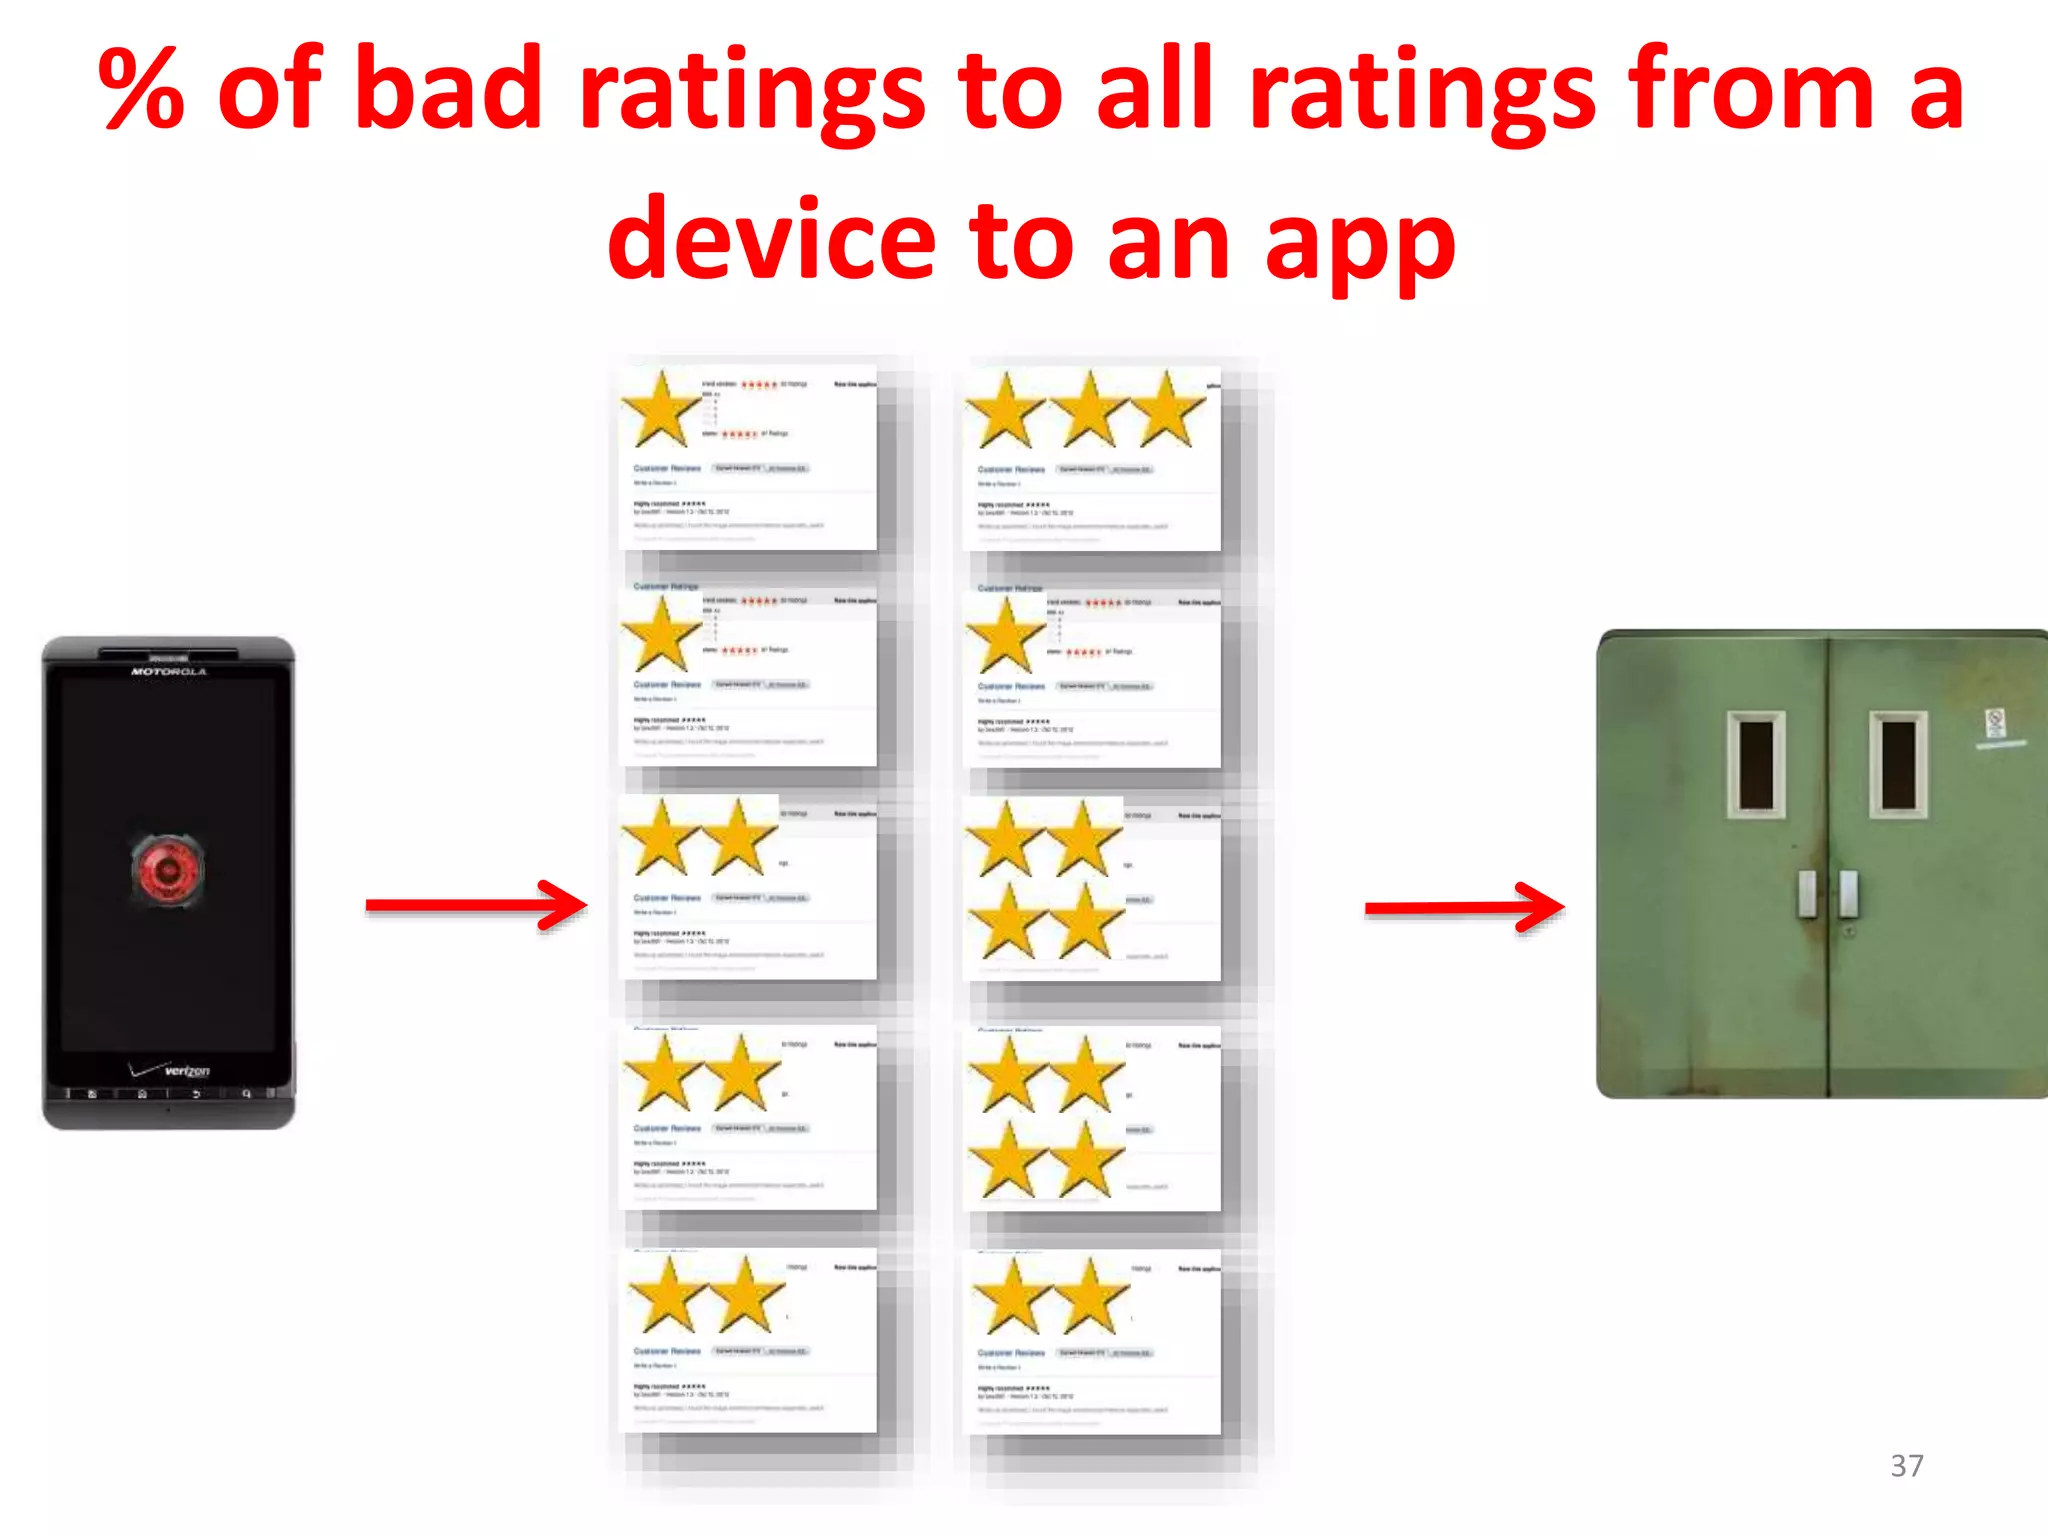
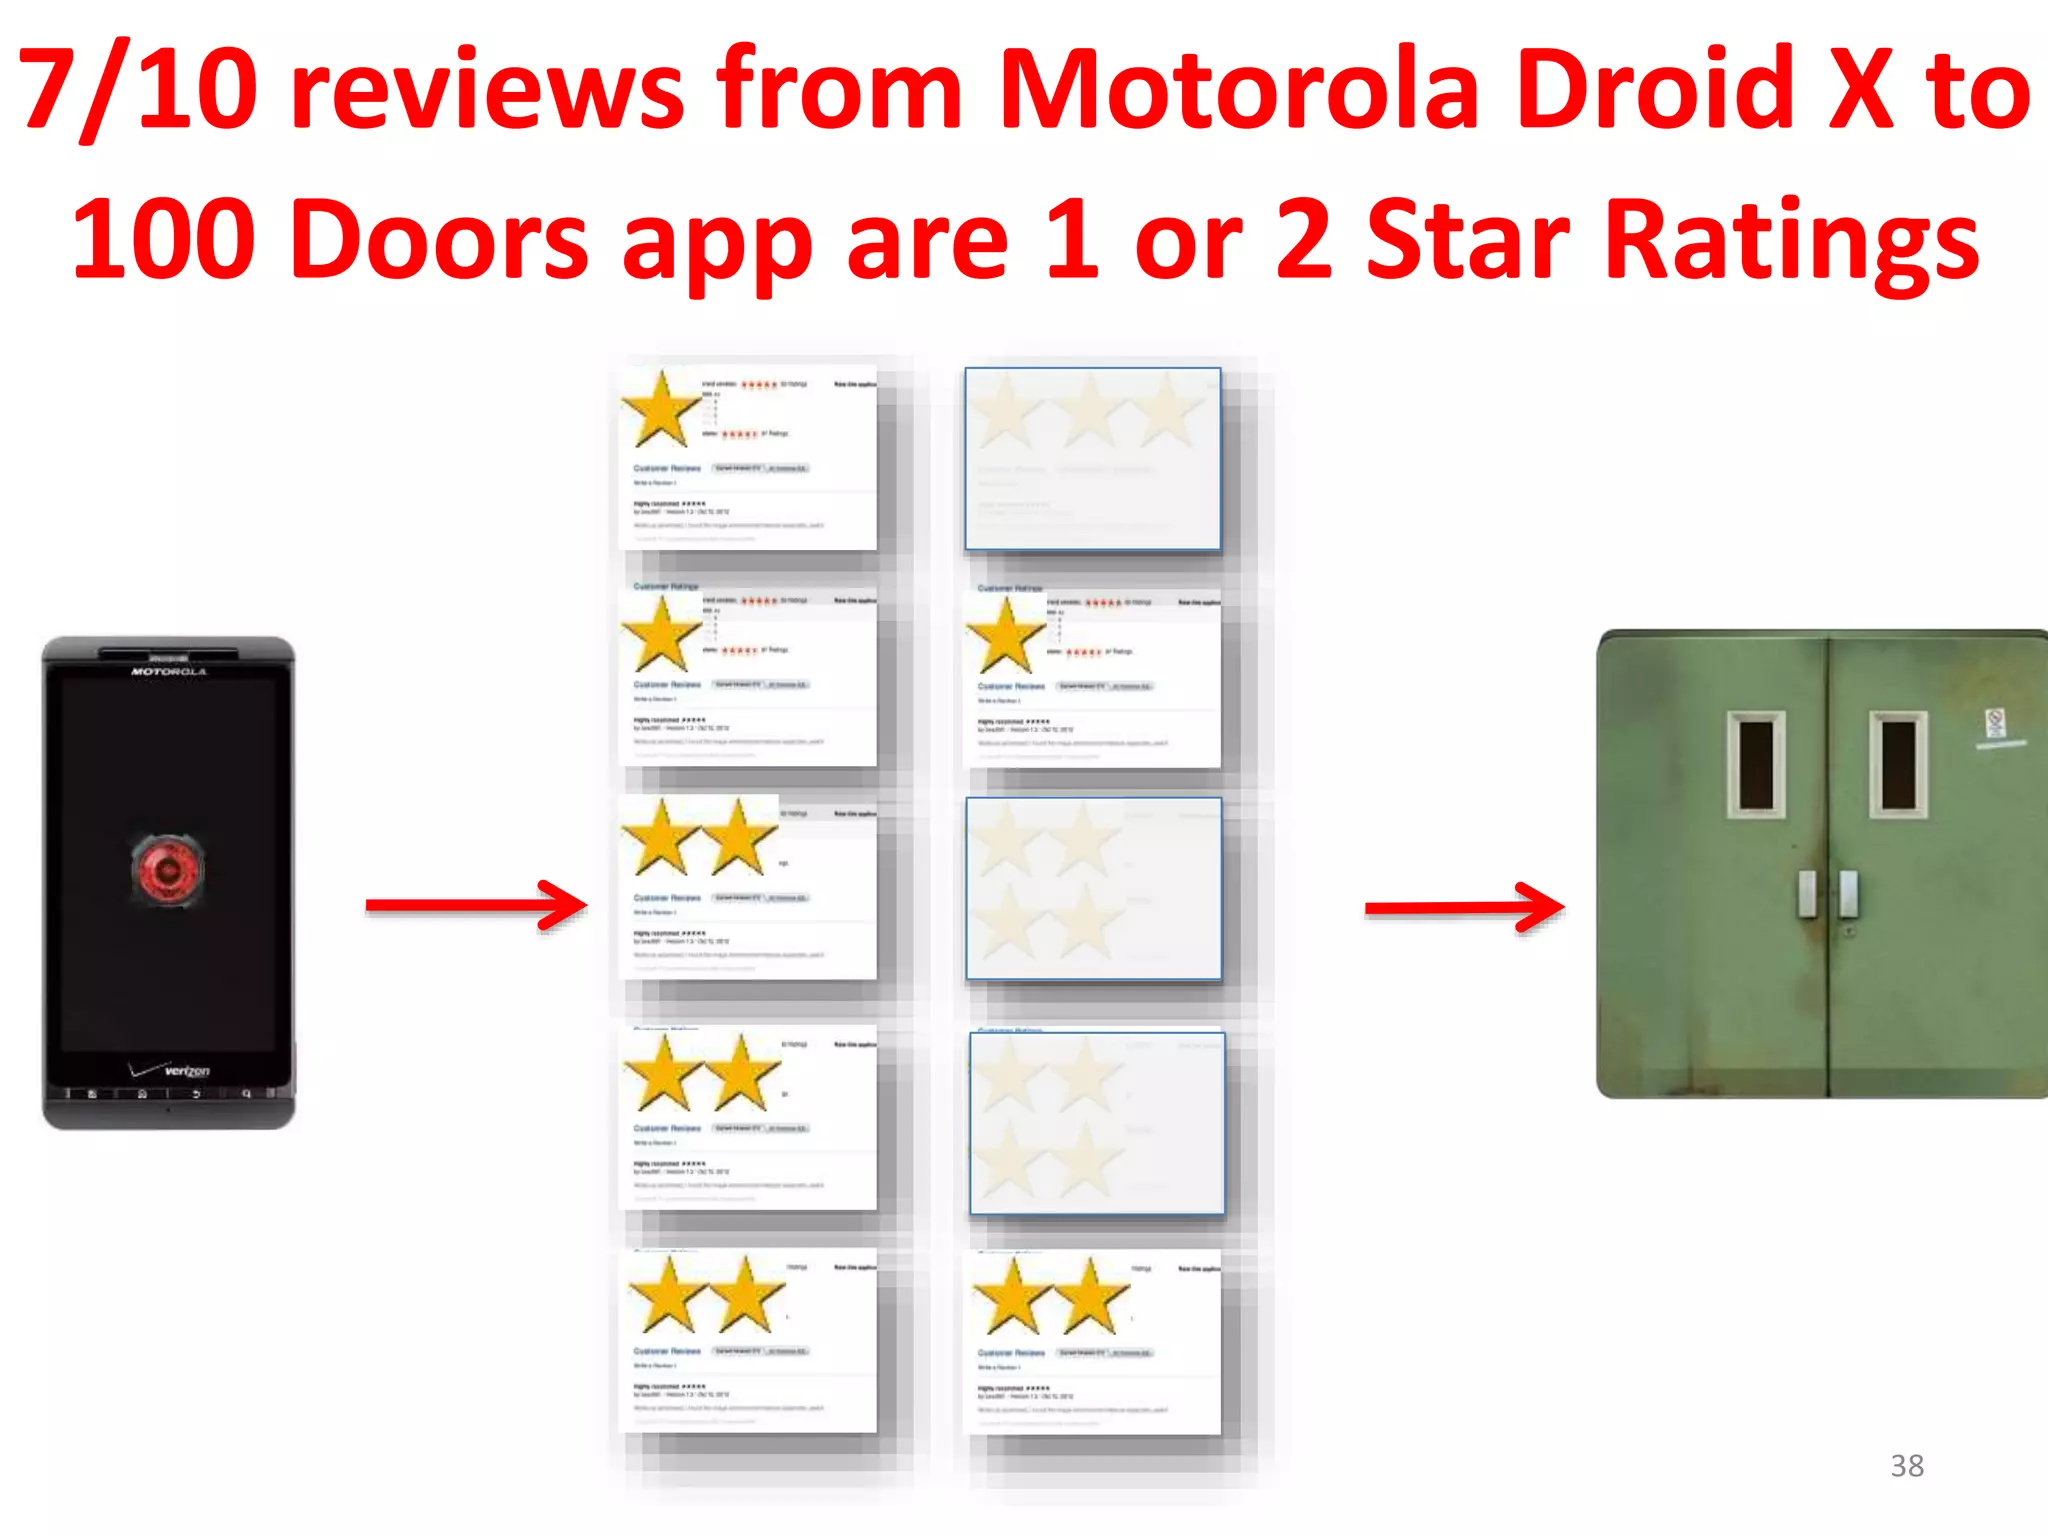
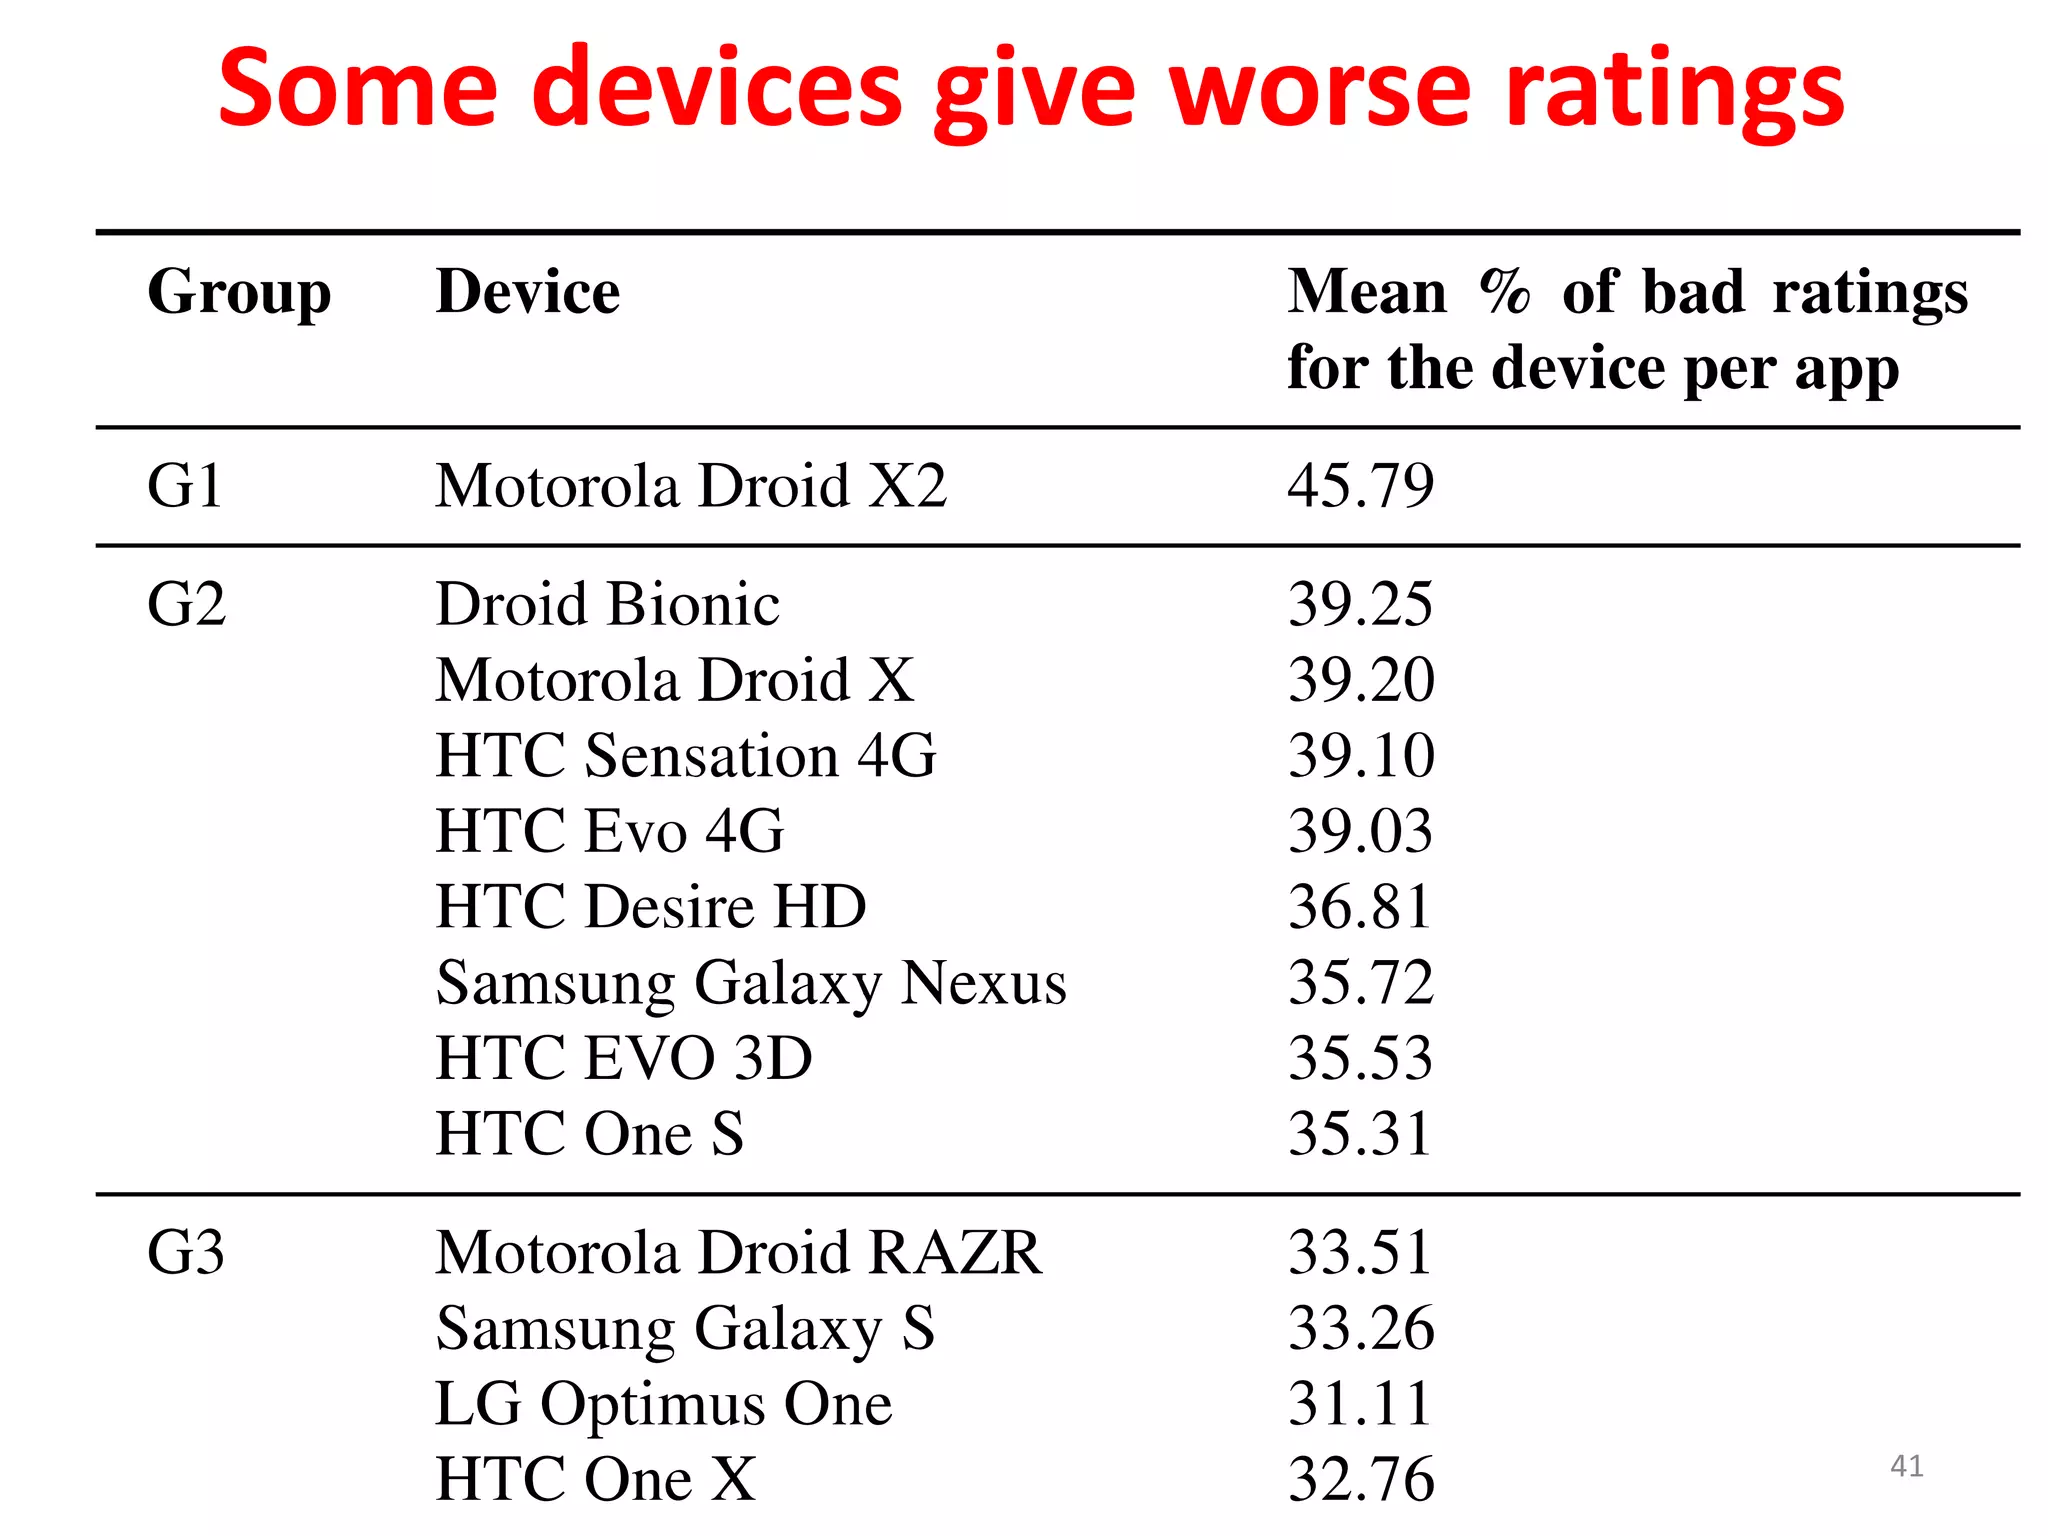
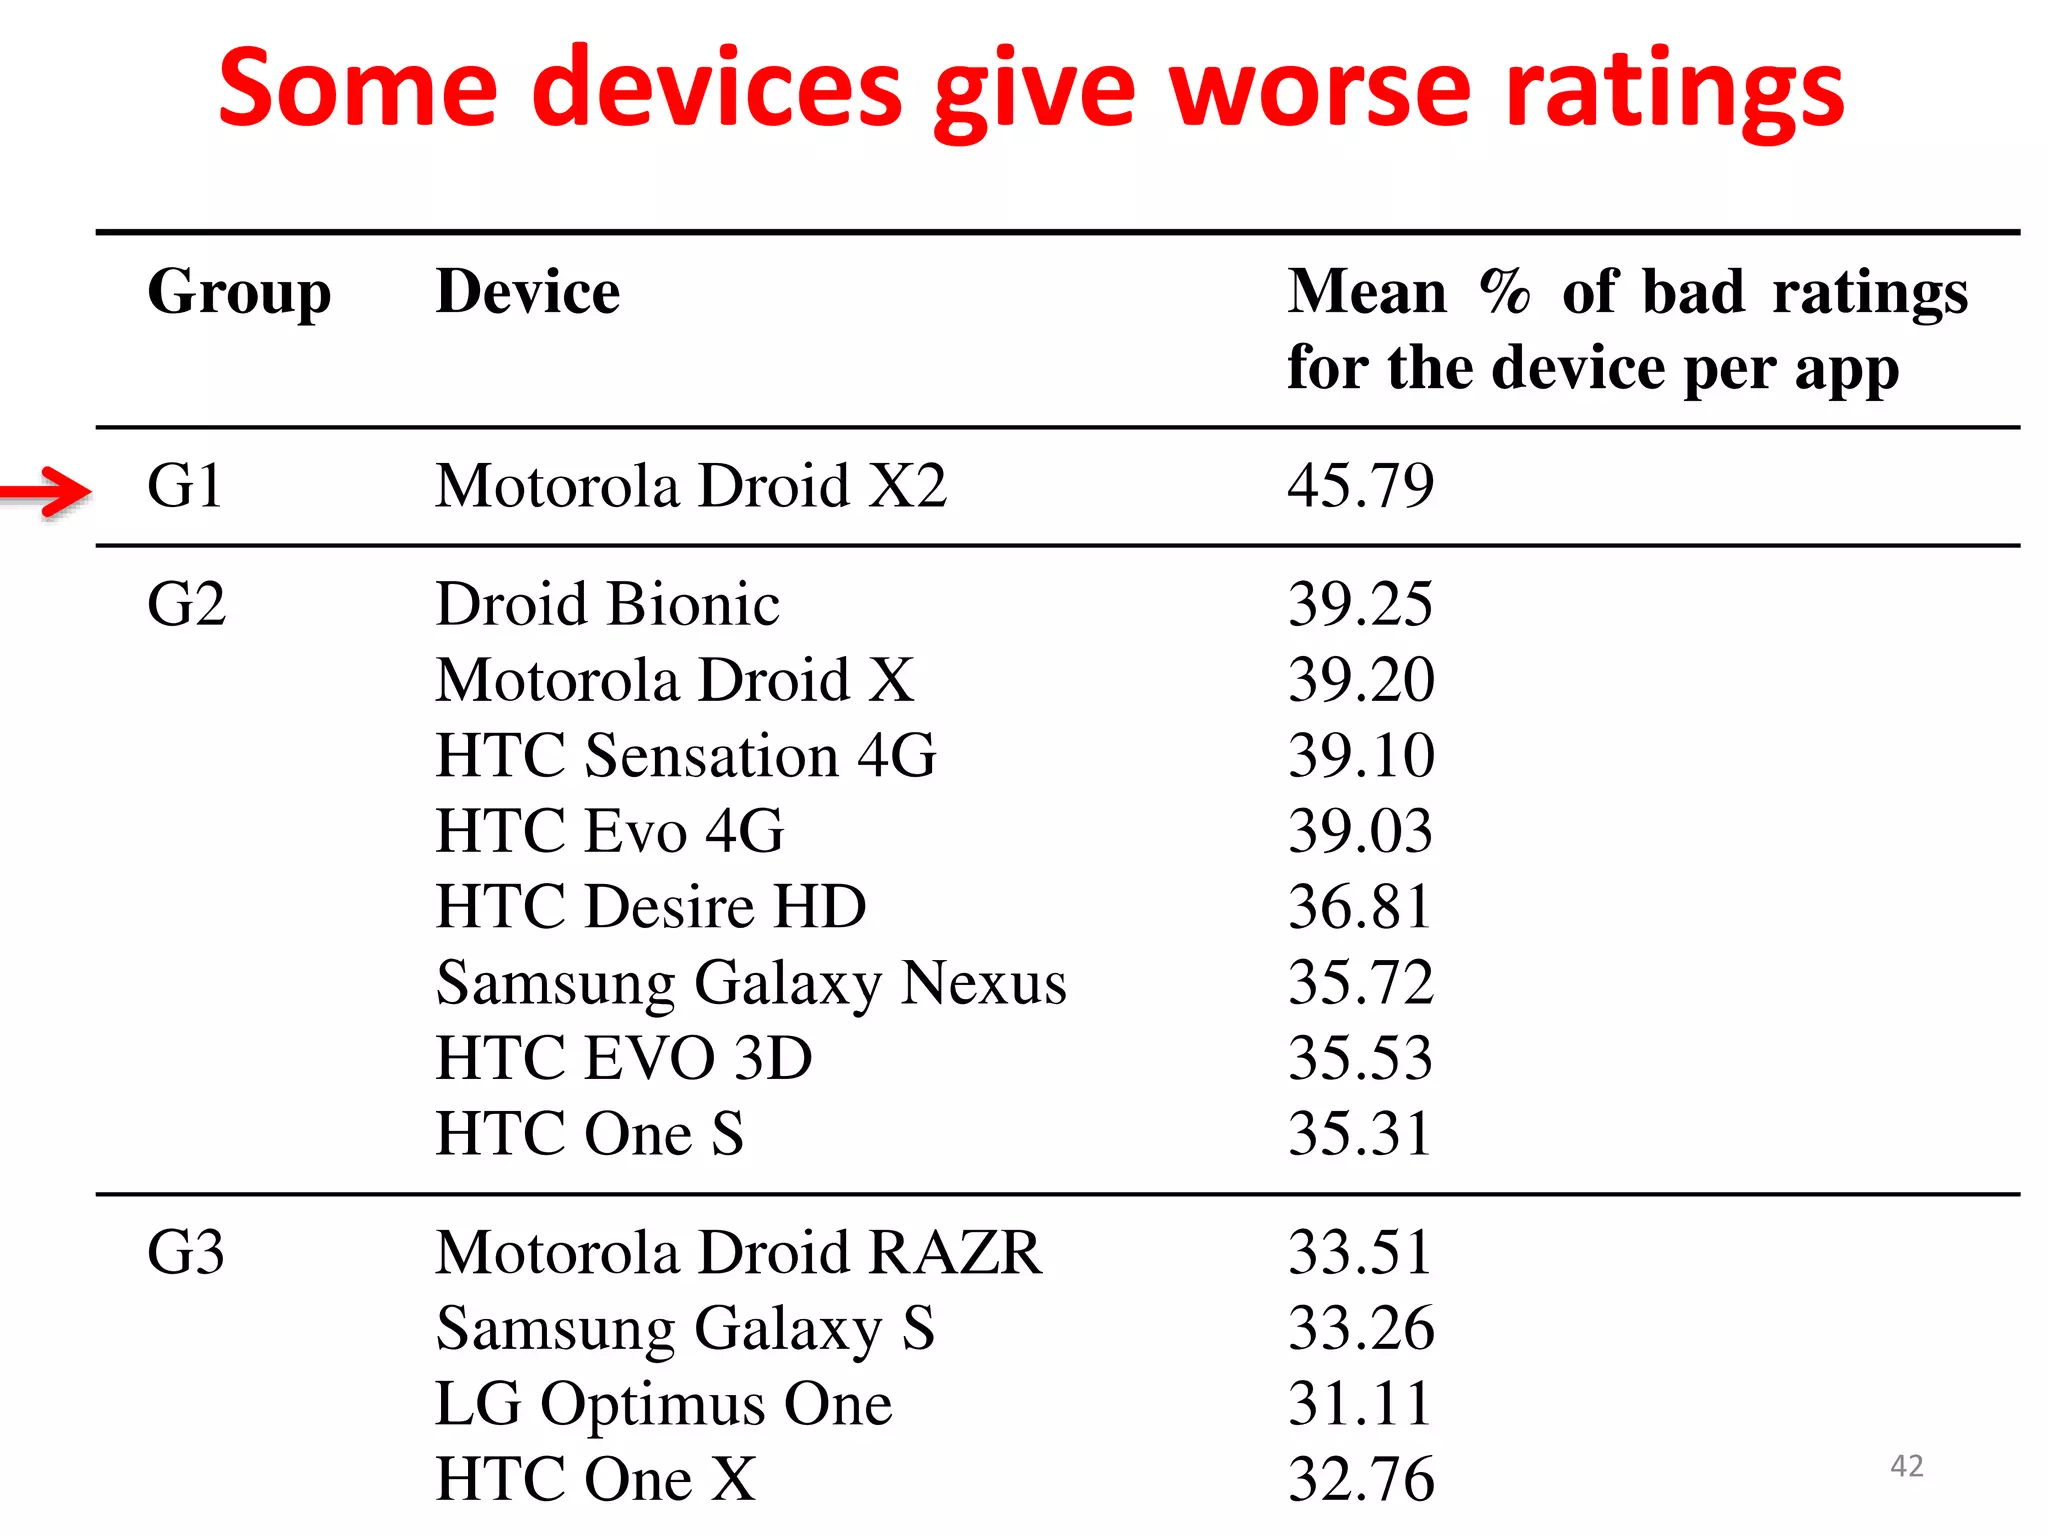
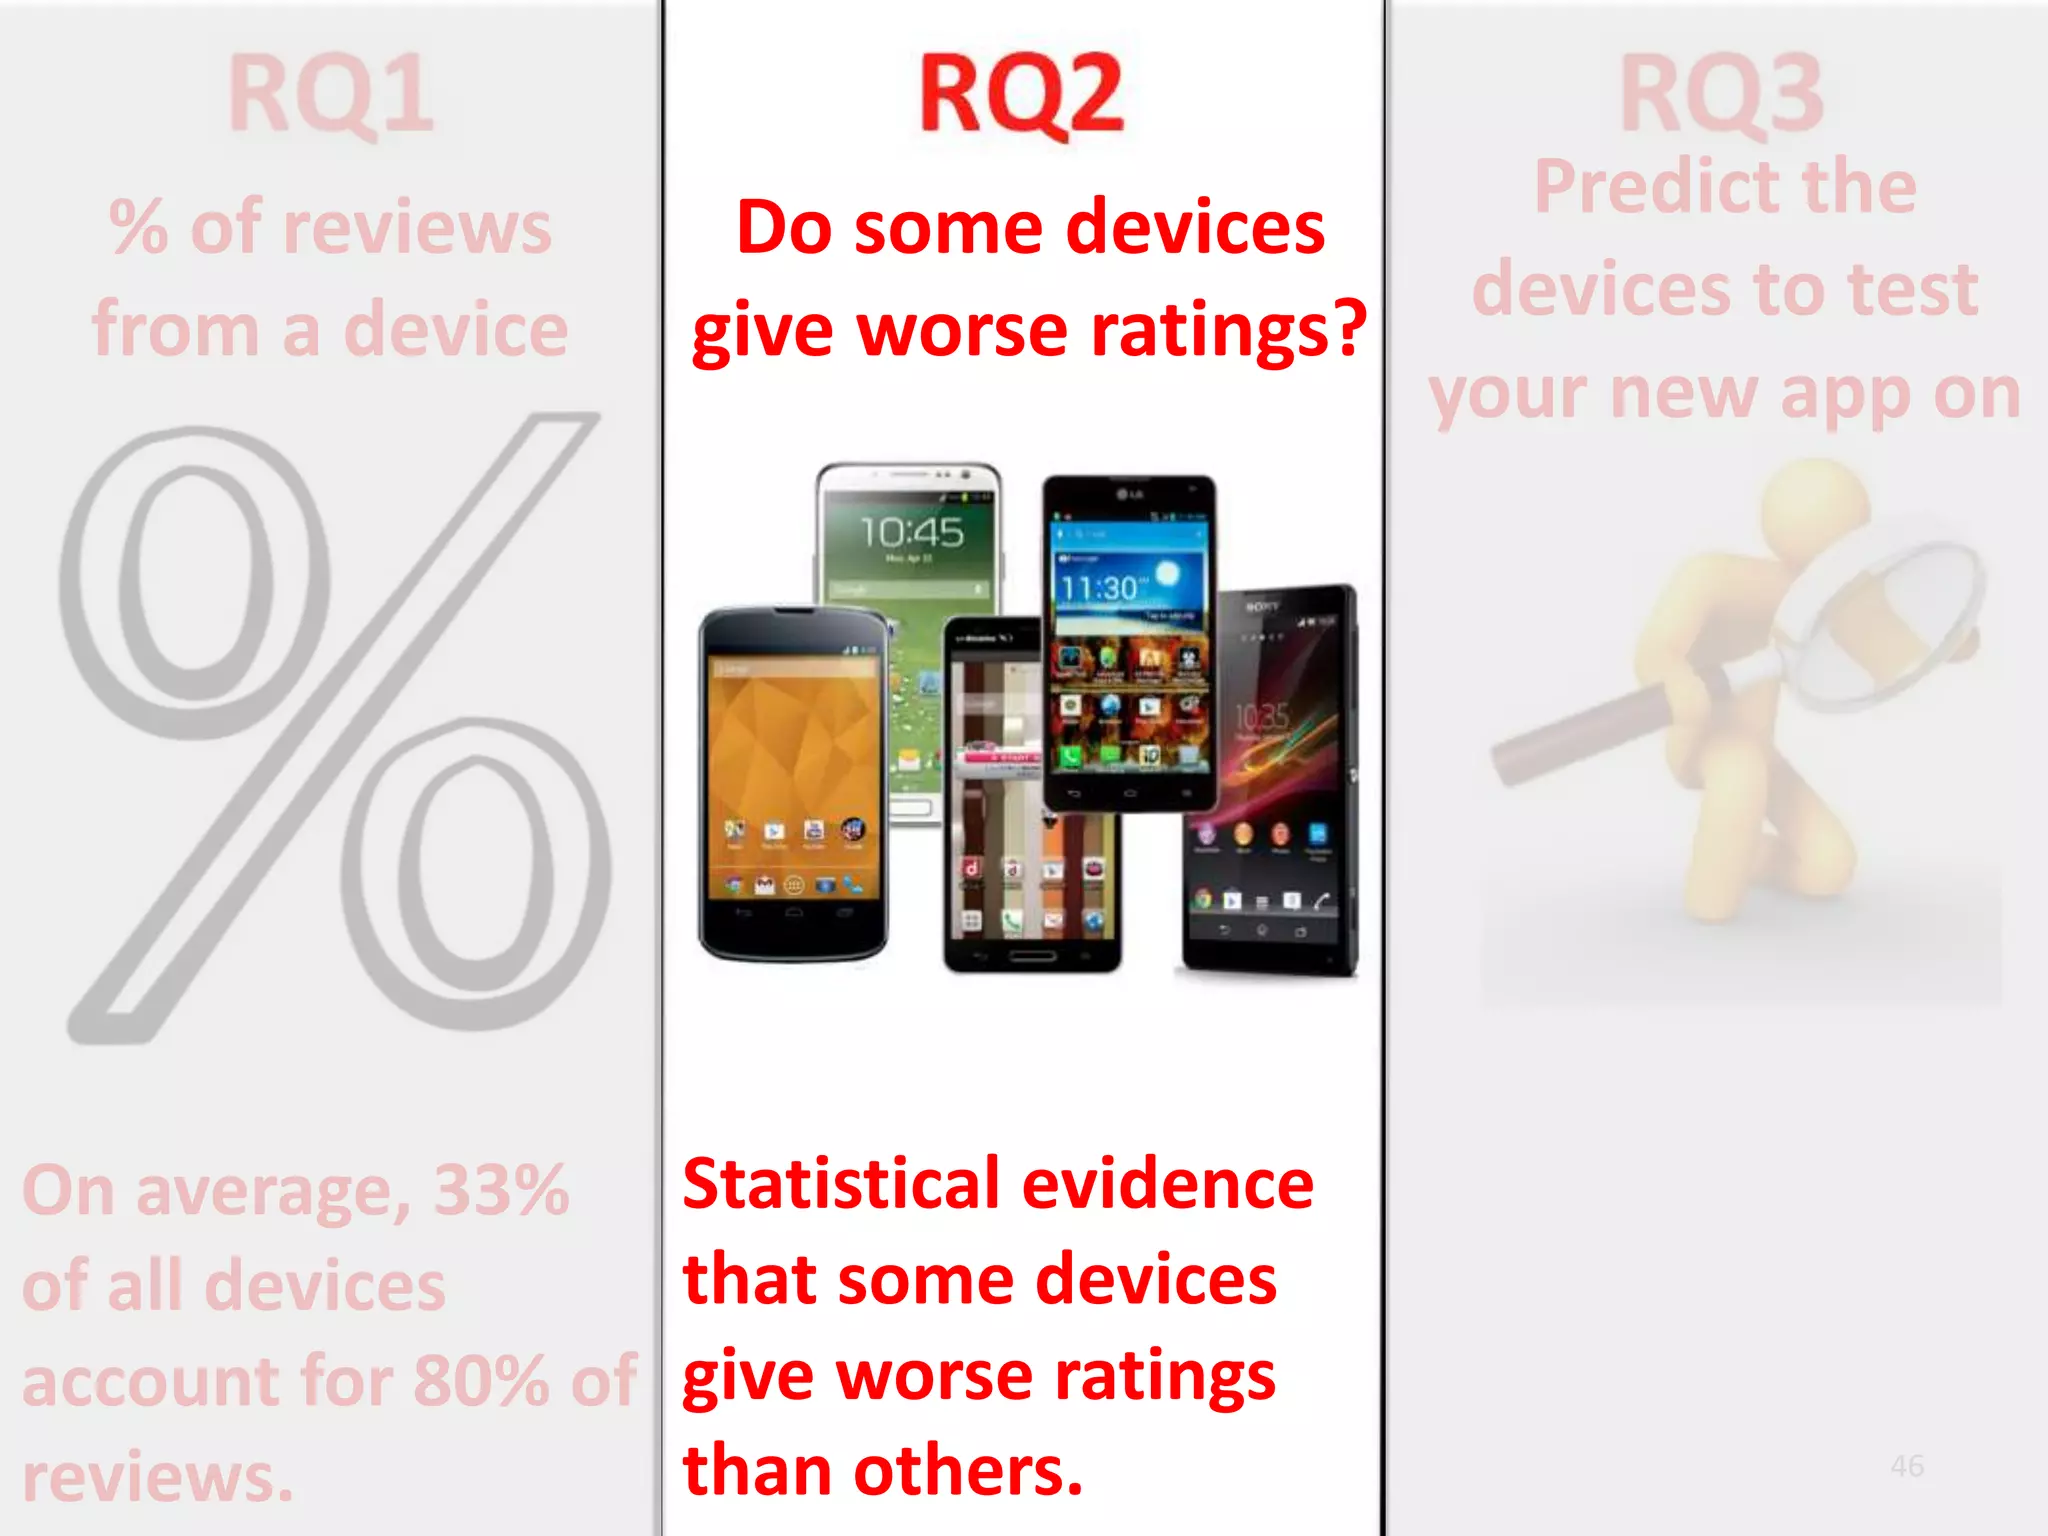
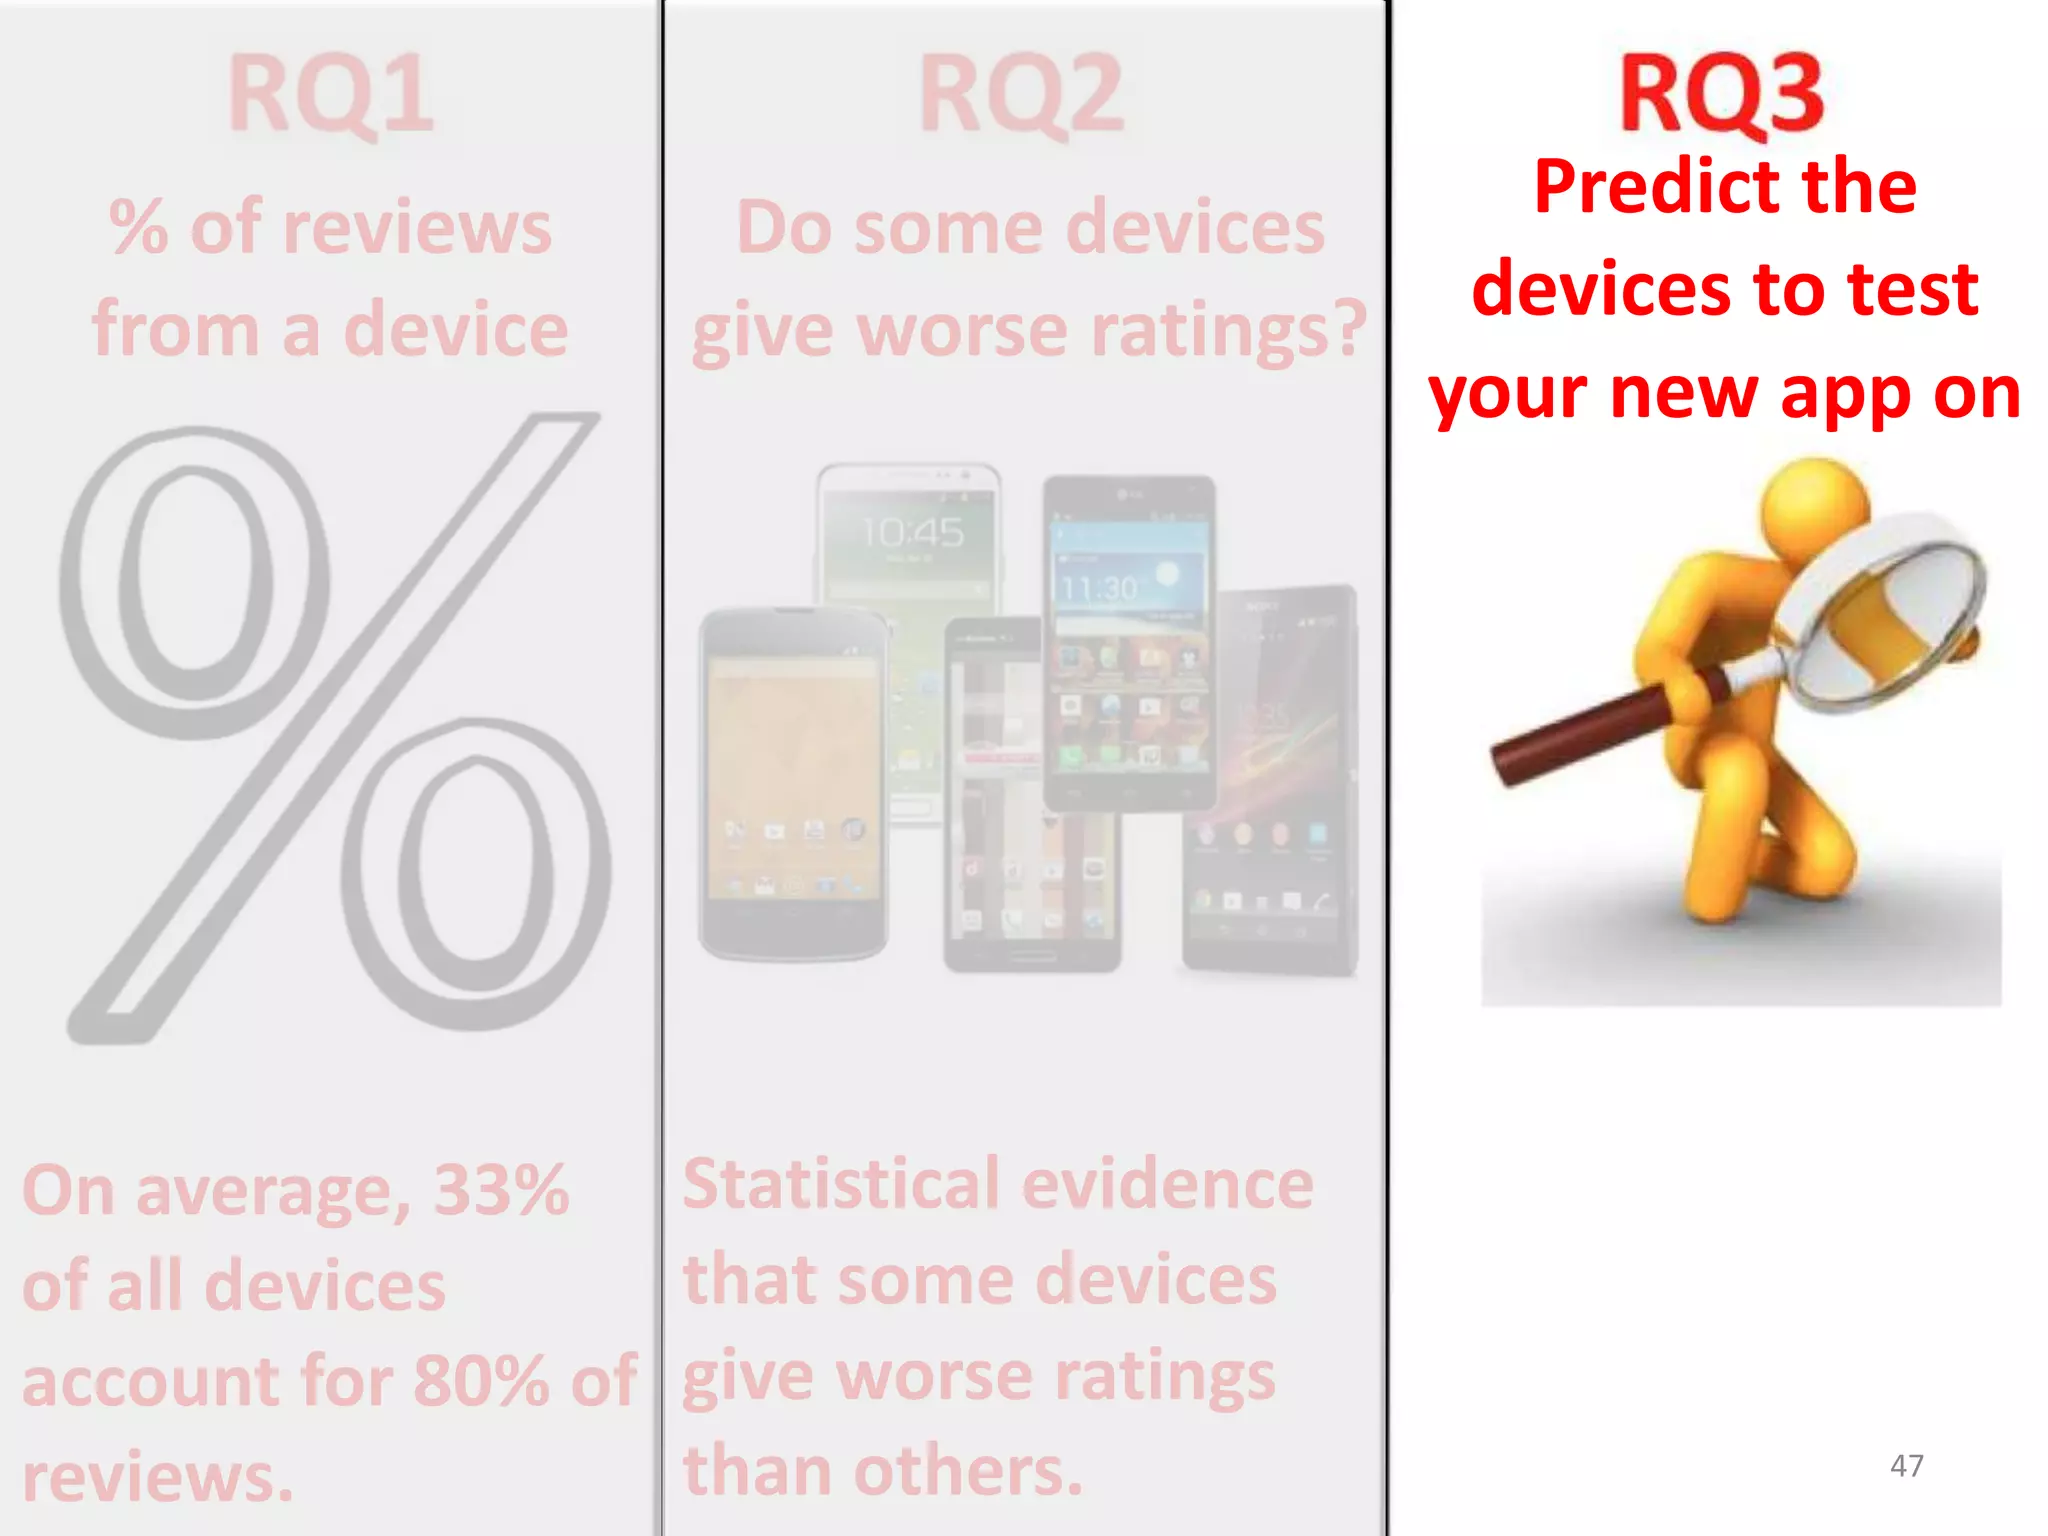
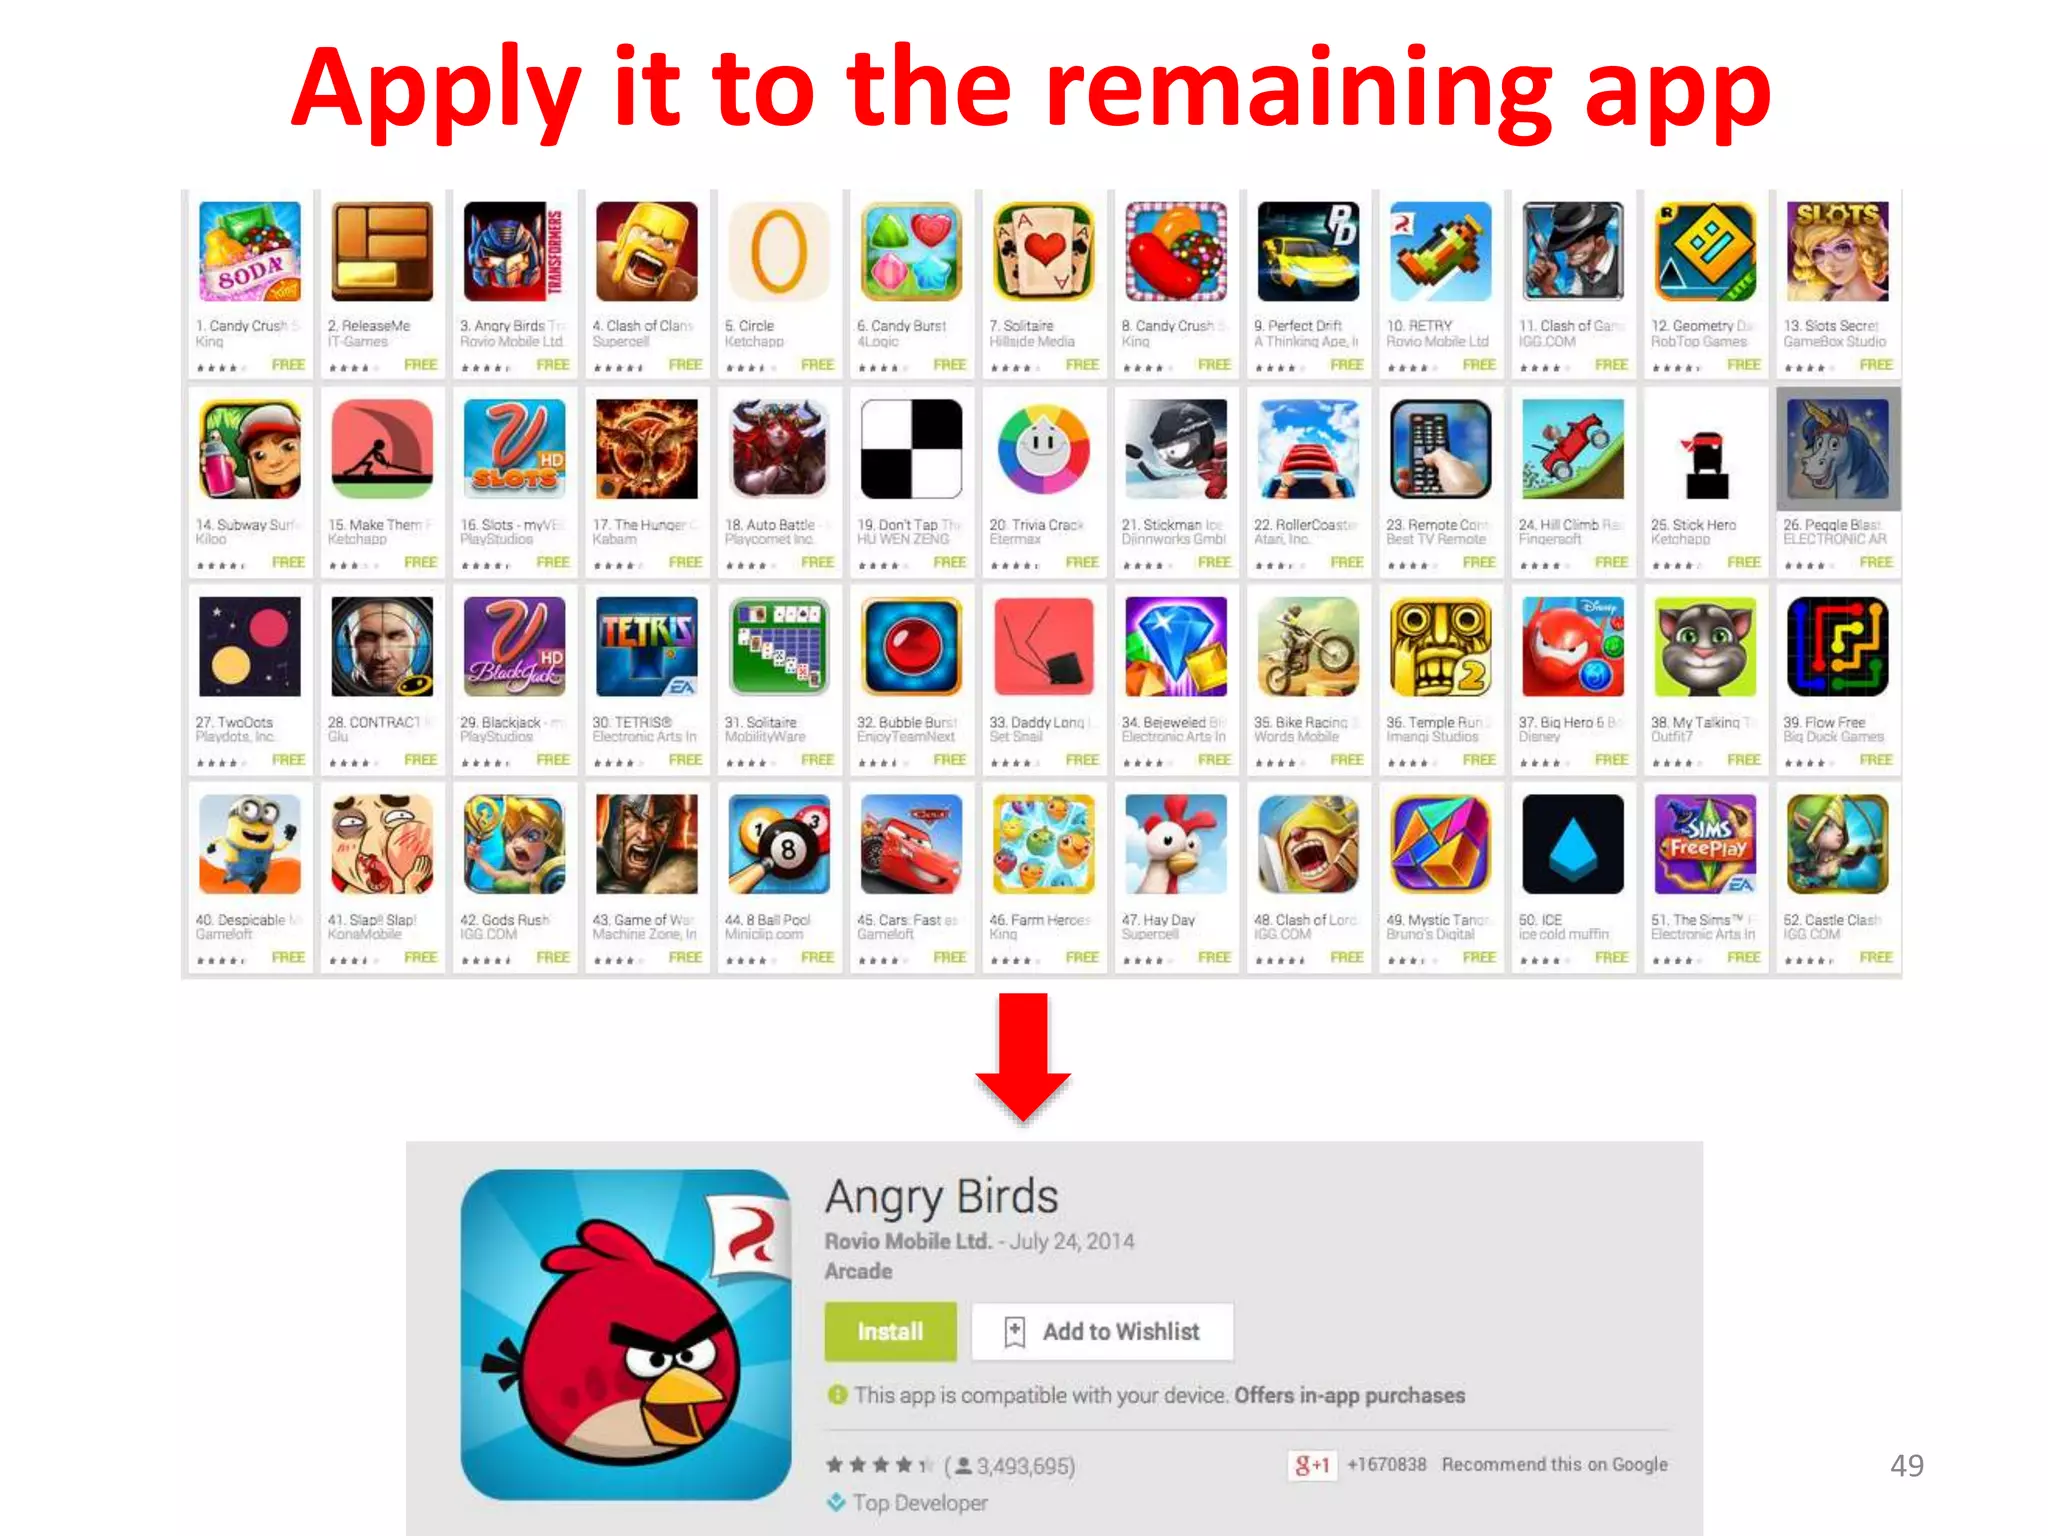
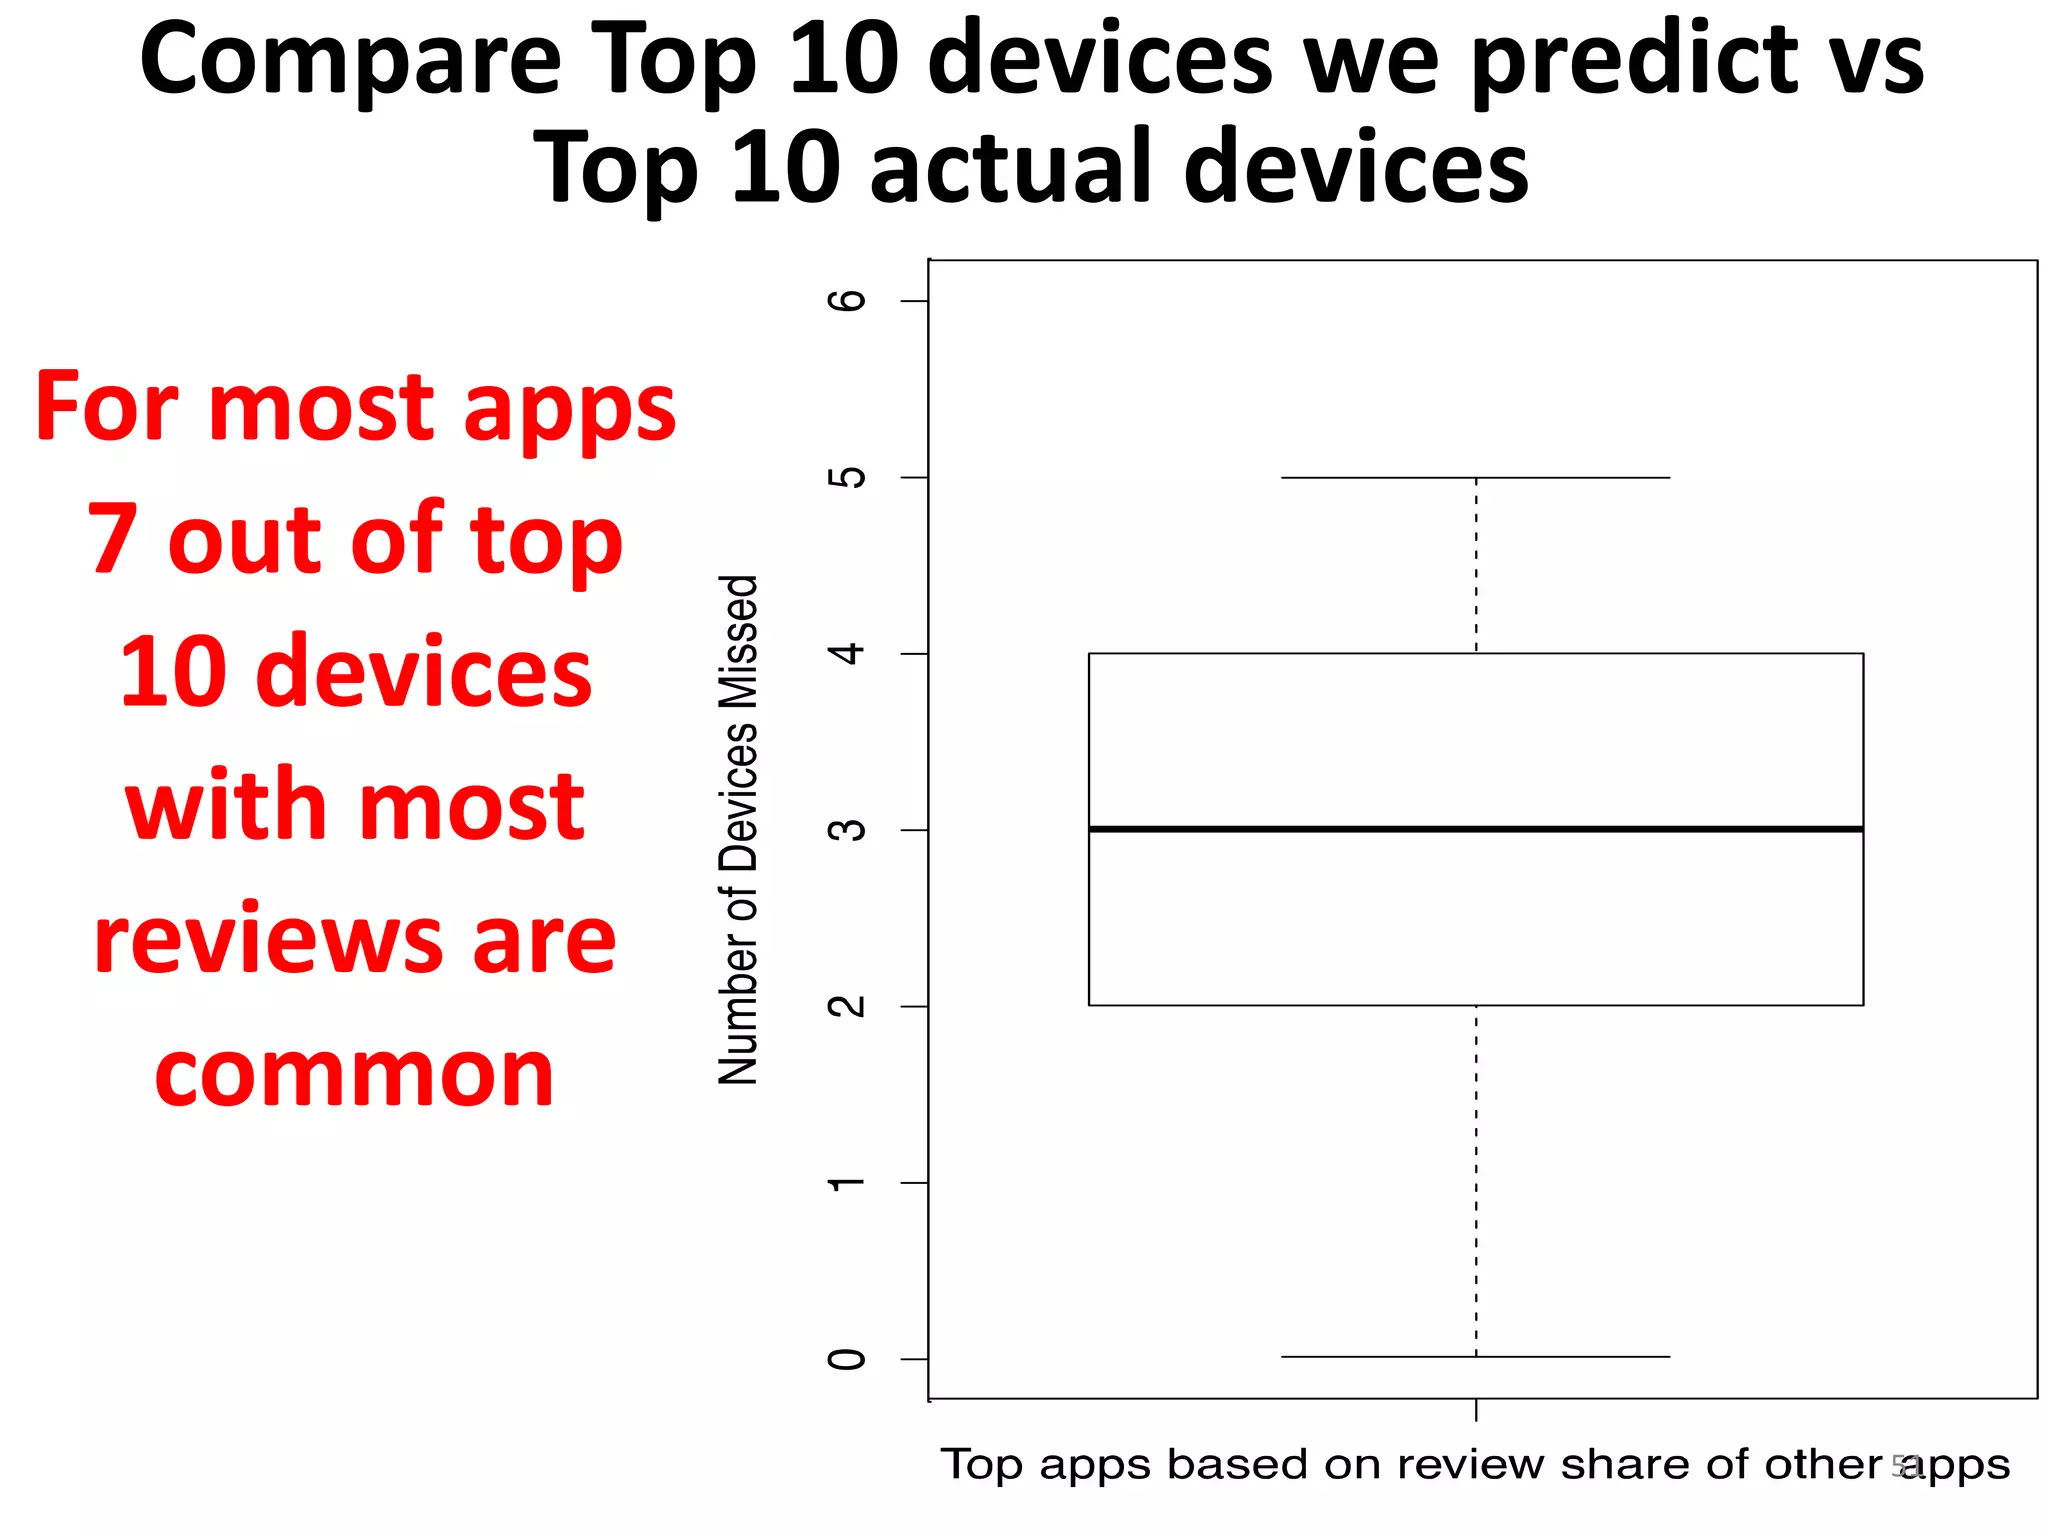
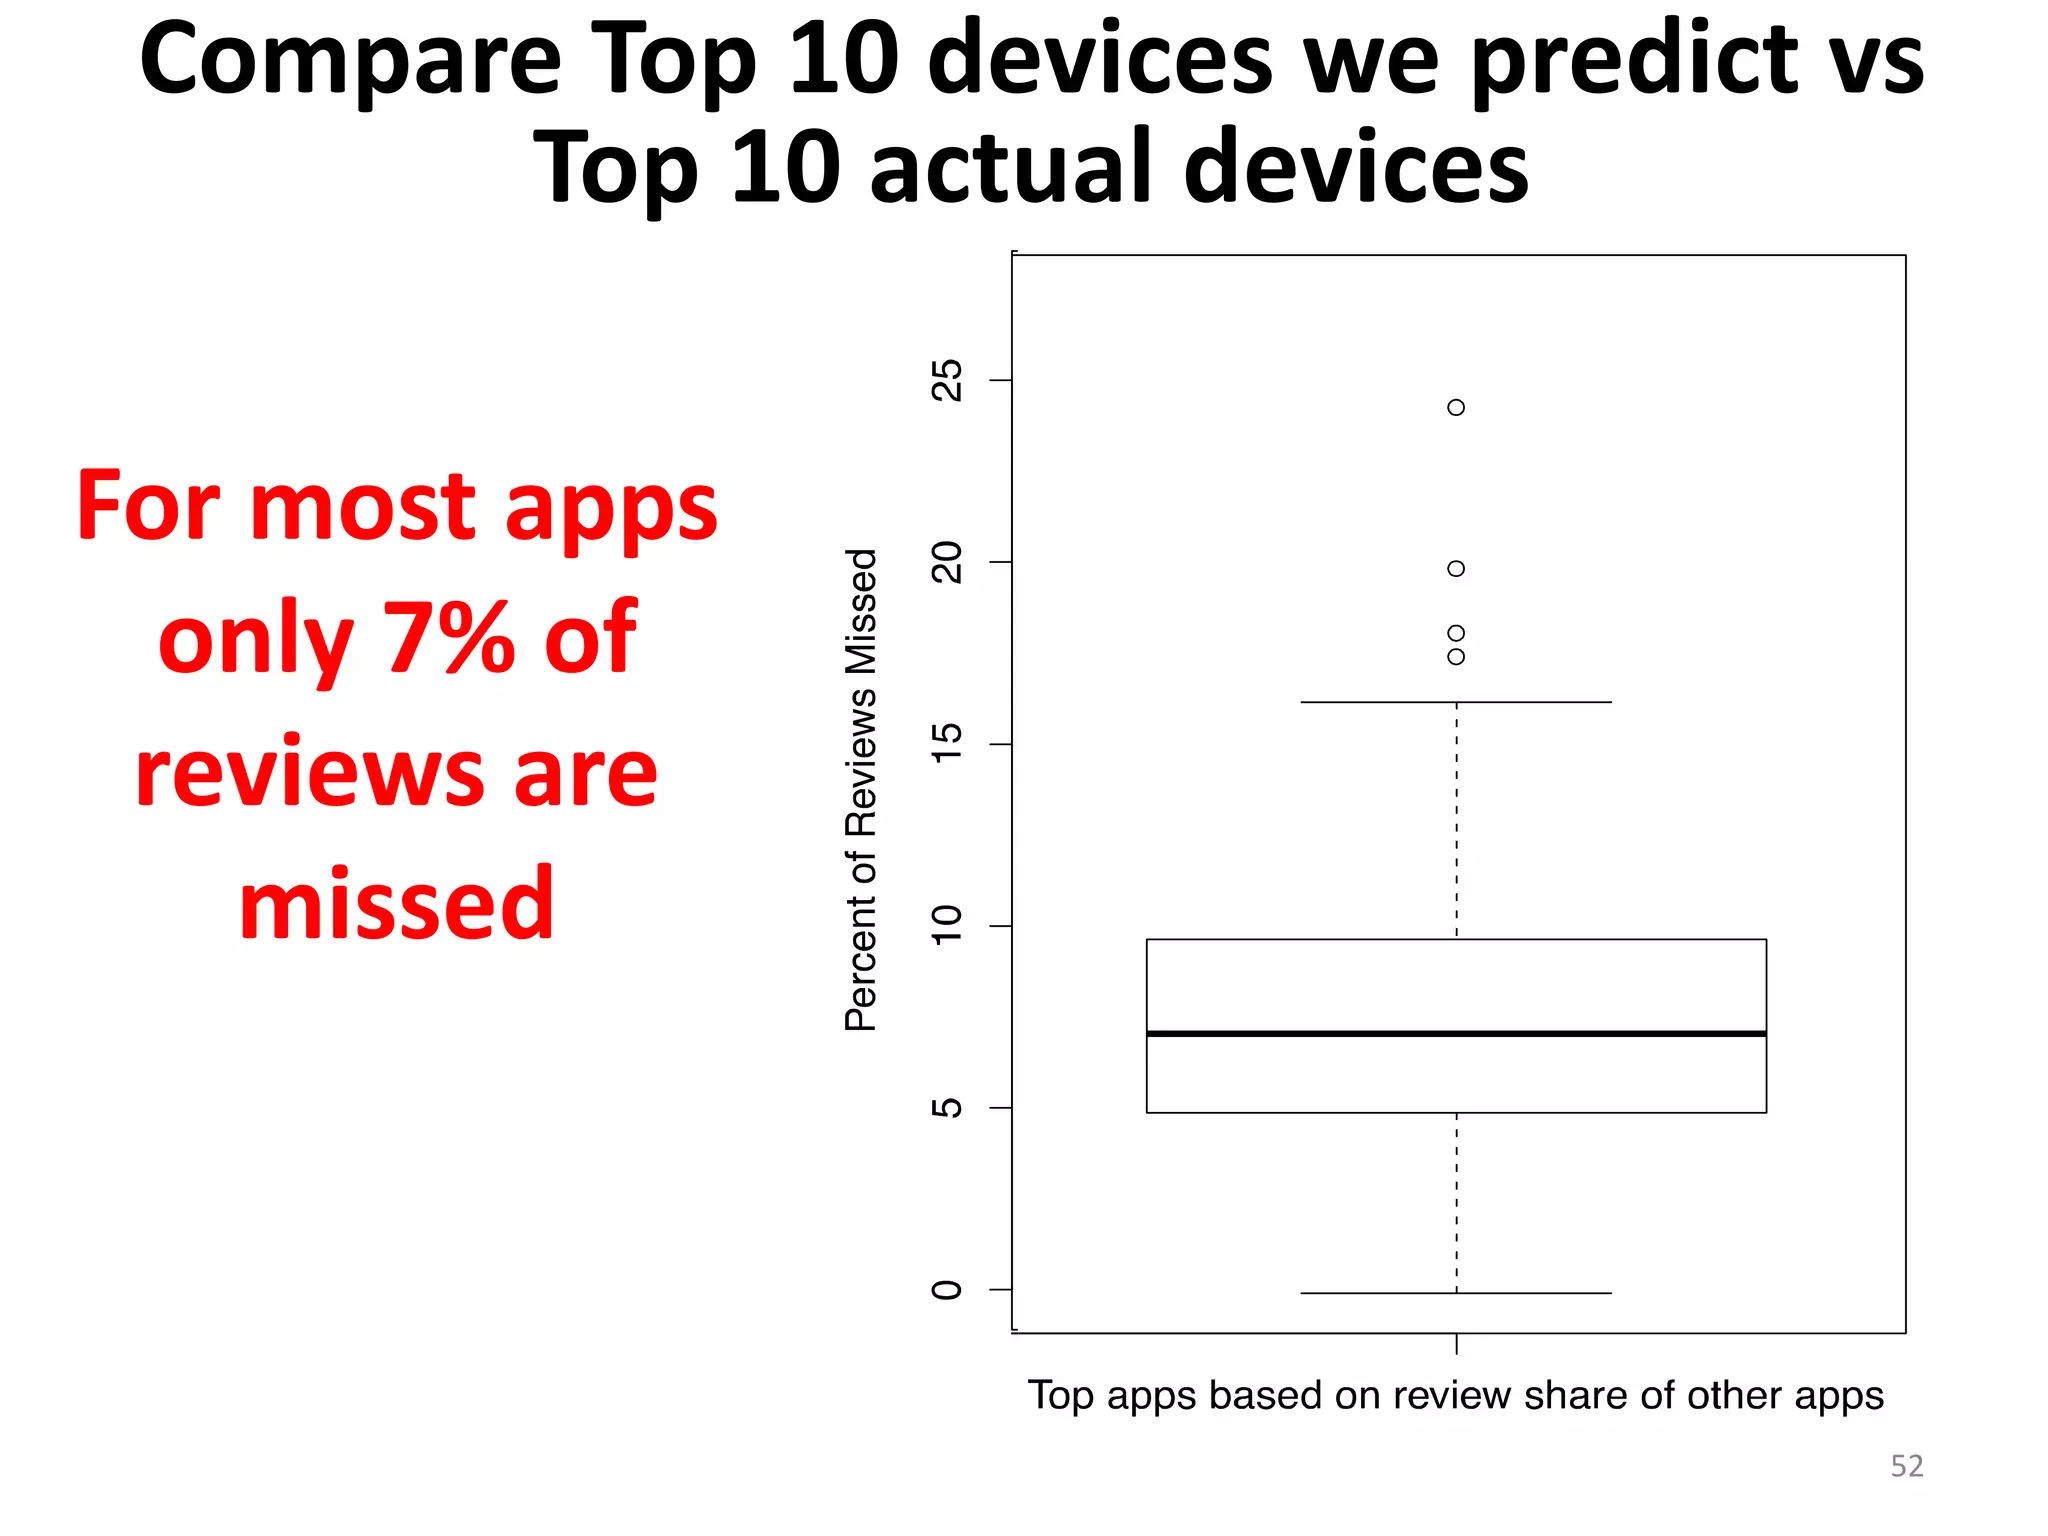
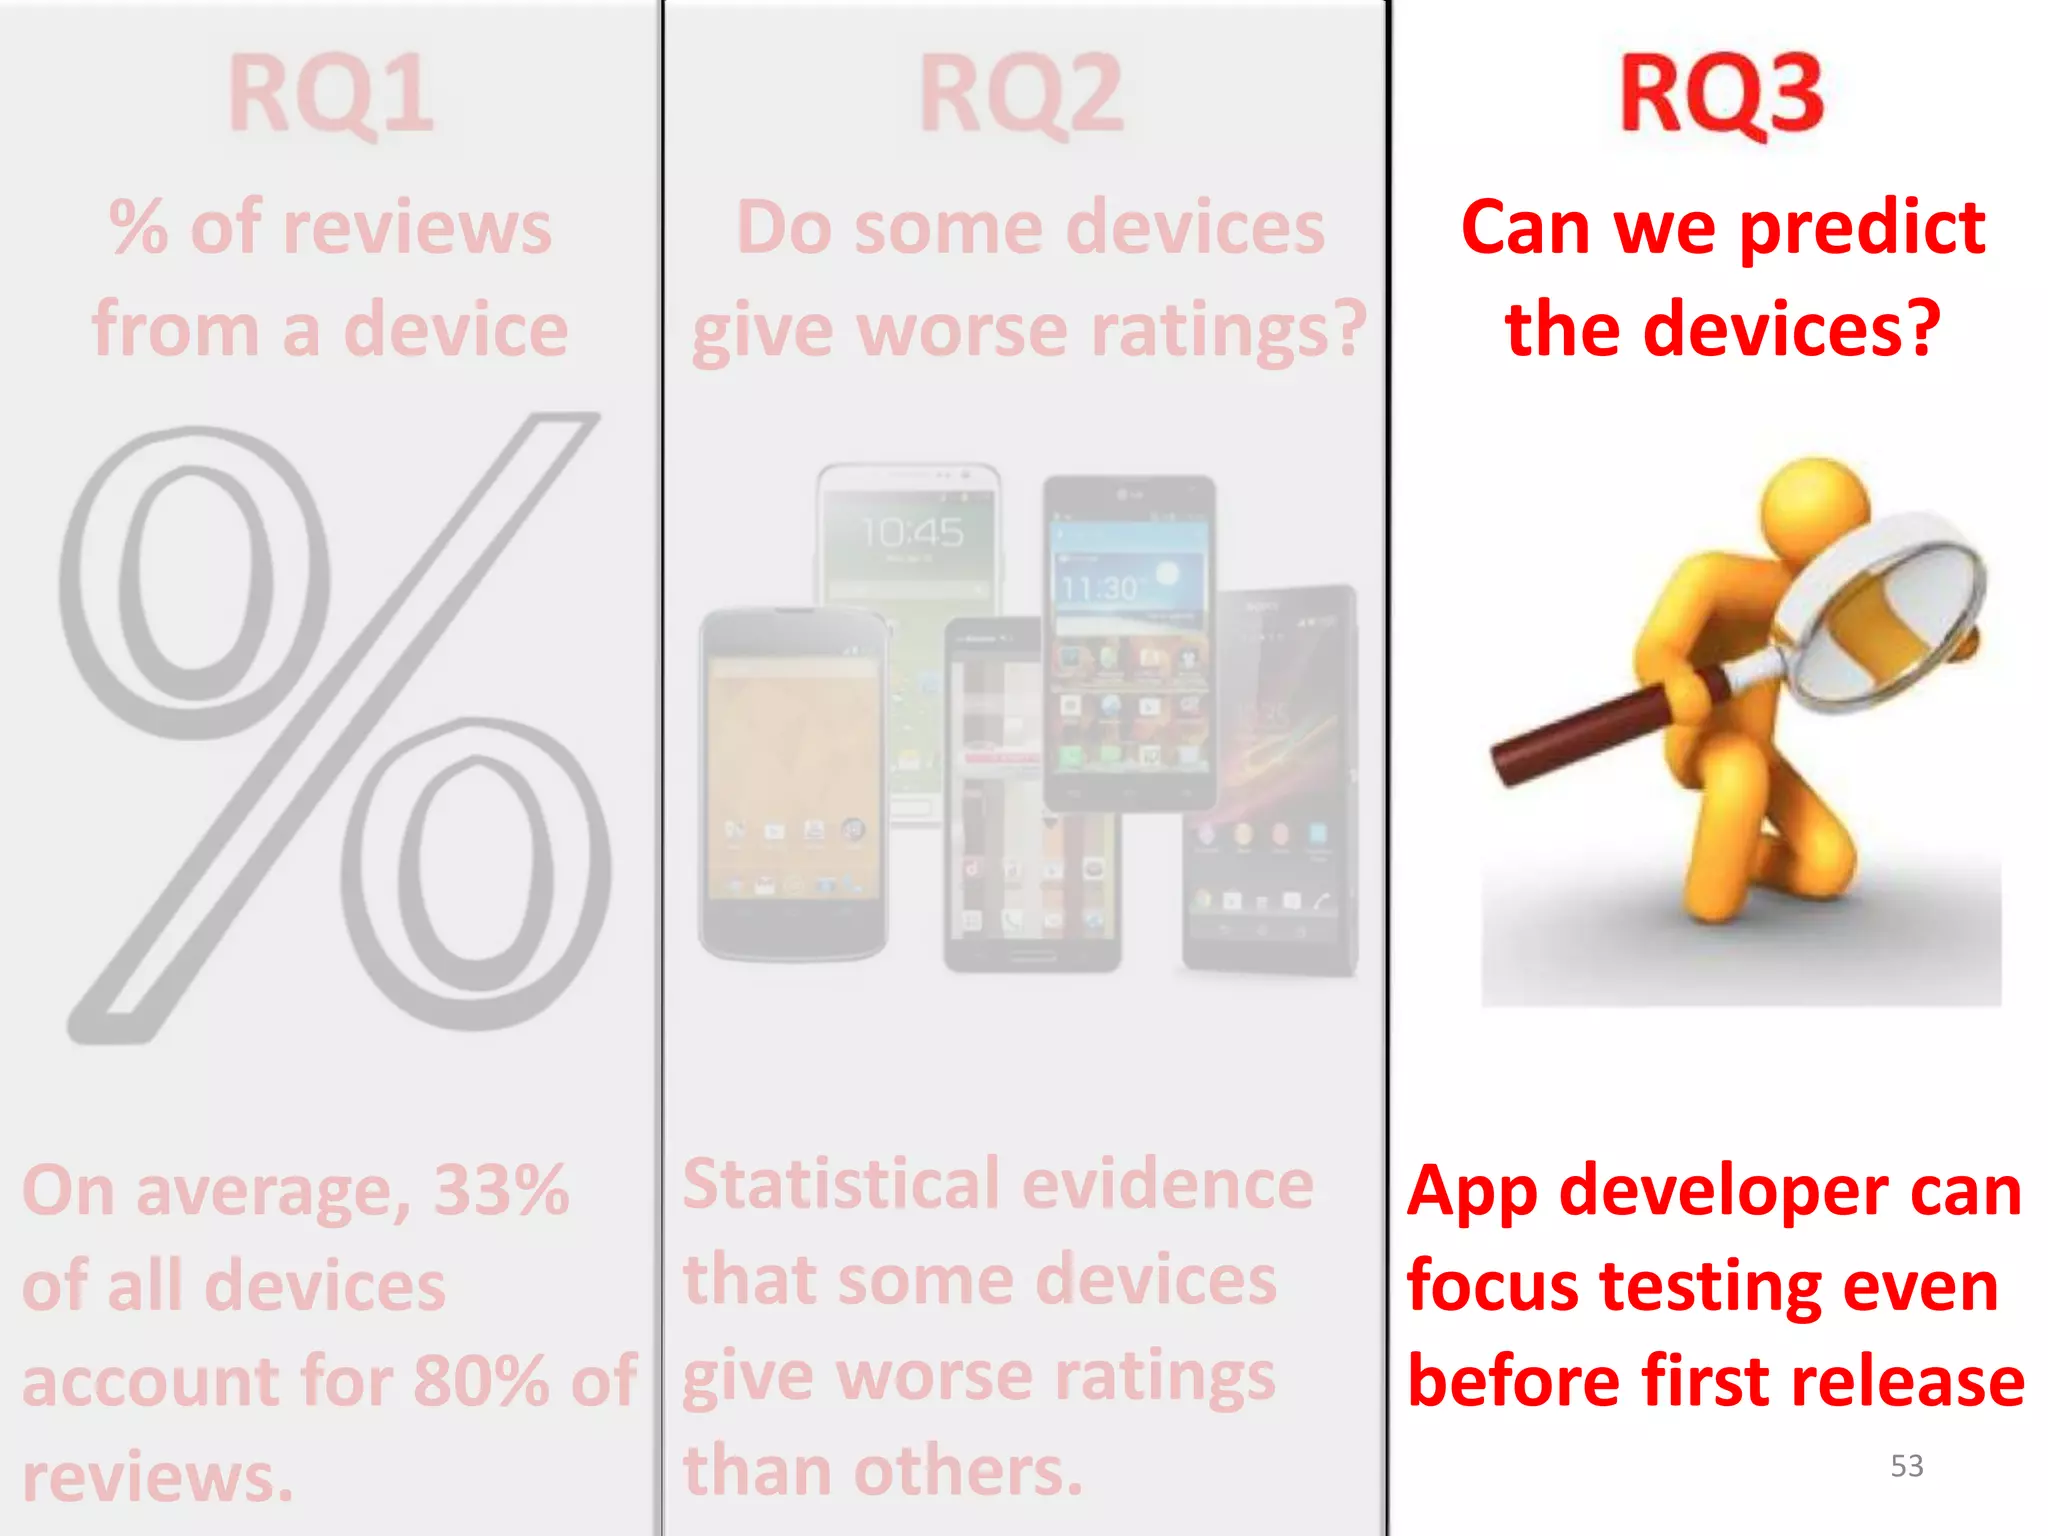
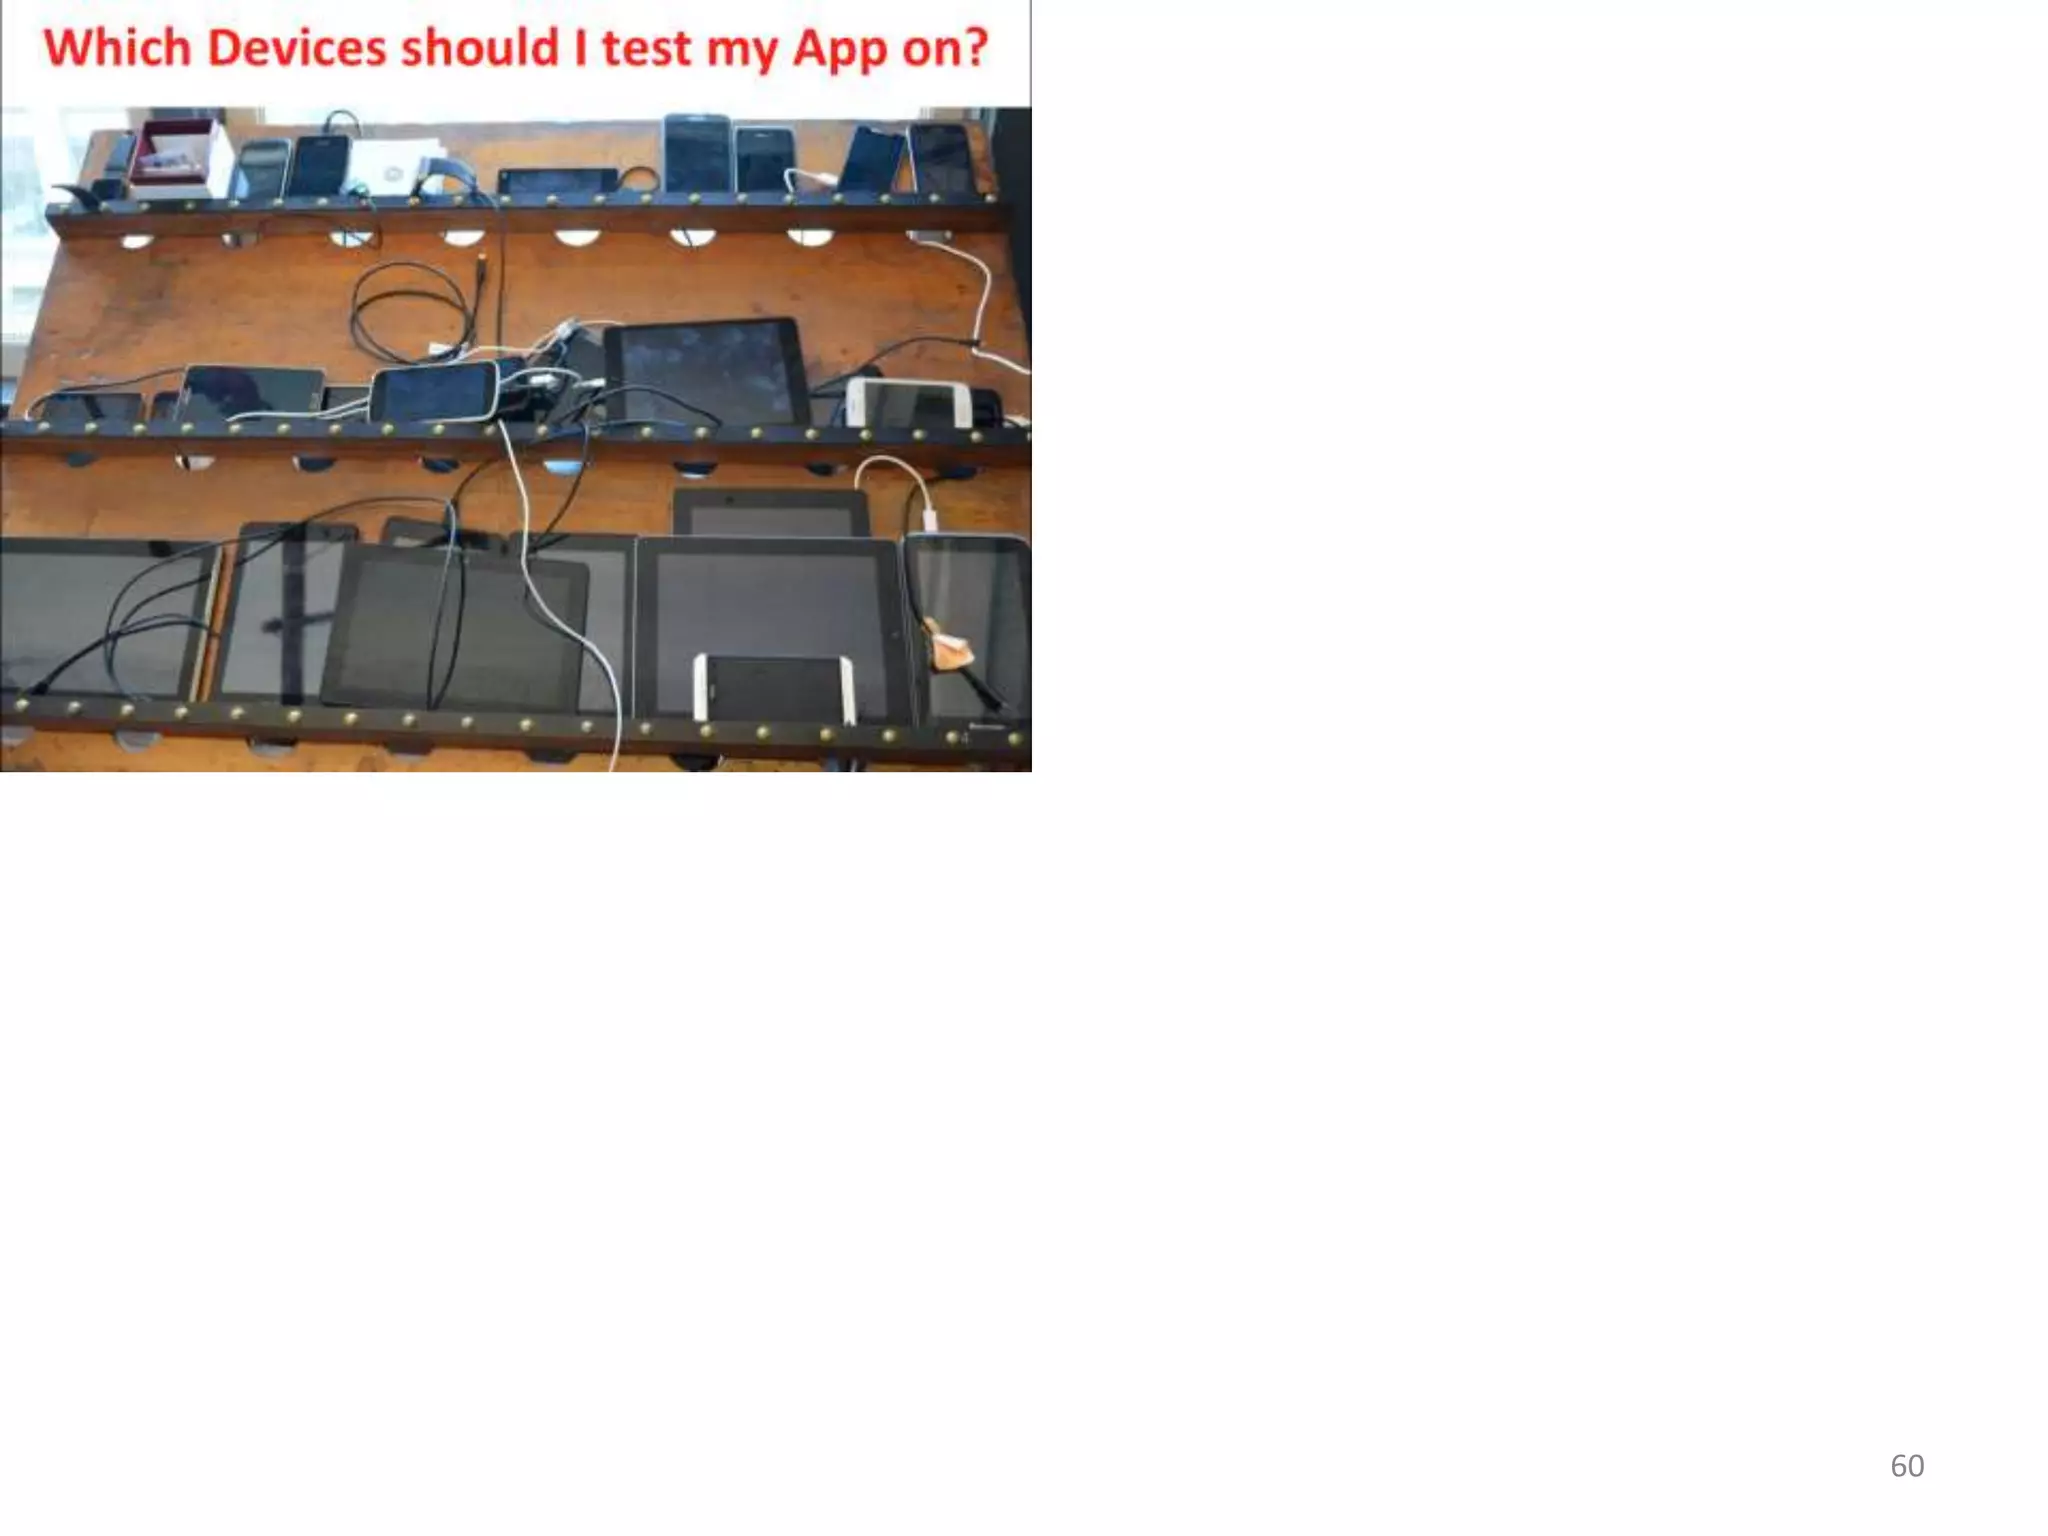
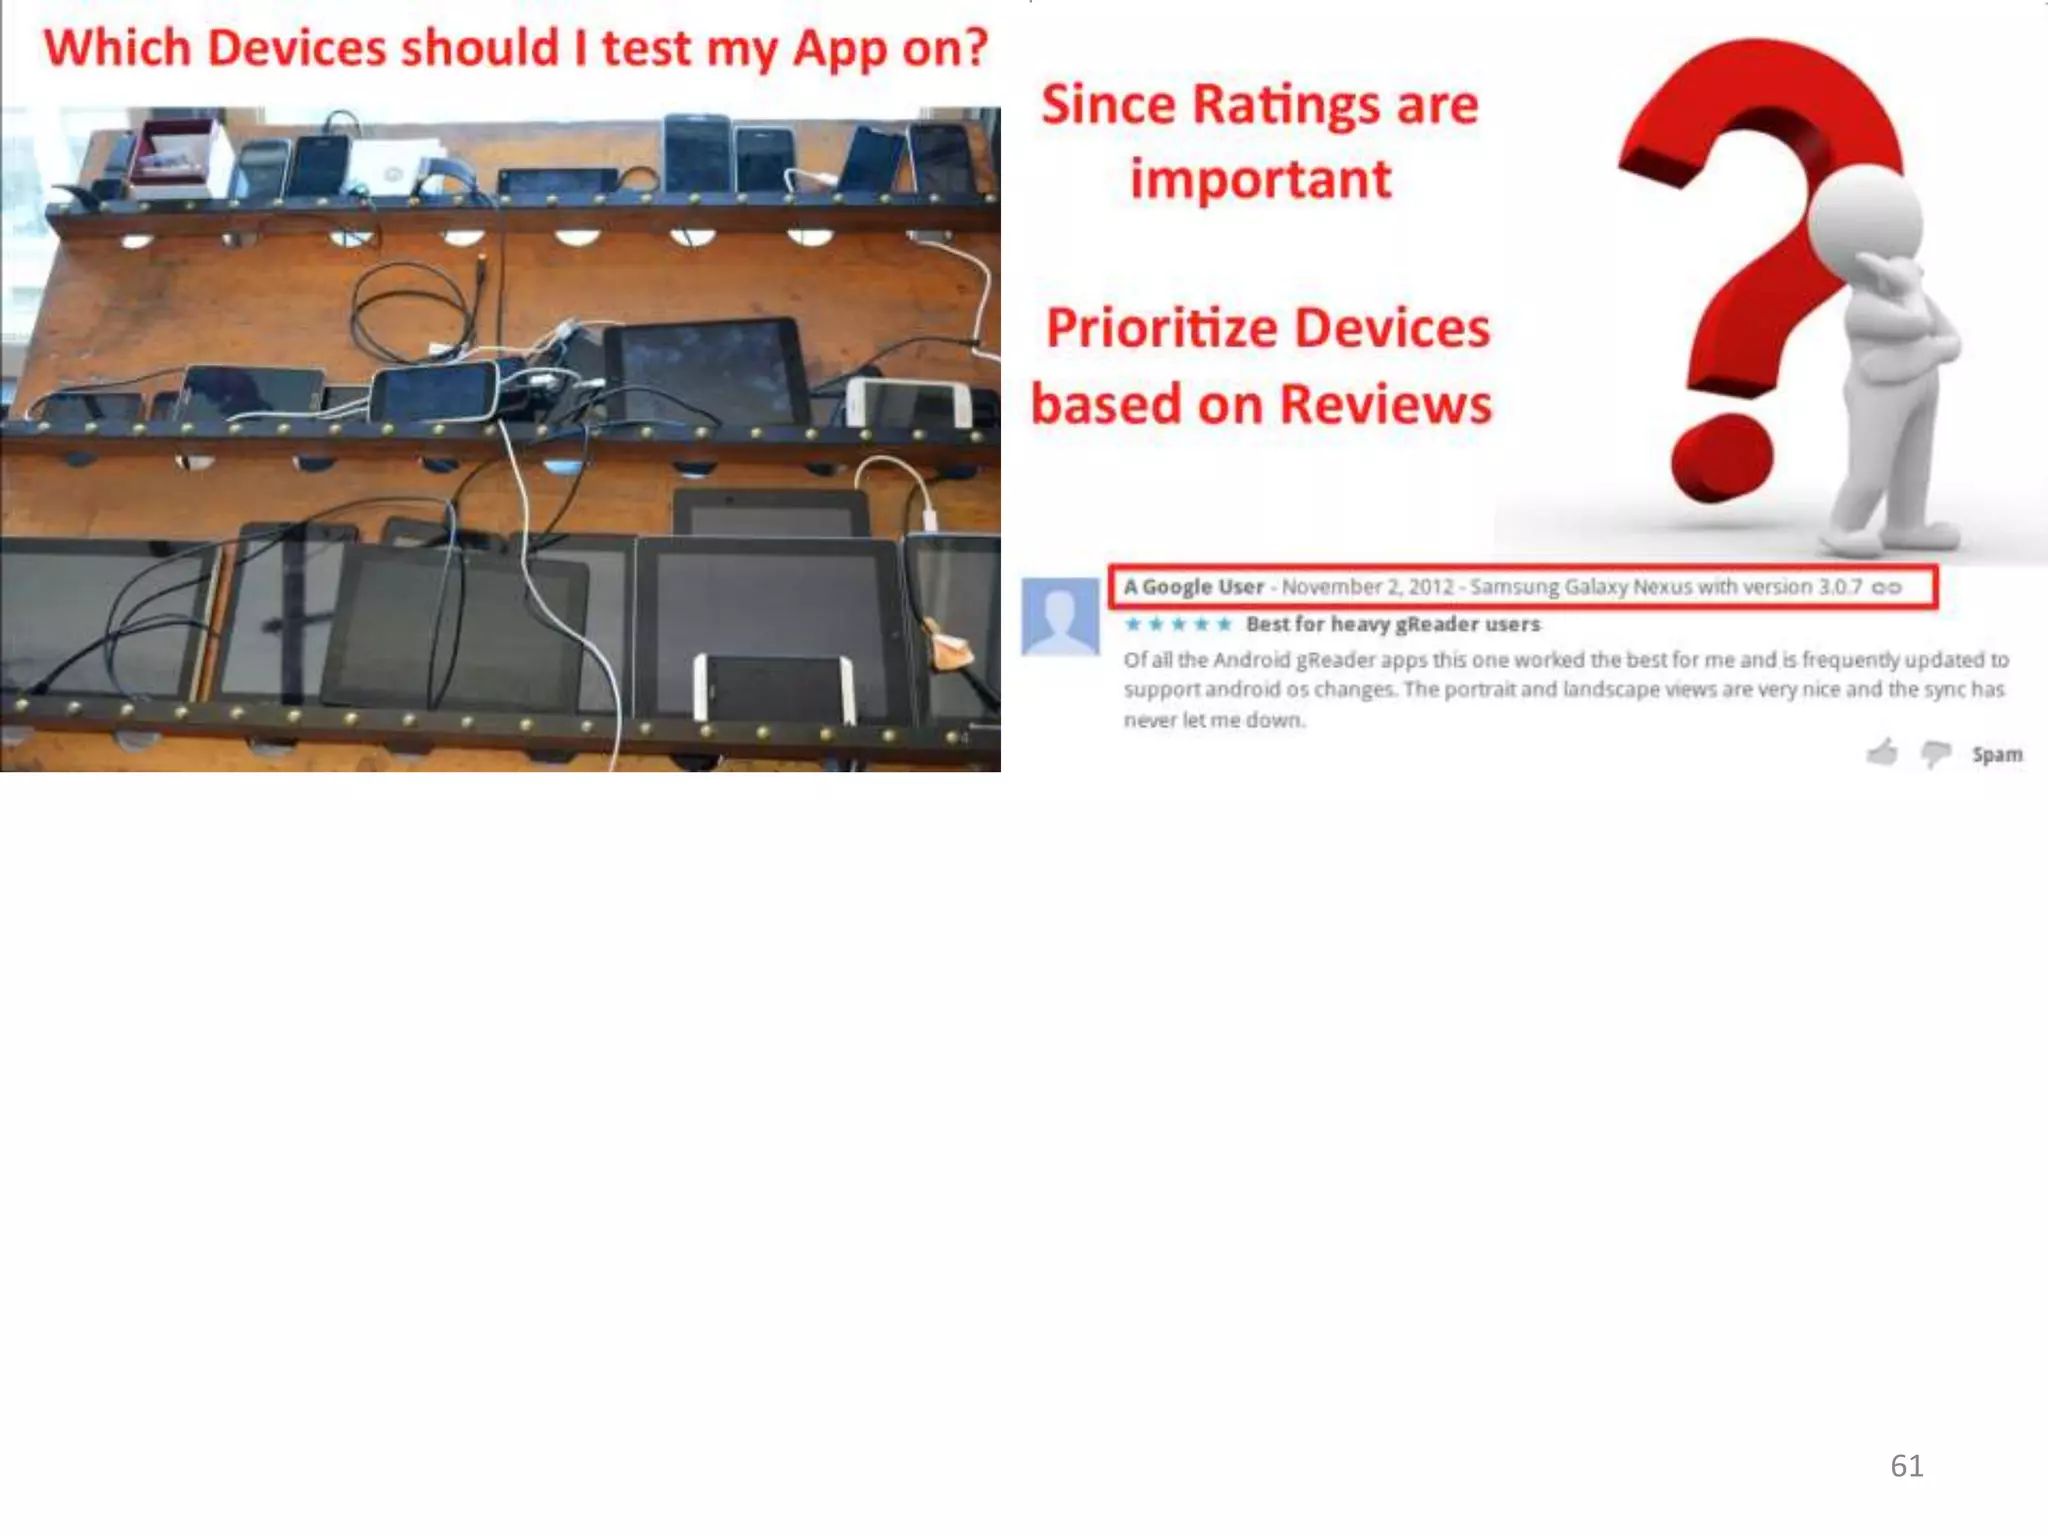
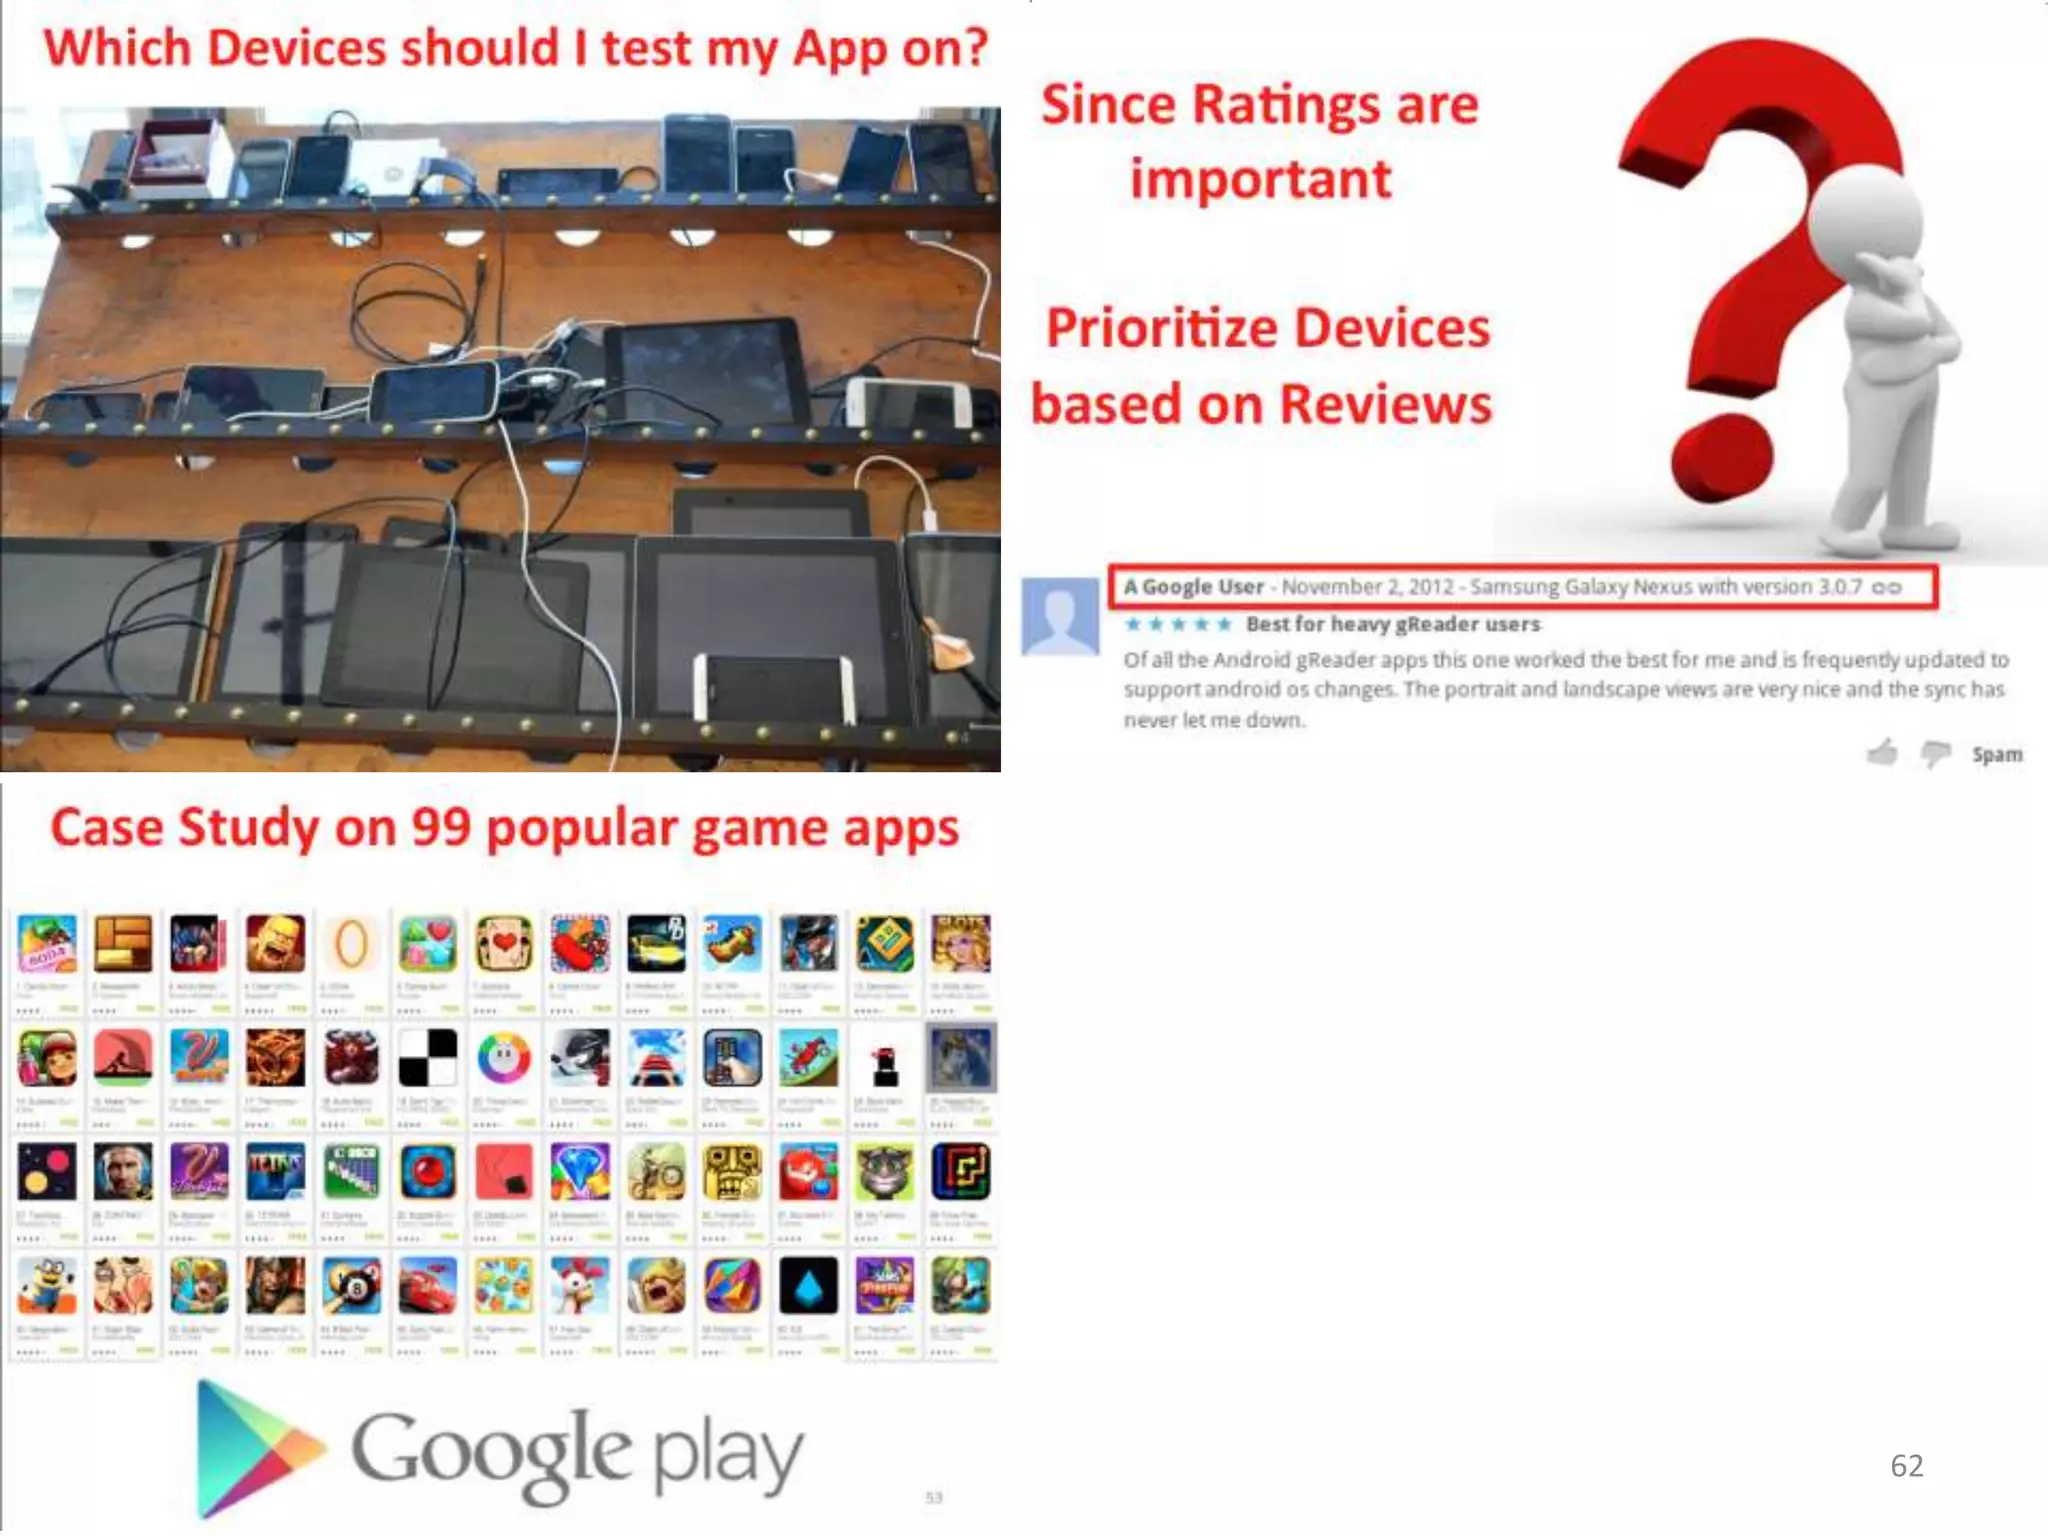
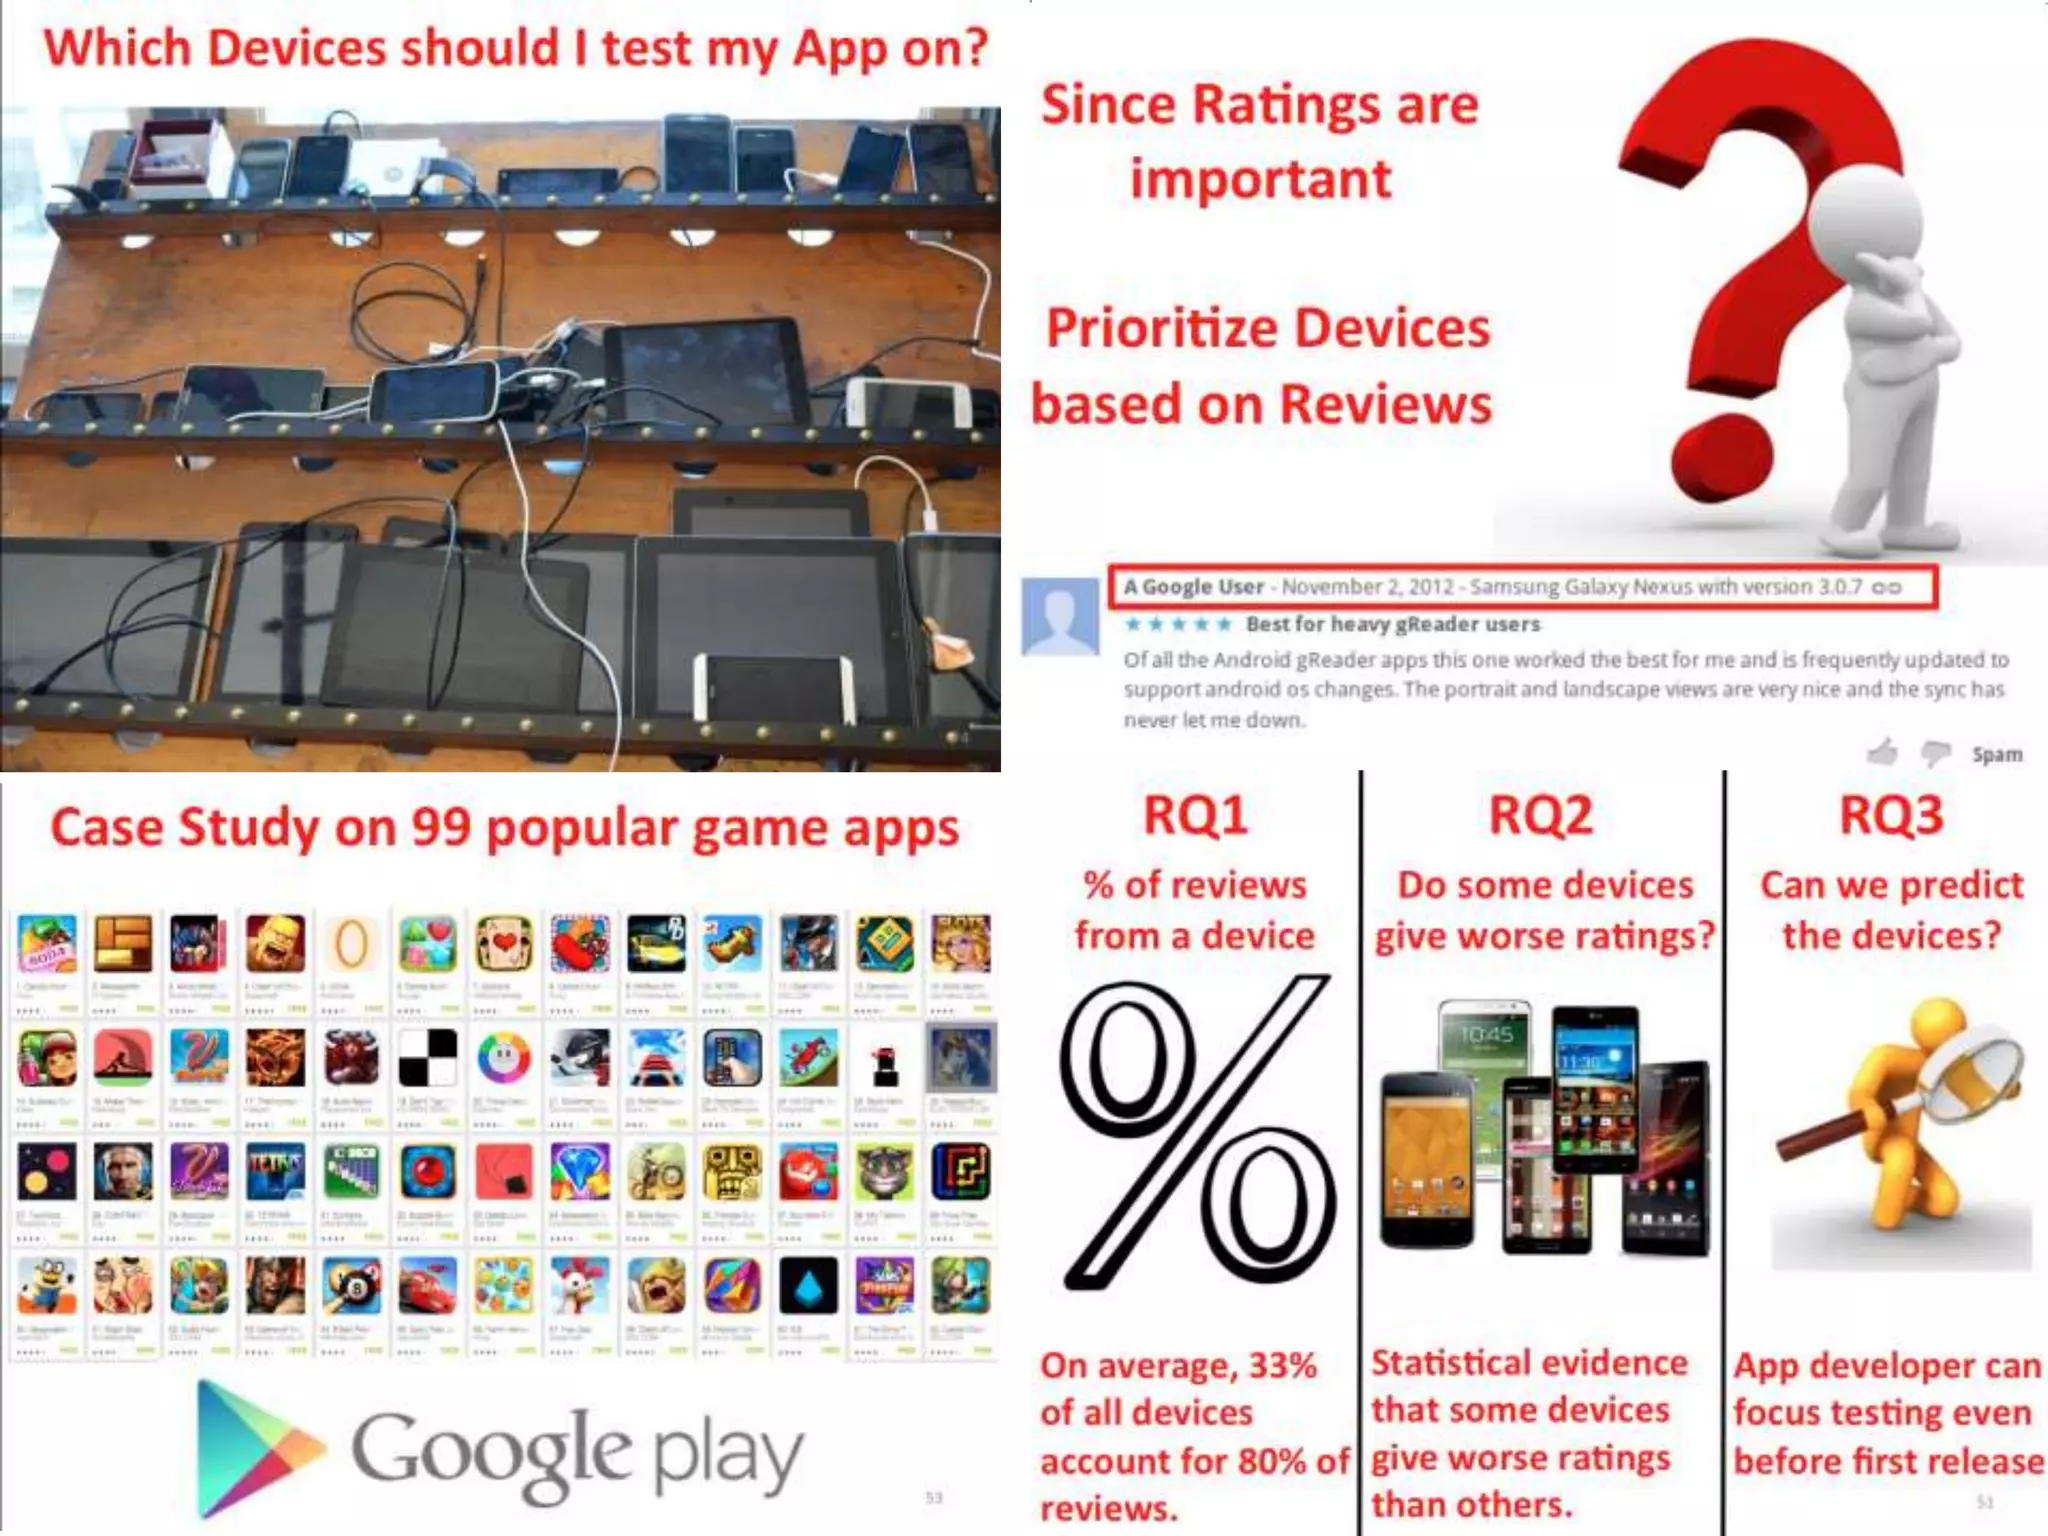
Prioritizing The Devices To Test Your App On:
A Case Study Of Android Game AppsOn the link between mobile app
quality and user reviews
Hammad Khalid
hammad@cs.queensu.ca
The Android Ecosystem has
huge number of Stakeholders
1B+ users
$4B+ revenues
2
1M+ apps
150K+ developers
3
One Challenge faced
by developers
Android Device Fragmentation
As of Aug 2014 – 19K devices 4
Android Device Fragmentation
As of Aug 2014 – 19K devices 5
94% of developers not working on
Android cited fragmentation as their
primary reason
Which Devices should I test my App on?
6
Which Devices should I test my App on?
7
Current Solution
8
9
Problem with Market Share
10
Market Share does not care about what
people are saying about your app.
11
Example - 100 Doors 2013
12
Examine reviews from Motorola Droid X
13
77% of the reviews from Motorola Droid X
are Bad reviews
14
77% of the reviews from Motorola Droid X
are Bad reviews
The rating for the app is brought down by
users of Motorola Droid X
15
0
1
2
3
4
5
6
7
8
9
10
However Motorola Droid X is not in the
top 10 devices by Market Share
16
Ratings from Reviews correlated with
Downloads
17
Since Ratings are
important
Prioritize Devices
based on
Review Share
Definition
19
Review Share – The percentage
of reviews that an app gets
from a device.
Approach to Calculate Review Share
20
Approach to Calculate Review Share
21
Approach to Calculate Review Share
22
Review Share
3/5 2/5
Case Study on 99 Game Apps in
Google Play
23
Case Study on 99 Game Apps in
Google Play
24
But why Game Apps?
0
5000
10000
15000
20000
25000
30000
35000
Most Popular - There are 35K Game Apps
with > 500K downloads
25
144K+ Most Useful Reviews
26
Device info present in ~ 90K reviews
27
28
Device info present in ~ 90K reviews
29
% of reviews
from a device
Do some devices
give worse ratings?
Predict the
devices to test
your new app on
Predict the
devices to test
your new app on
Do some devices
give worse ratings?
% of reviews
from a device
30
~20% of the Devices Account for
80% of the Reviews
31
0 5 10 15 20
020406080100
Percent of devices
Cumulativereview−share
0 5 10 15 20
020406080100
All ratings
Bad ratings
Medium ratings
Good ratings
Total - Min 38, Max 132 Devices
32
80% of reviews from just 13 - 45 devices
33
On average, 33%
of all devices
account for 80% of
reviews. 34
% of reviews
from a device
Do some devices
give worse ratings?
Predict the
devices to test
your new app on
On average, 33%
of all devices
account for 80% of
reviews. 35
% of reviews
from a device
Do some devices
give worse ratings?
Predict the
devices to test
your new app on
36
% of bad ratings to all ratings from a
device to an app
37
% of bad ratings to all ratings from a
device to an app
38
7/10 reviews from Motorola Droid X to
100 Doors app are 1 or 2 Star Ratings
39
% of bad to all ratings from a device to
an app for all apps and all devices
Statistical
Test
Scott-Knott
40
% of bad to all ratings from a device to
an app for all apps and all devices
Statistical
Test
Scott-Knott
Grouping of Devices
Some devices give worse ratings
41
Some devices give worse ratings
42
43
Manual Analysis of 677 1 or 2 star reviews
from Motorola Droid X2
44
Manual Analysis of 677 1 or 2 star reviews
from Motorola Droid X2
12% - Performance
45
Manual Analysis of 677 1 or 2 star reviews
from Motorola Droid X2
12% - Performance 6% - UI
On average, 33%
of all devices
account for 80% of
reviews.
Statistical evidence
that some devices
give worse ratings
than others. 46
% of reviews
from a device
Do some devices
give worse ratings?
Predict the
devices to test
your new app on
On average, 33%
of all devices
account for 80% of
reviews.
Statistical evidence
that some devices
give worse ratings
than others. 47
% of reviews
from a device
Do some devices
give worse ratings?
Predict the
devices to test
your new app on
Learn what devices review 98 of the 99
Game apps
48
Apply it to the remaining app
49
50
Compare Top 10 devices we predict vs
Top 10 actual devices
For most apps
7 out of top
10 devices
with most
reviews are
common
51
Compare Top 10 devices we predict vs
Top 10 actual devices
For most apps
only 7% of
reviews are
missed
52
Compare Top 10 devices we predict vs
Top 10 actual devices
On average, 33%
of all devices
account for 80% of
reviews.
Statistical evidence
that some devices
give worse ratings
than others.
App developer can
focus testing even
before first release
53
% of reviews
from a device
Do some devices
give worse ratings?
Can we predict
the devices?
Take Away
54
Take Away
55
1. Android Fragmentation is not as bad one
would think (in practice).
Take Away
56
2. App developers could use device information
from reviews to prioritize their testing efforts
1. Android Fragmentation is not as bad one
would think (in practice).
All results Generalize to Paid Game Apps…
57
58
… and to 4 other categories of apps
Summary
59
60
61
62
63

Prioritizing the Devices to Test Your App On: A Case Study of Android Game Apps

Editor's Notes

  • #3 http://www.forbes.com/sites/tristanlouis/2013/08/10/how-much-do-average-apps-make/