Download as PDF, PPTX

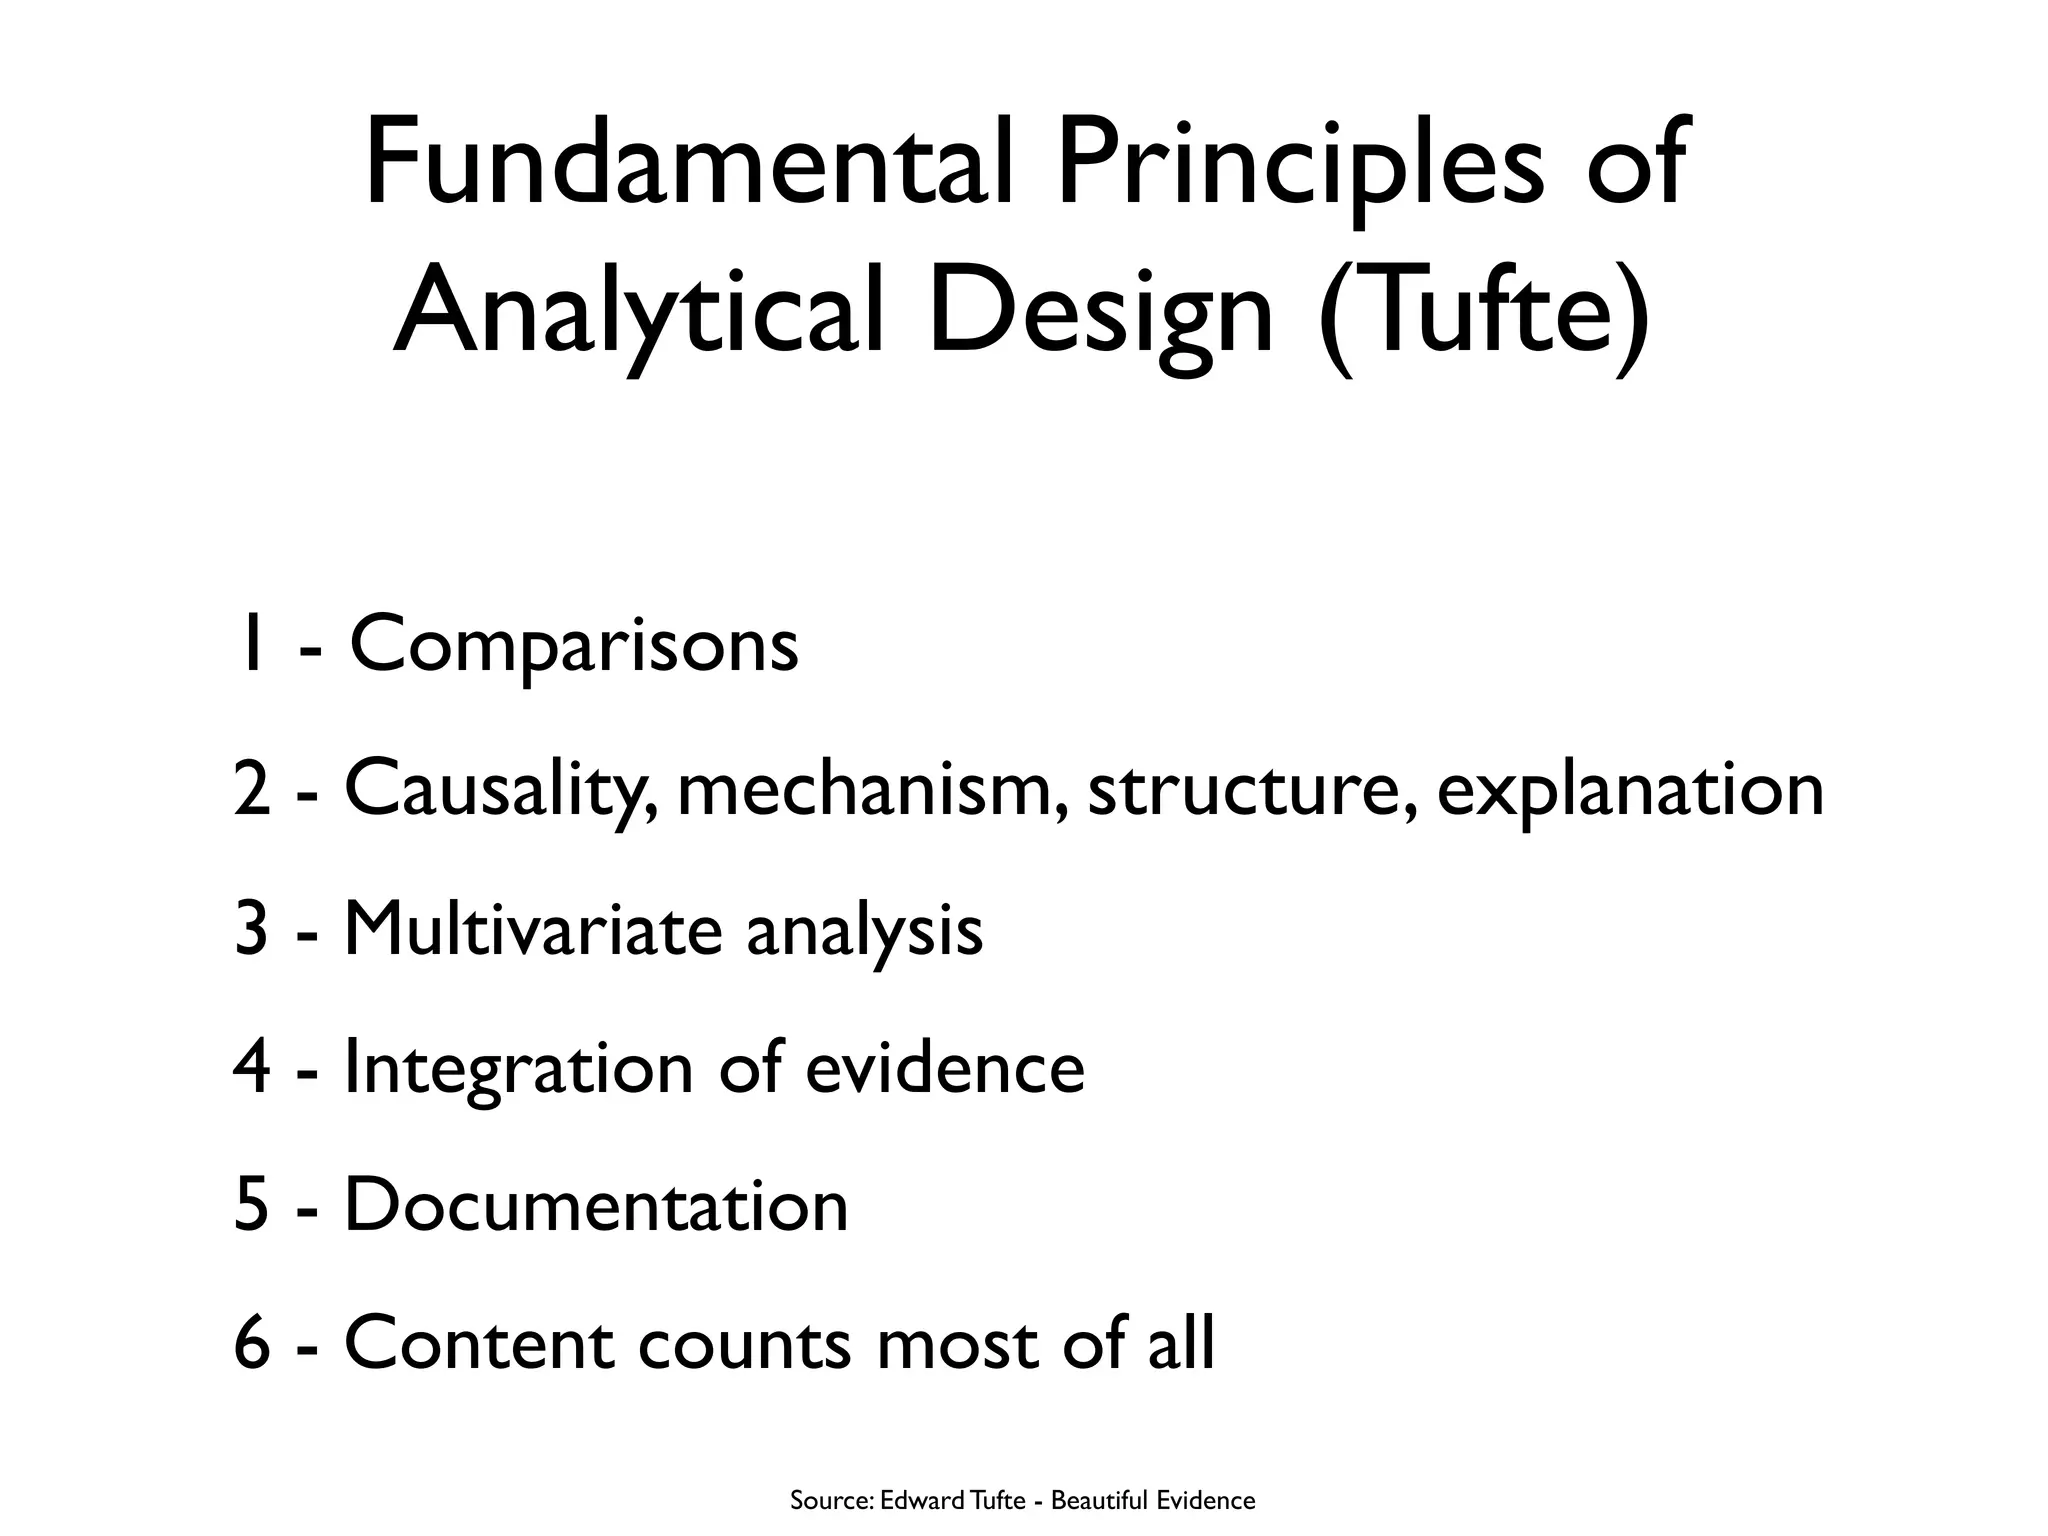
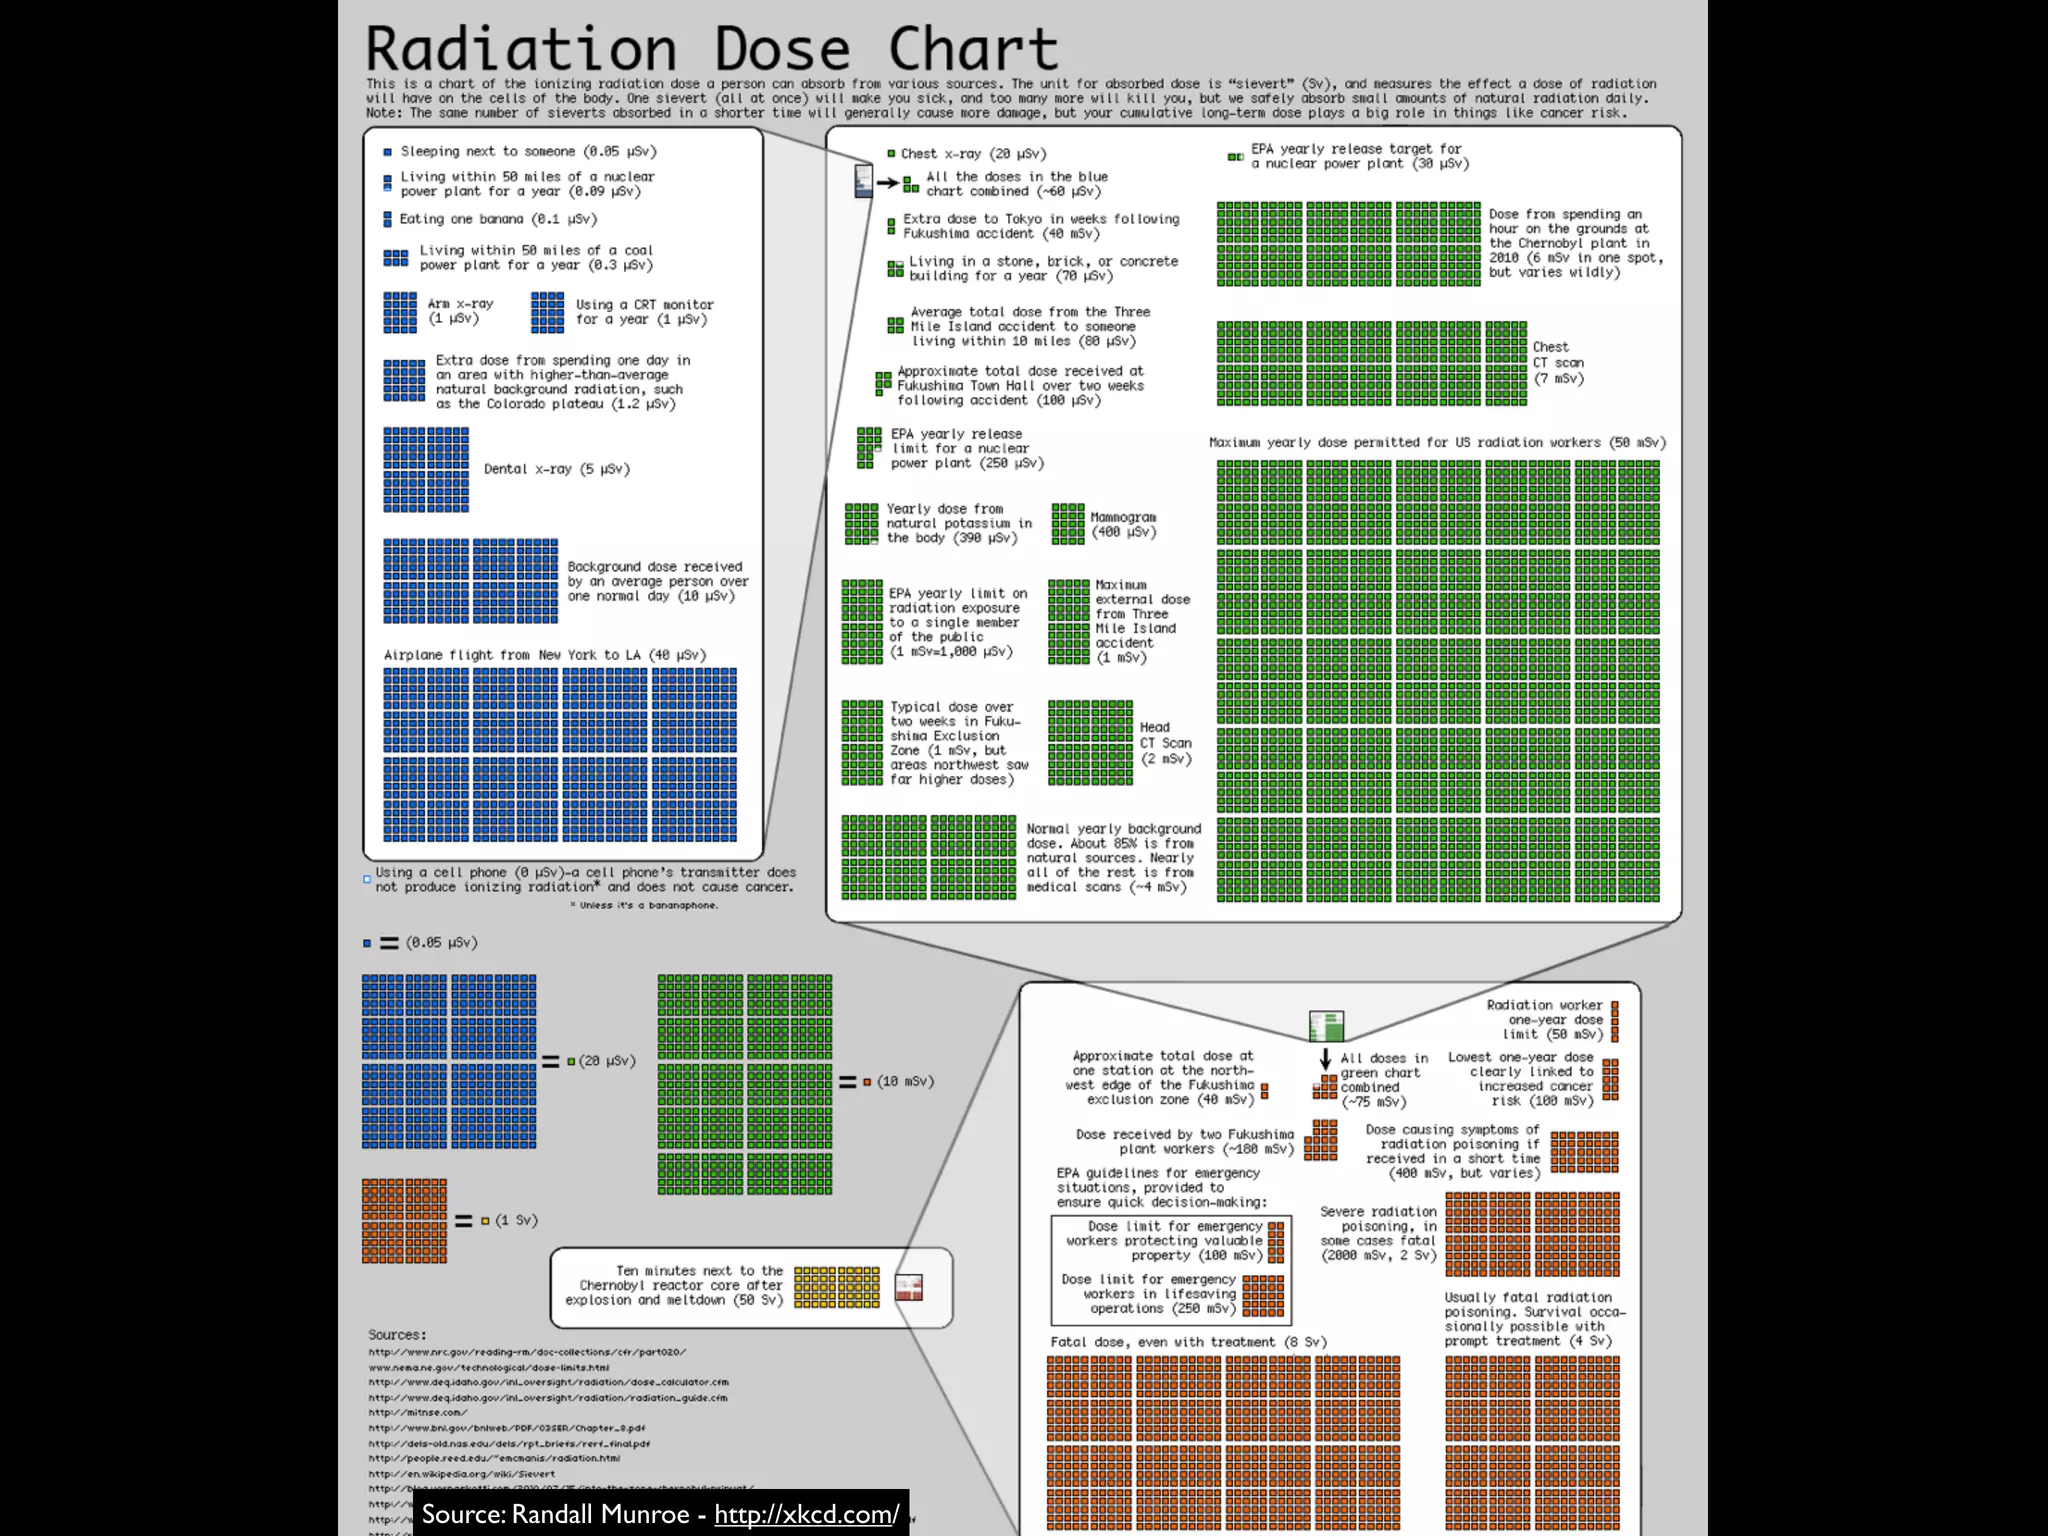
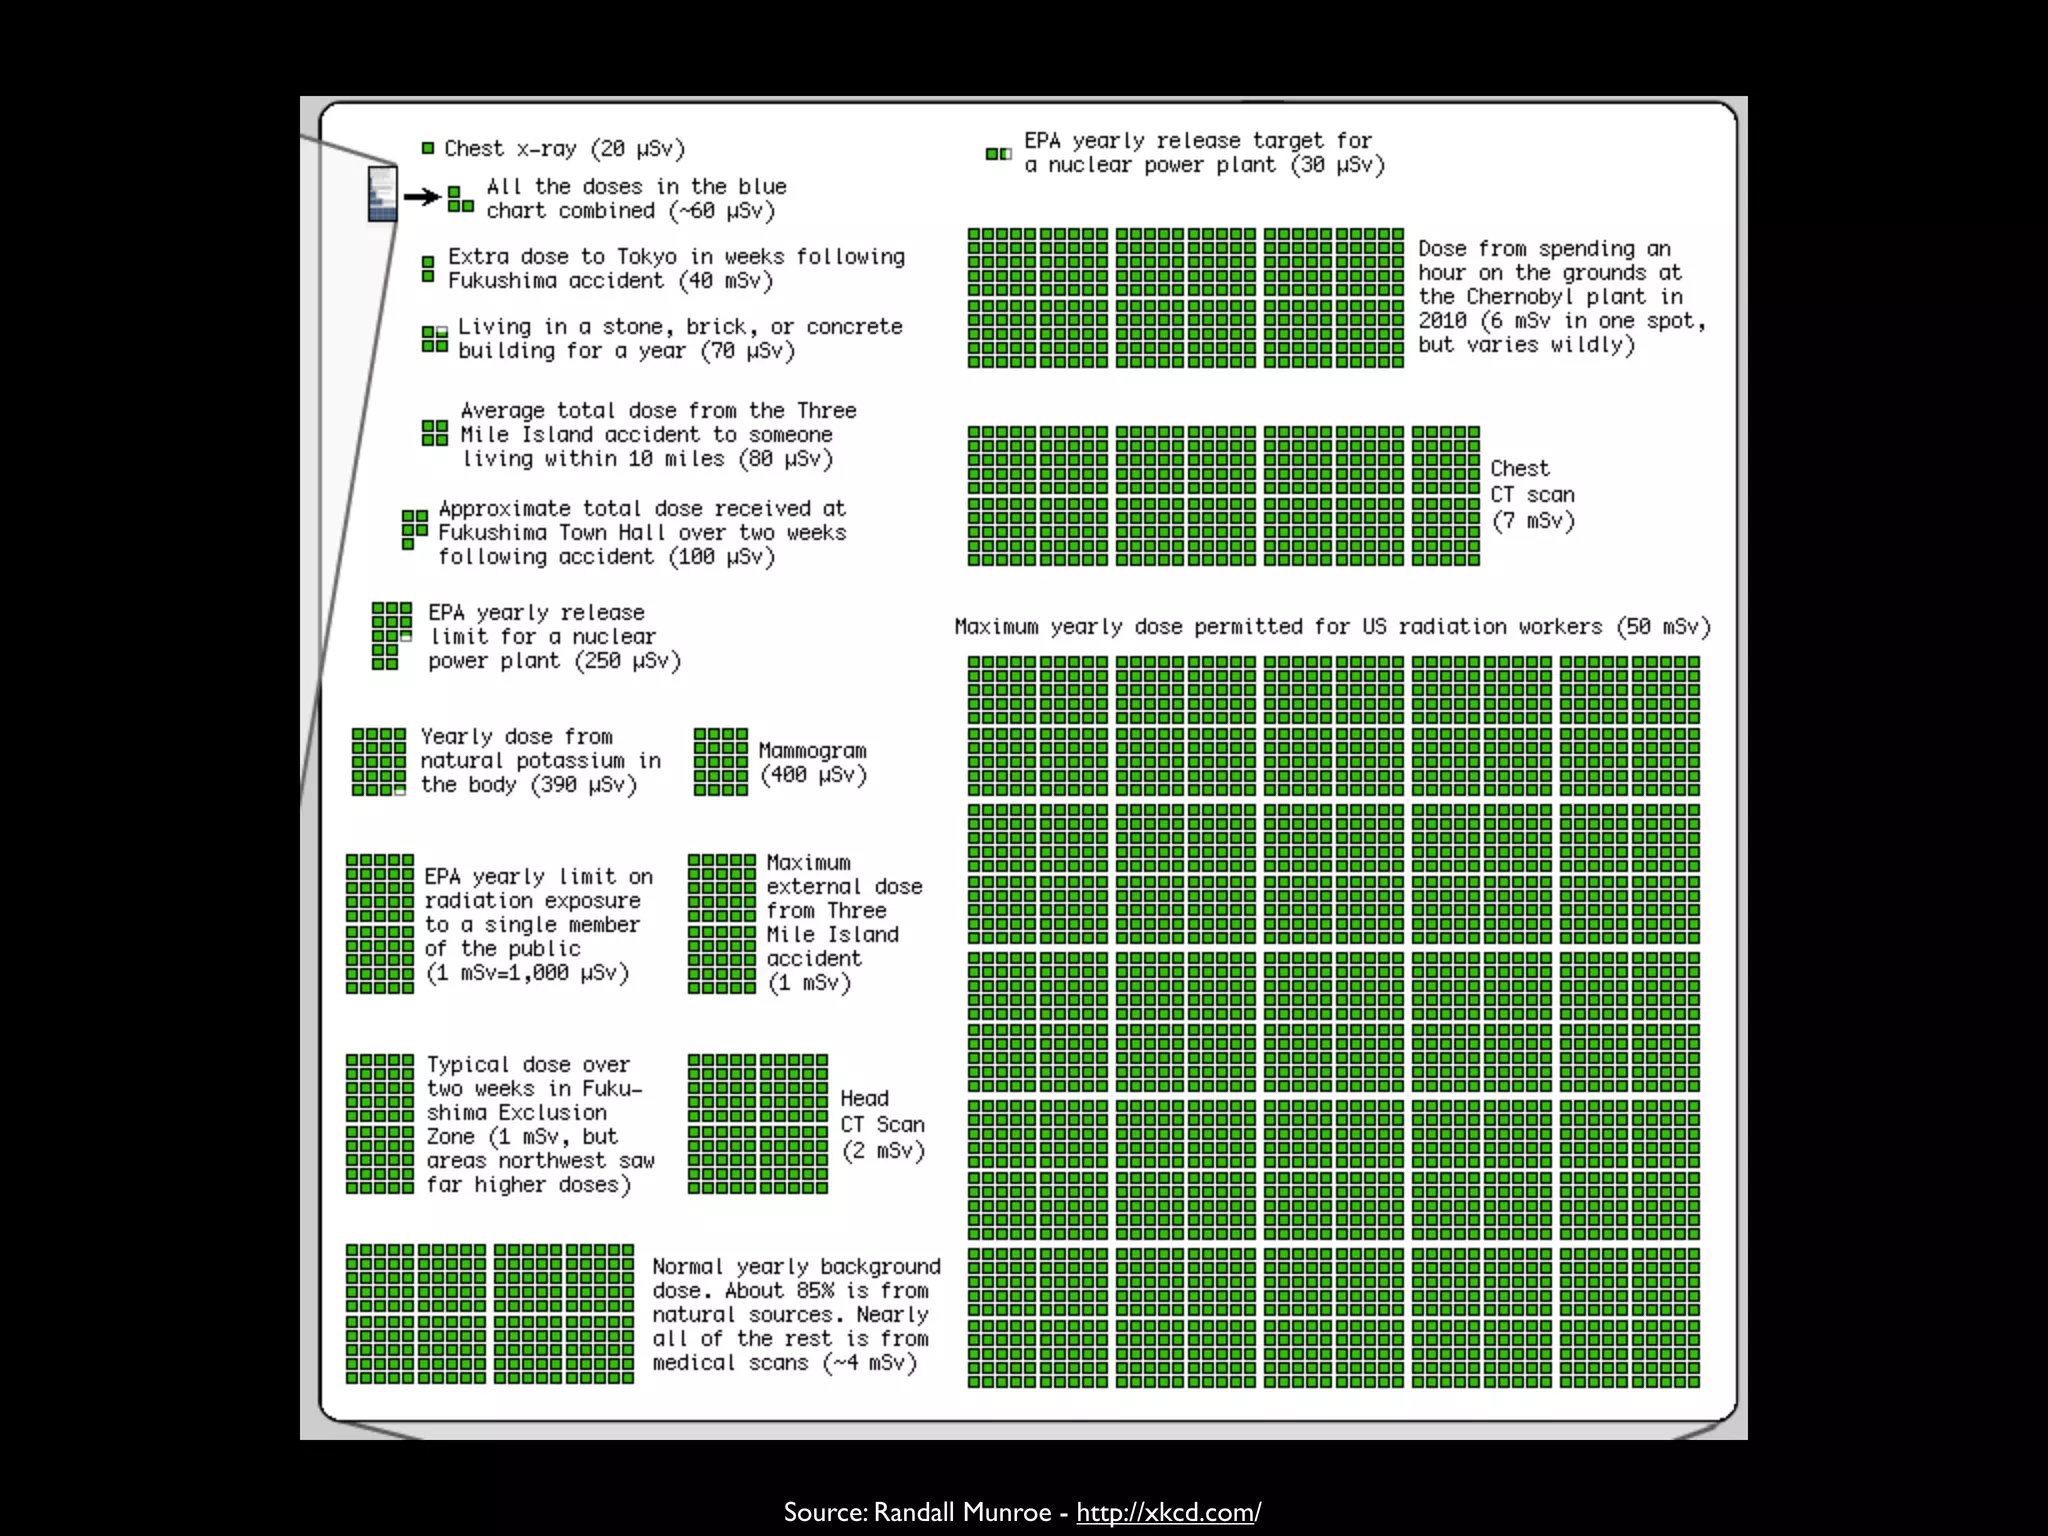
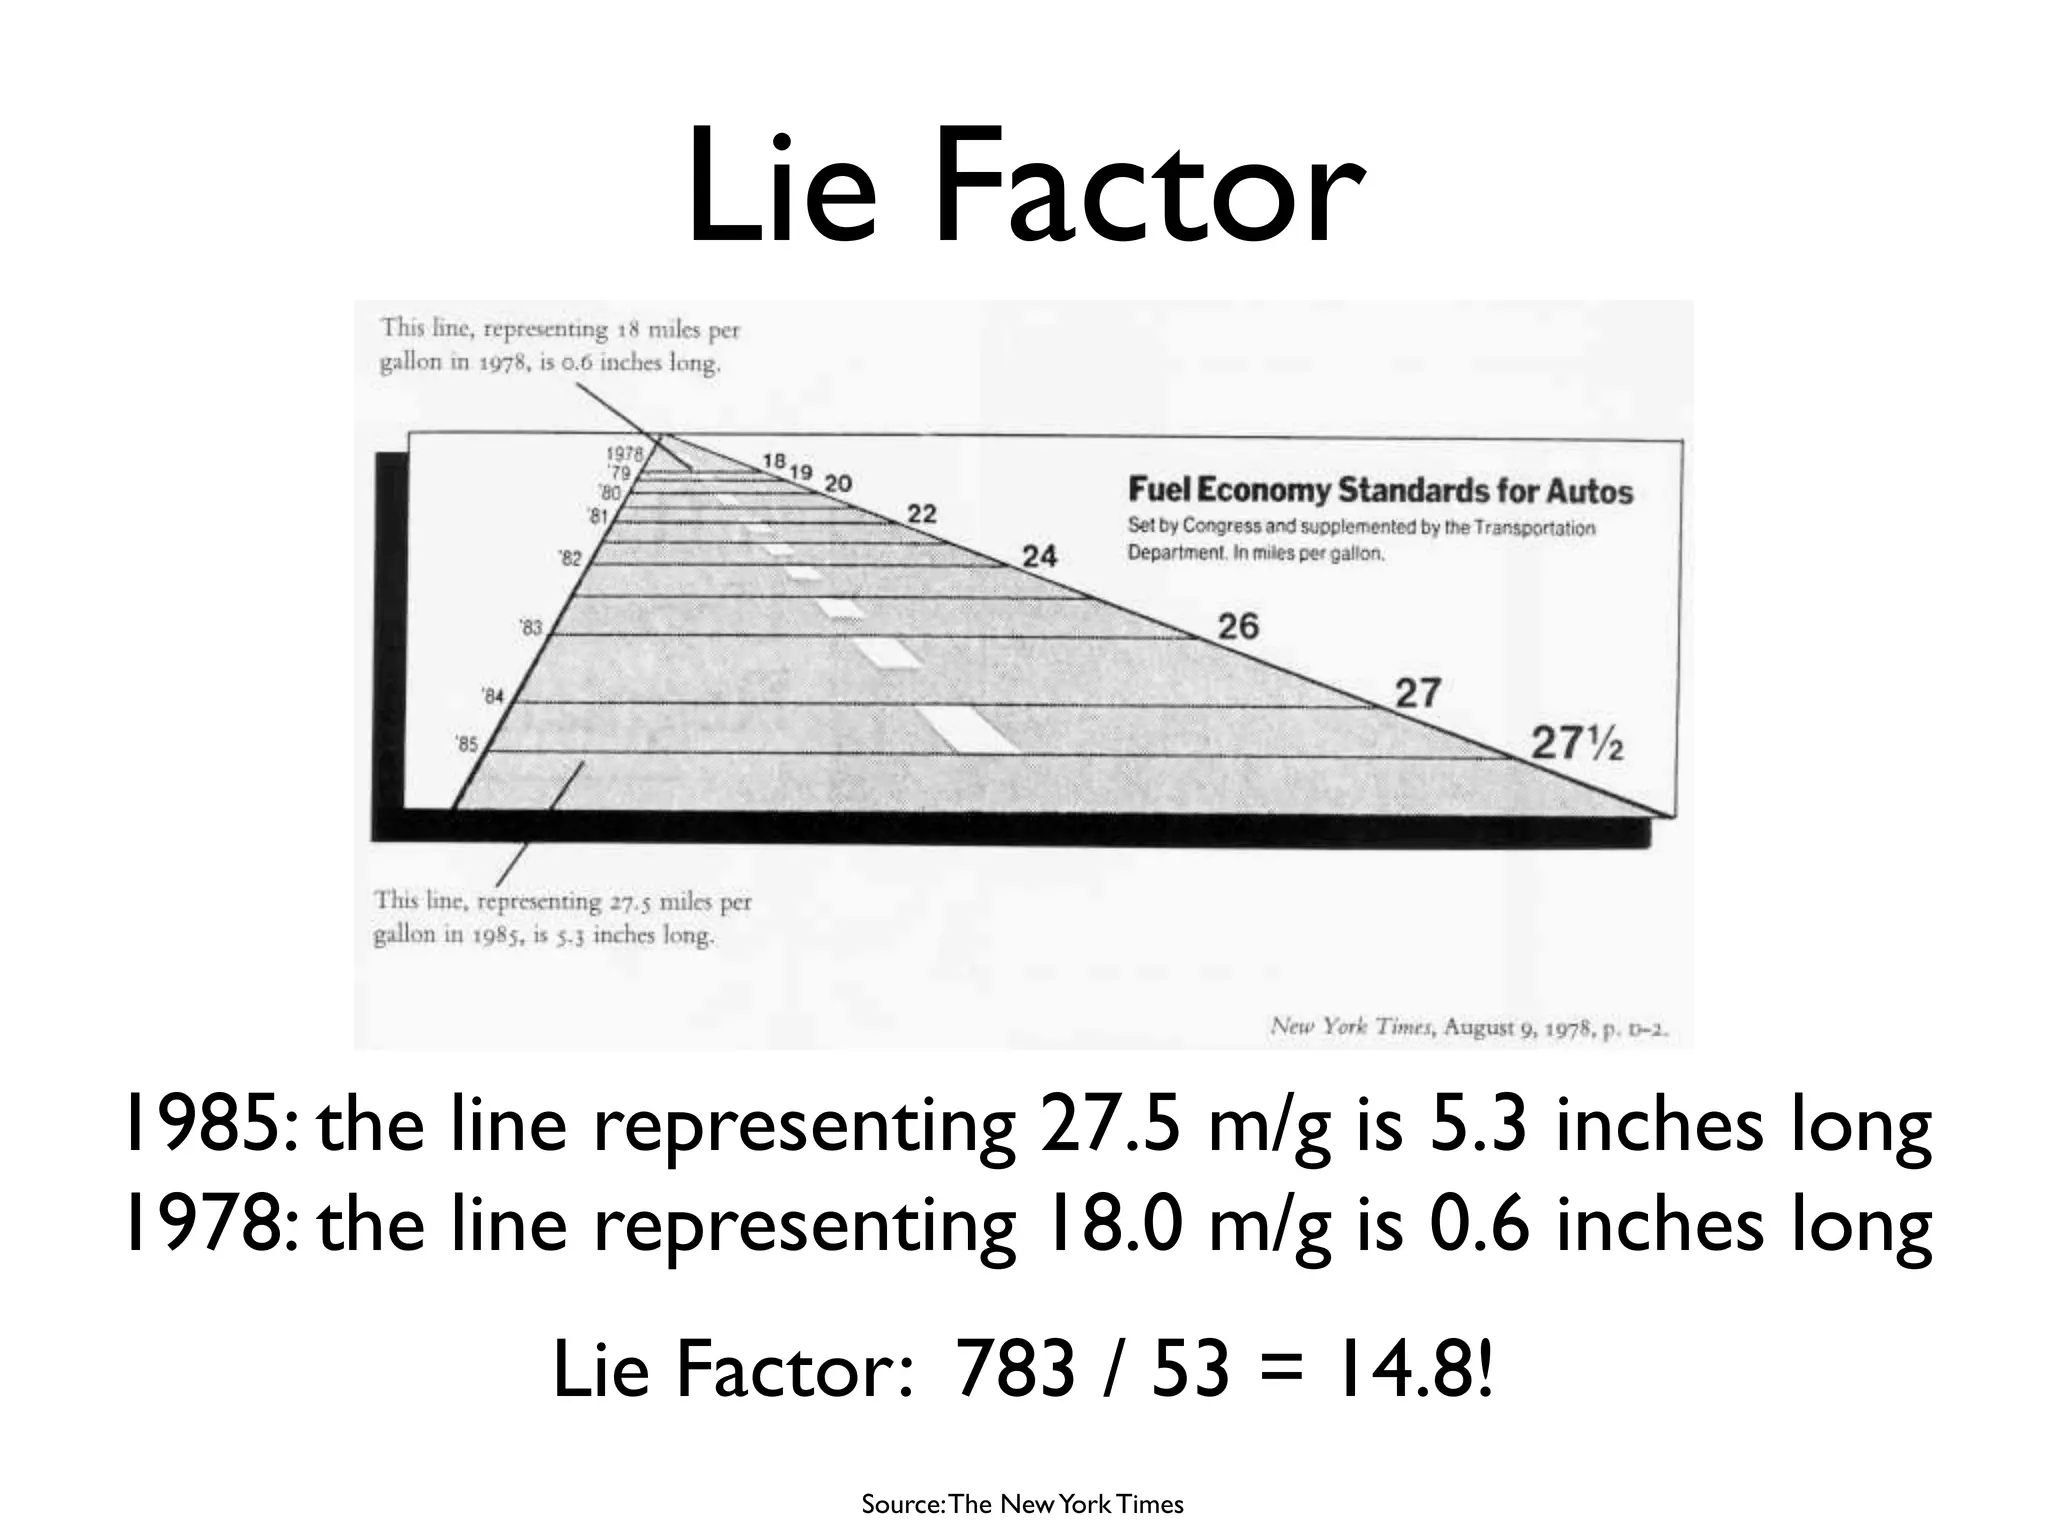


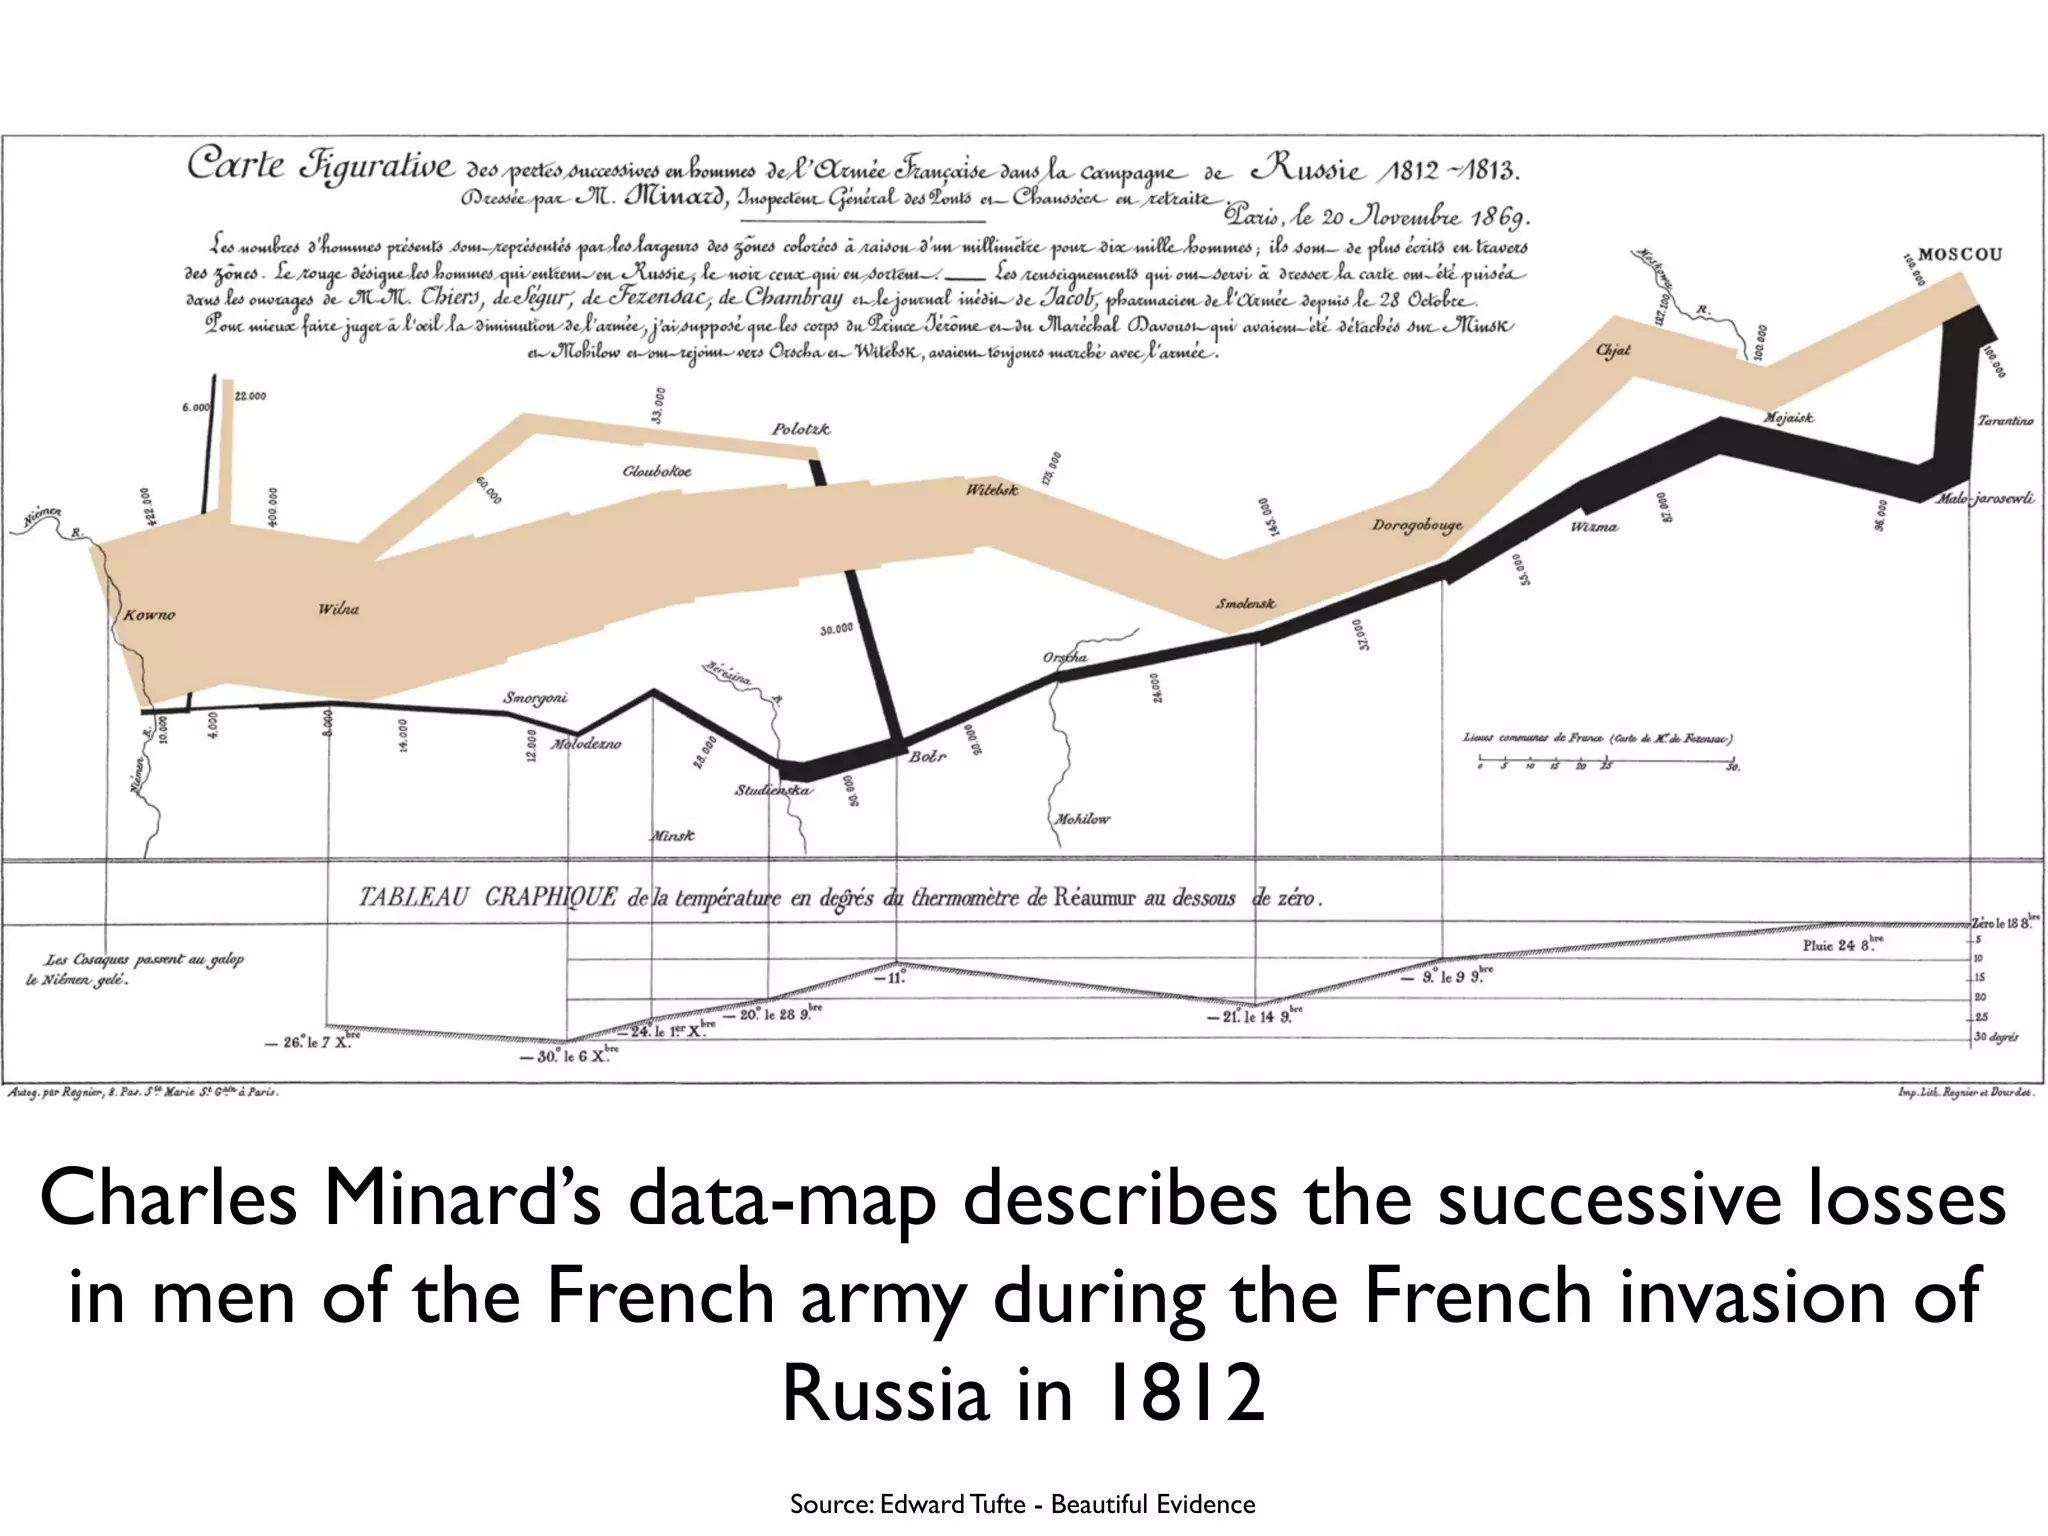
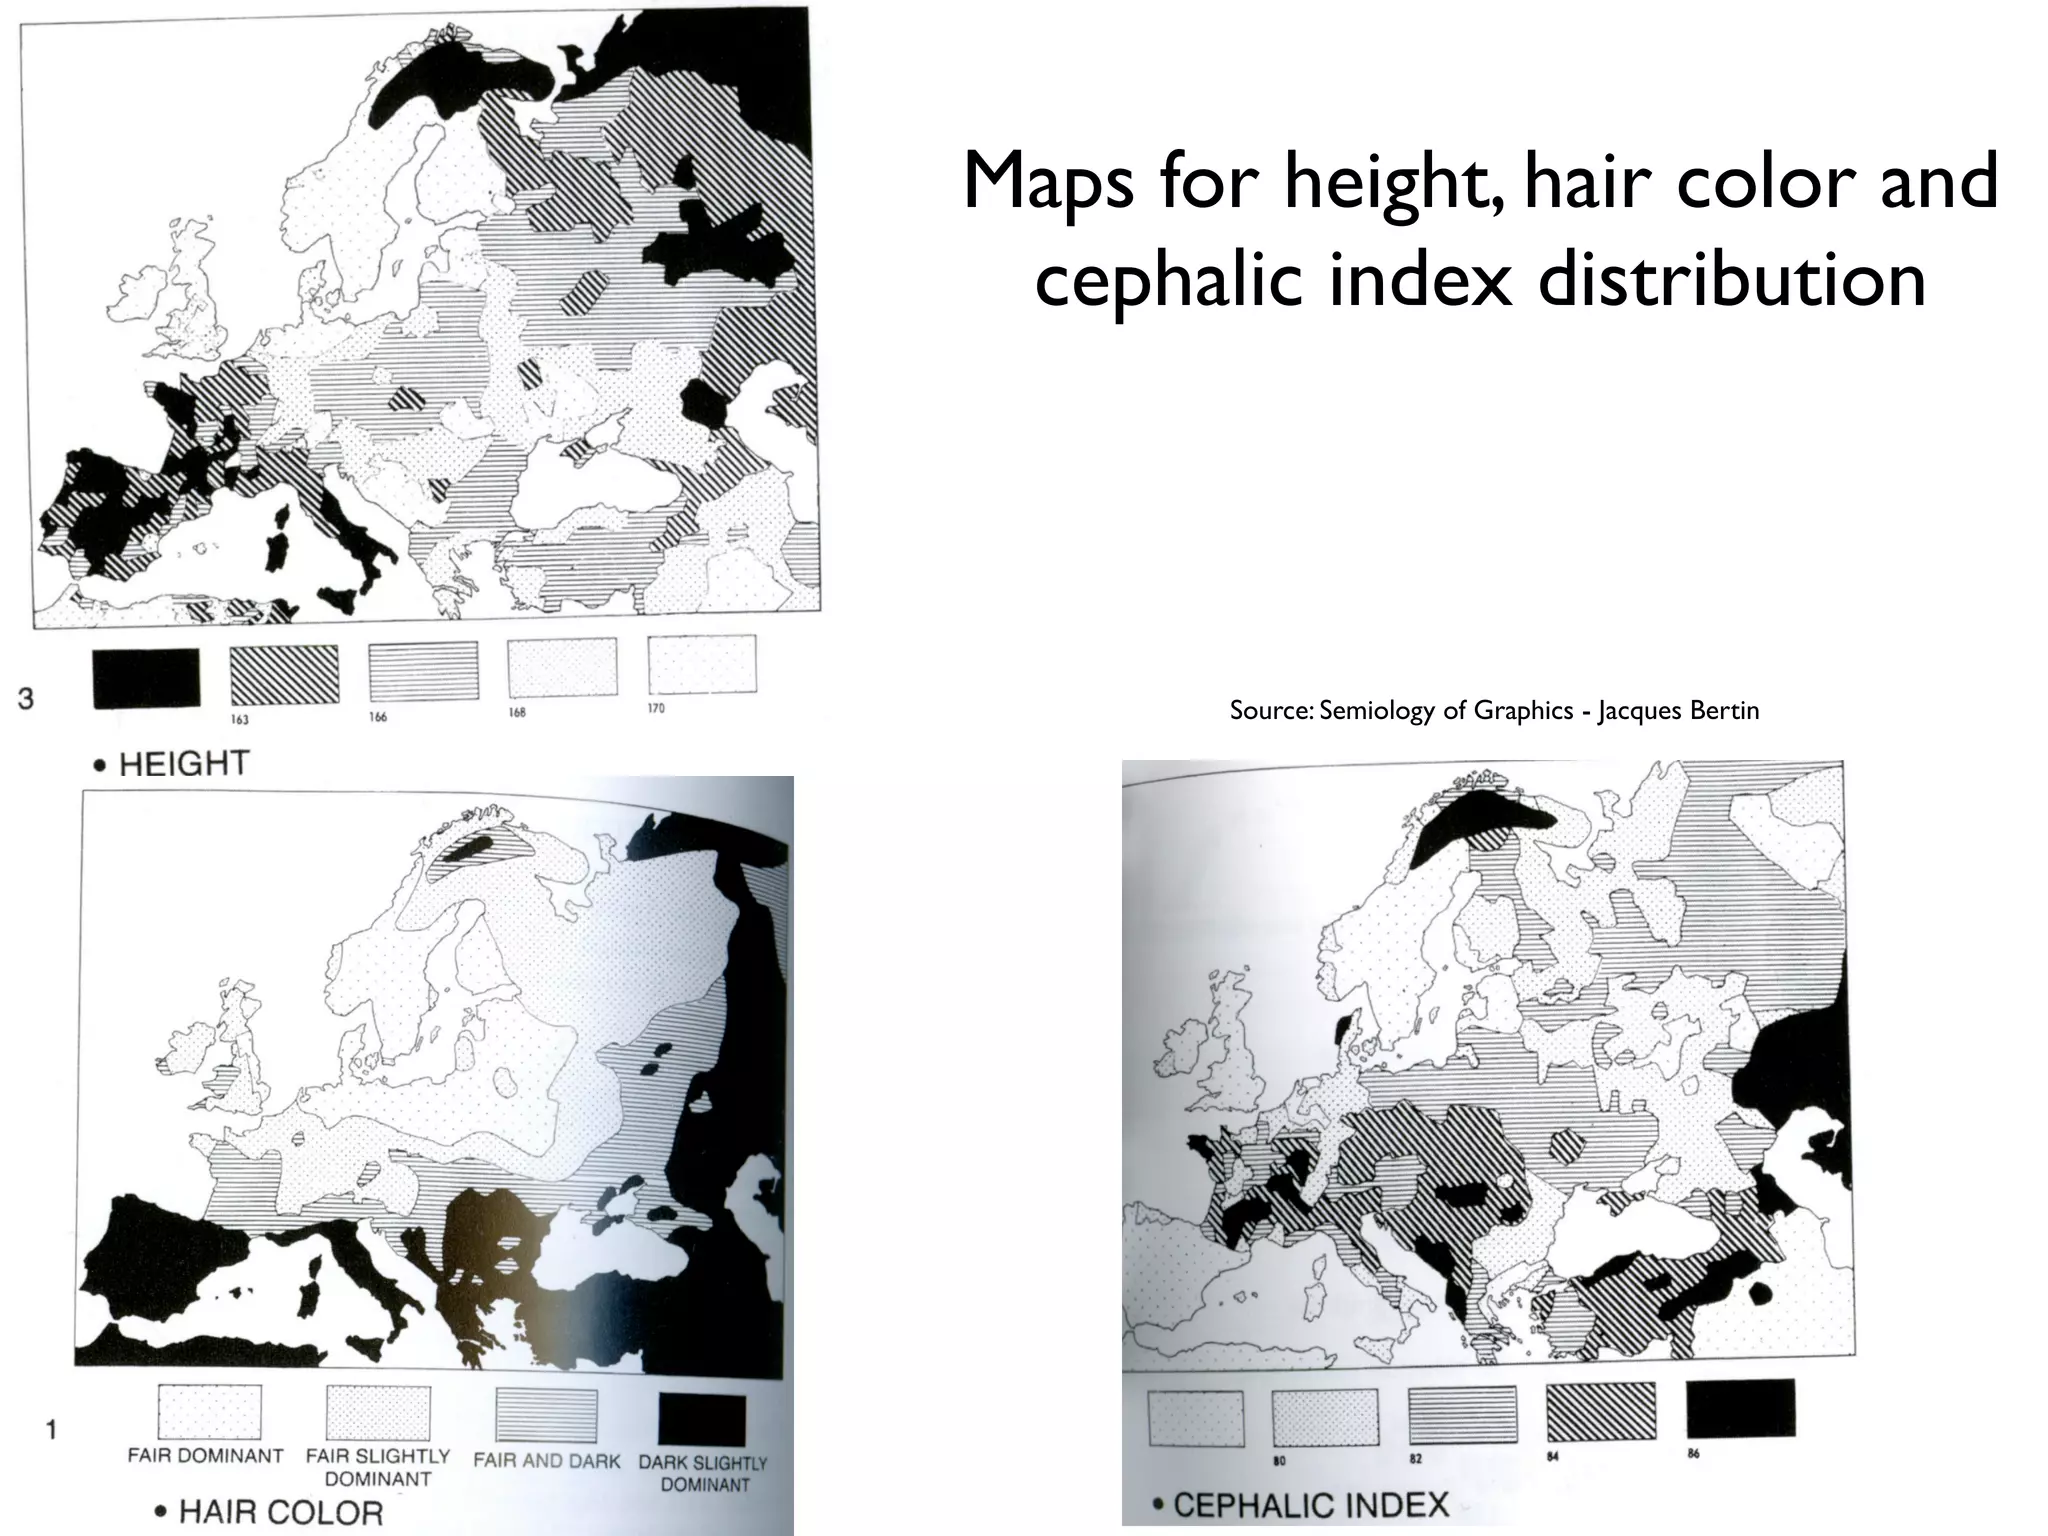

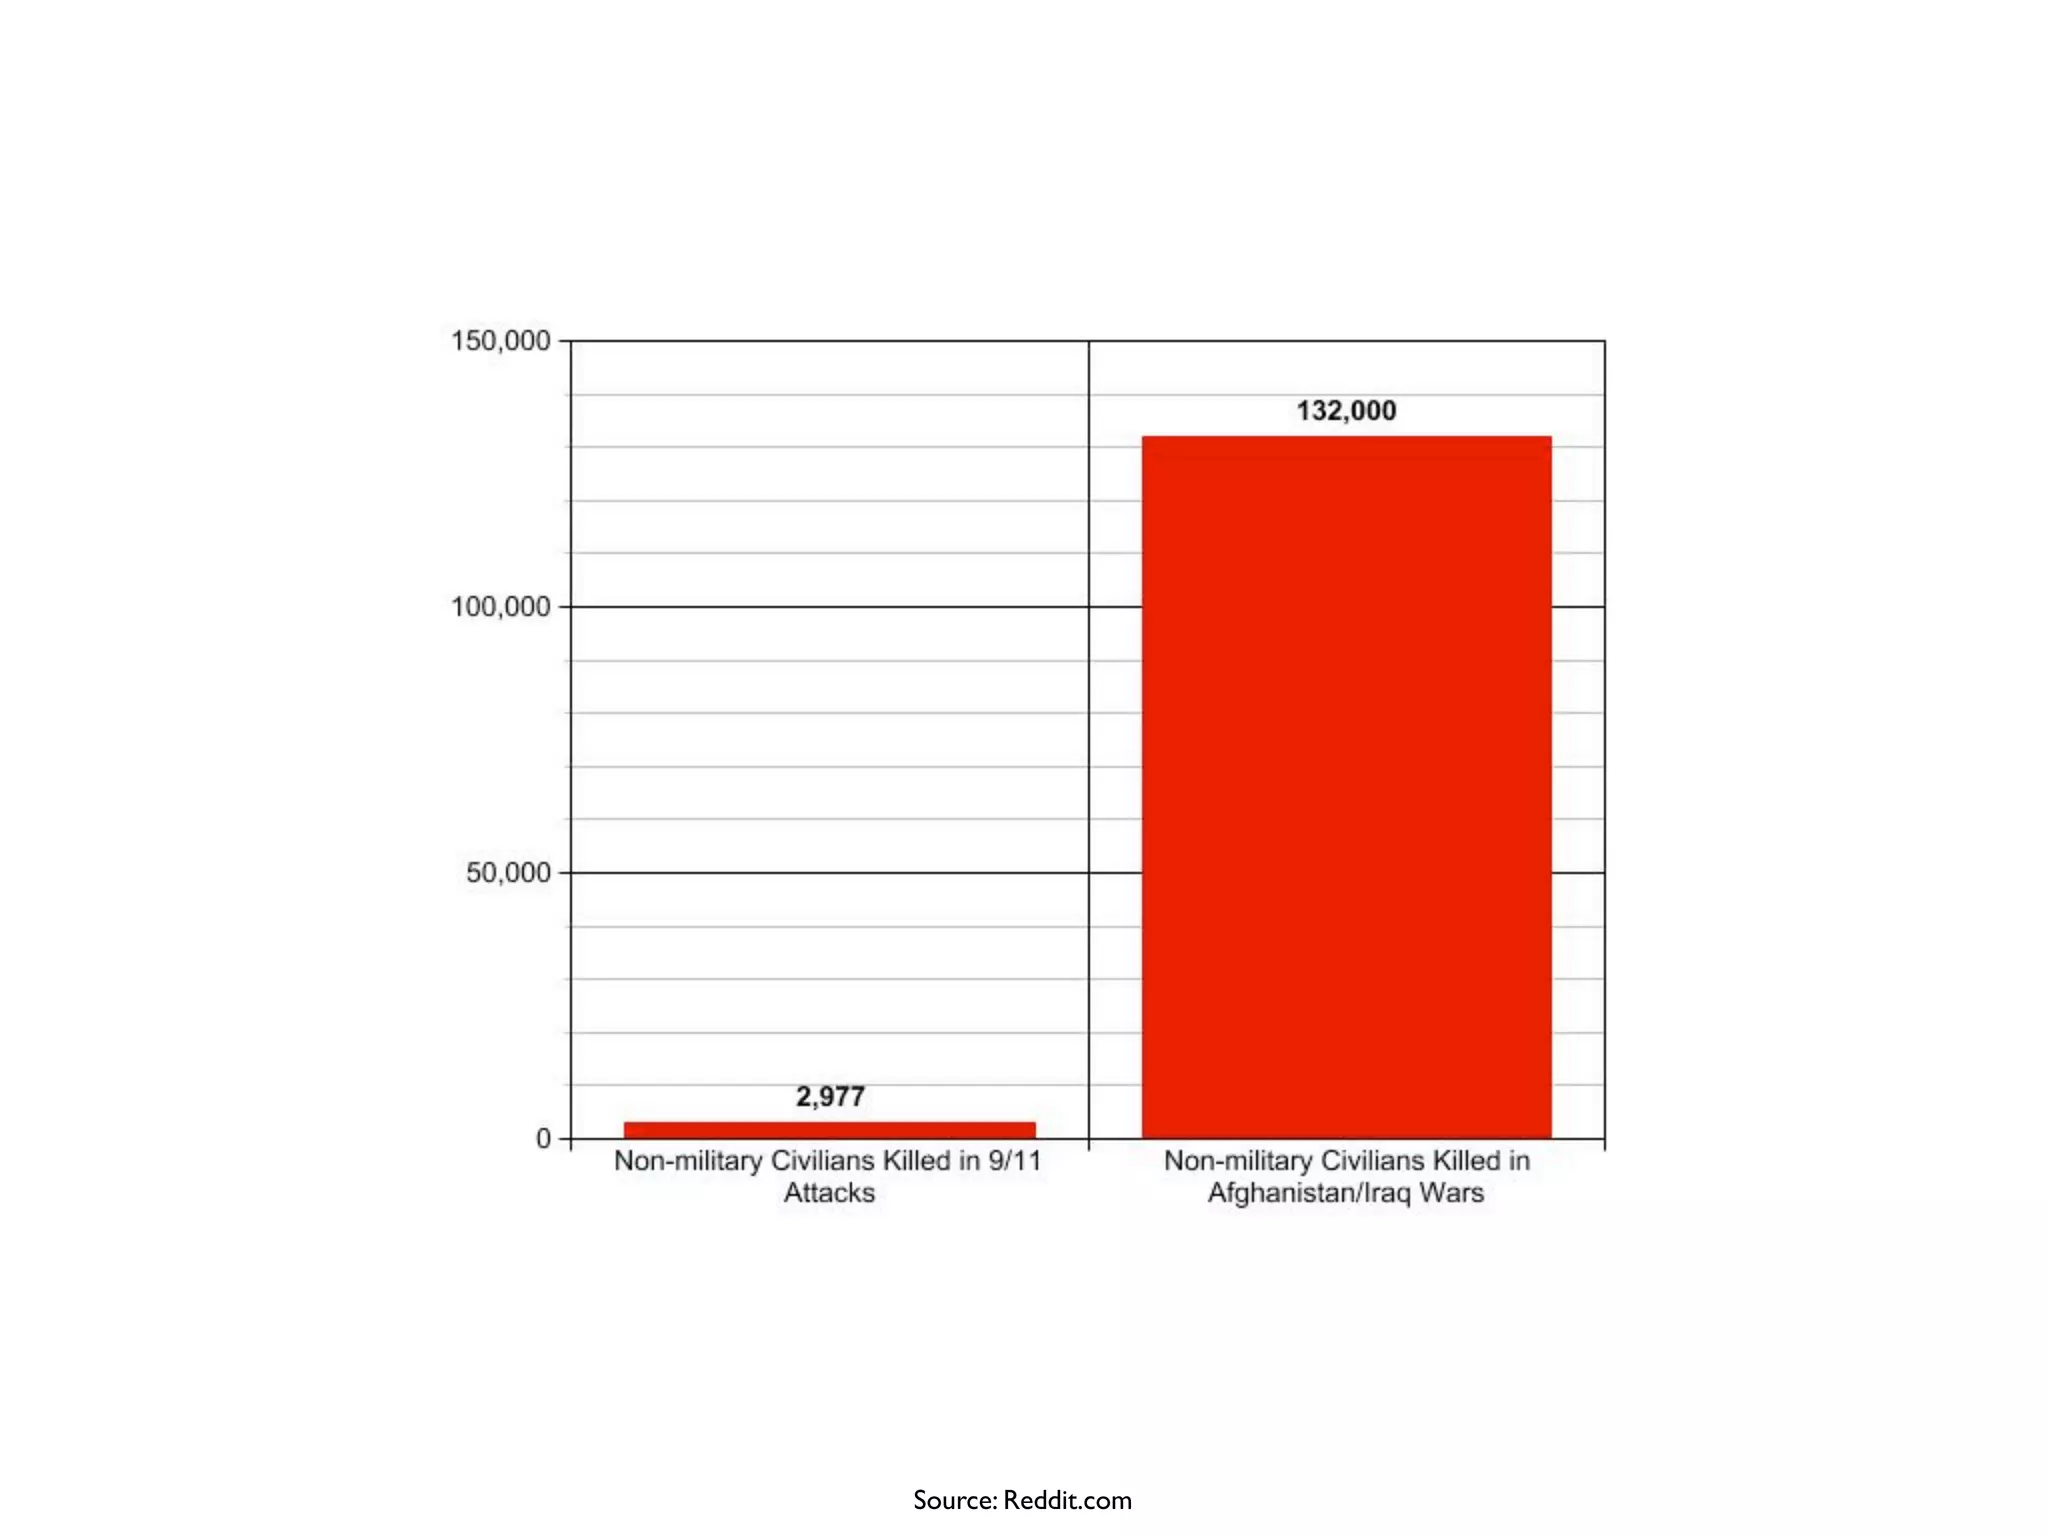
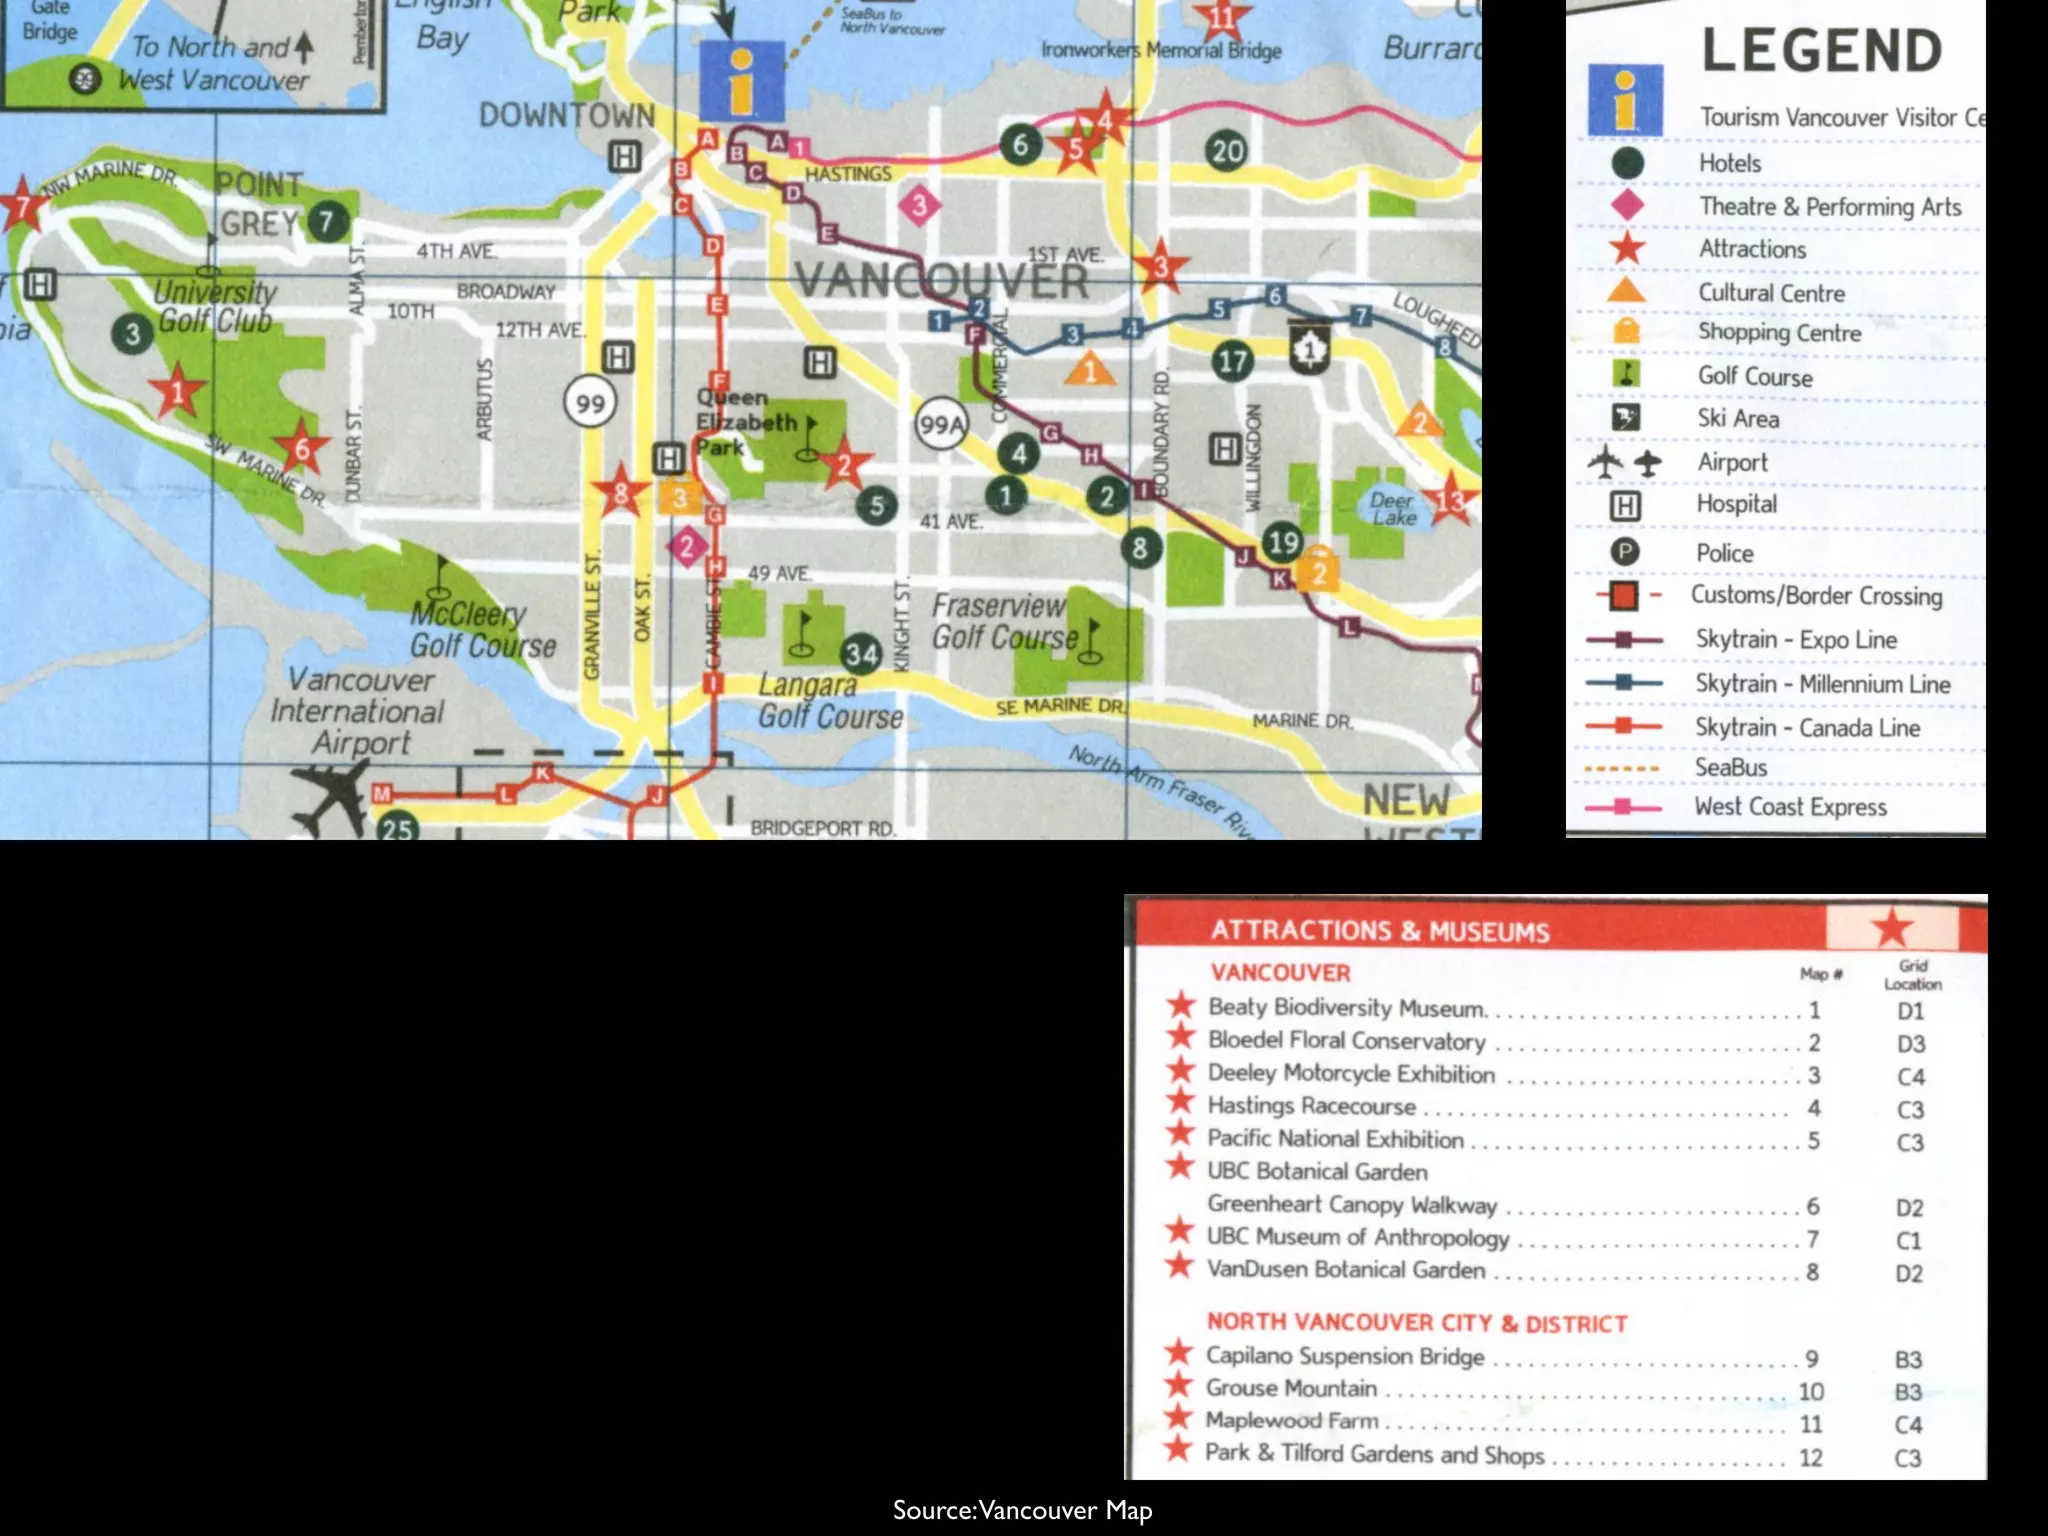
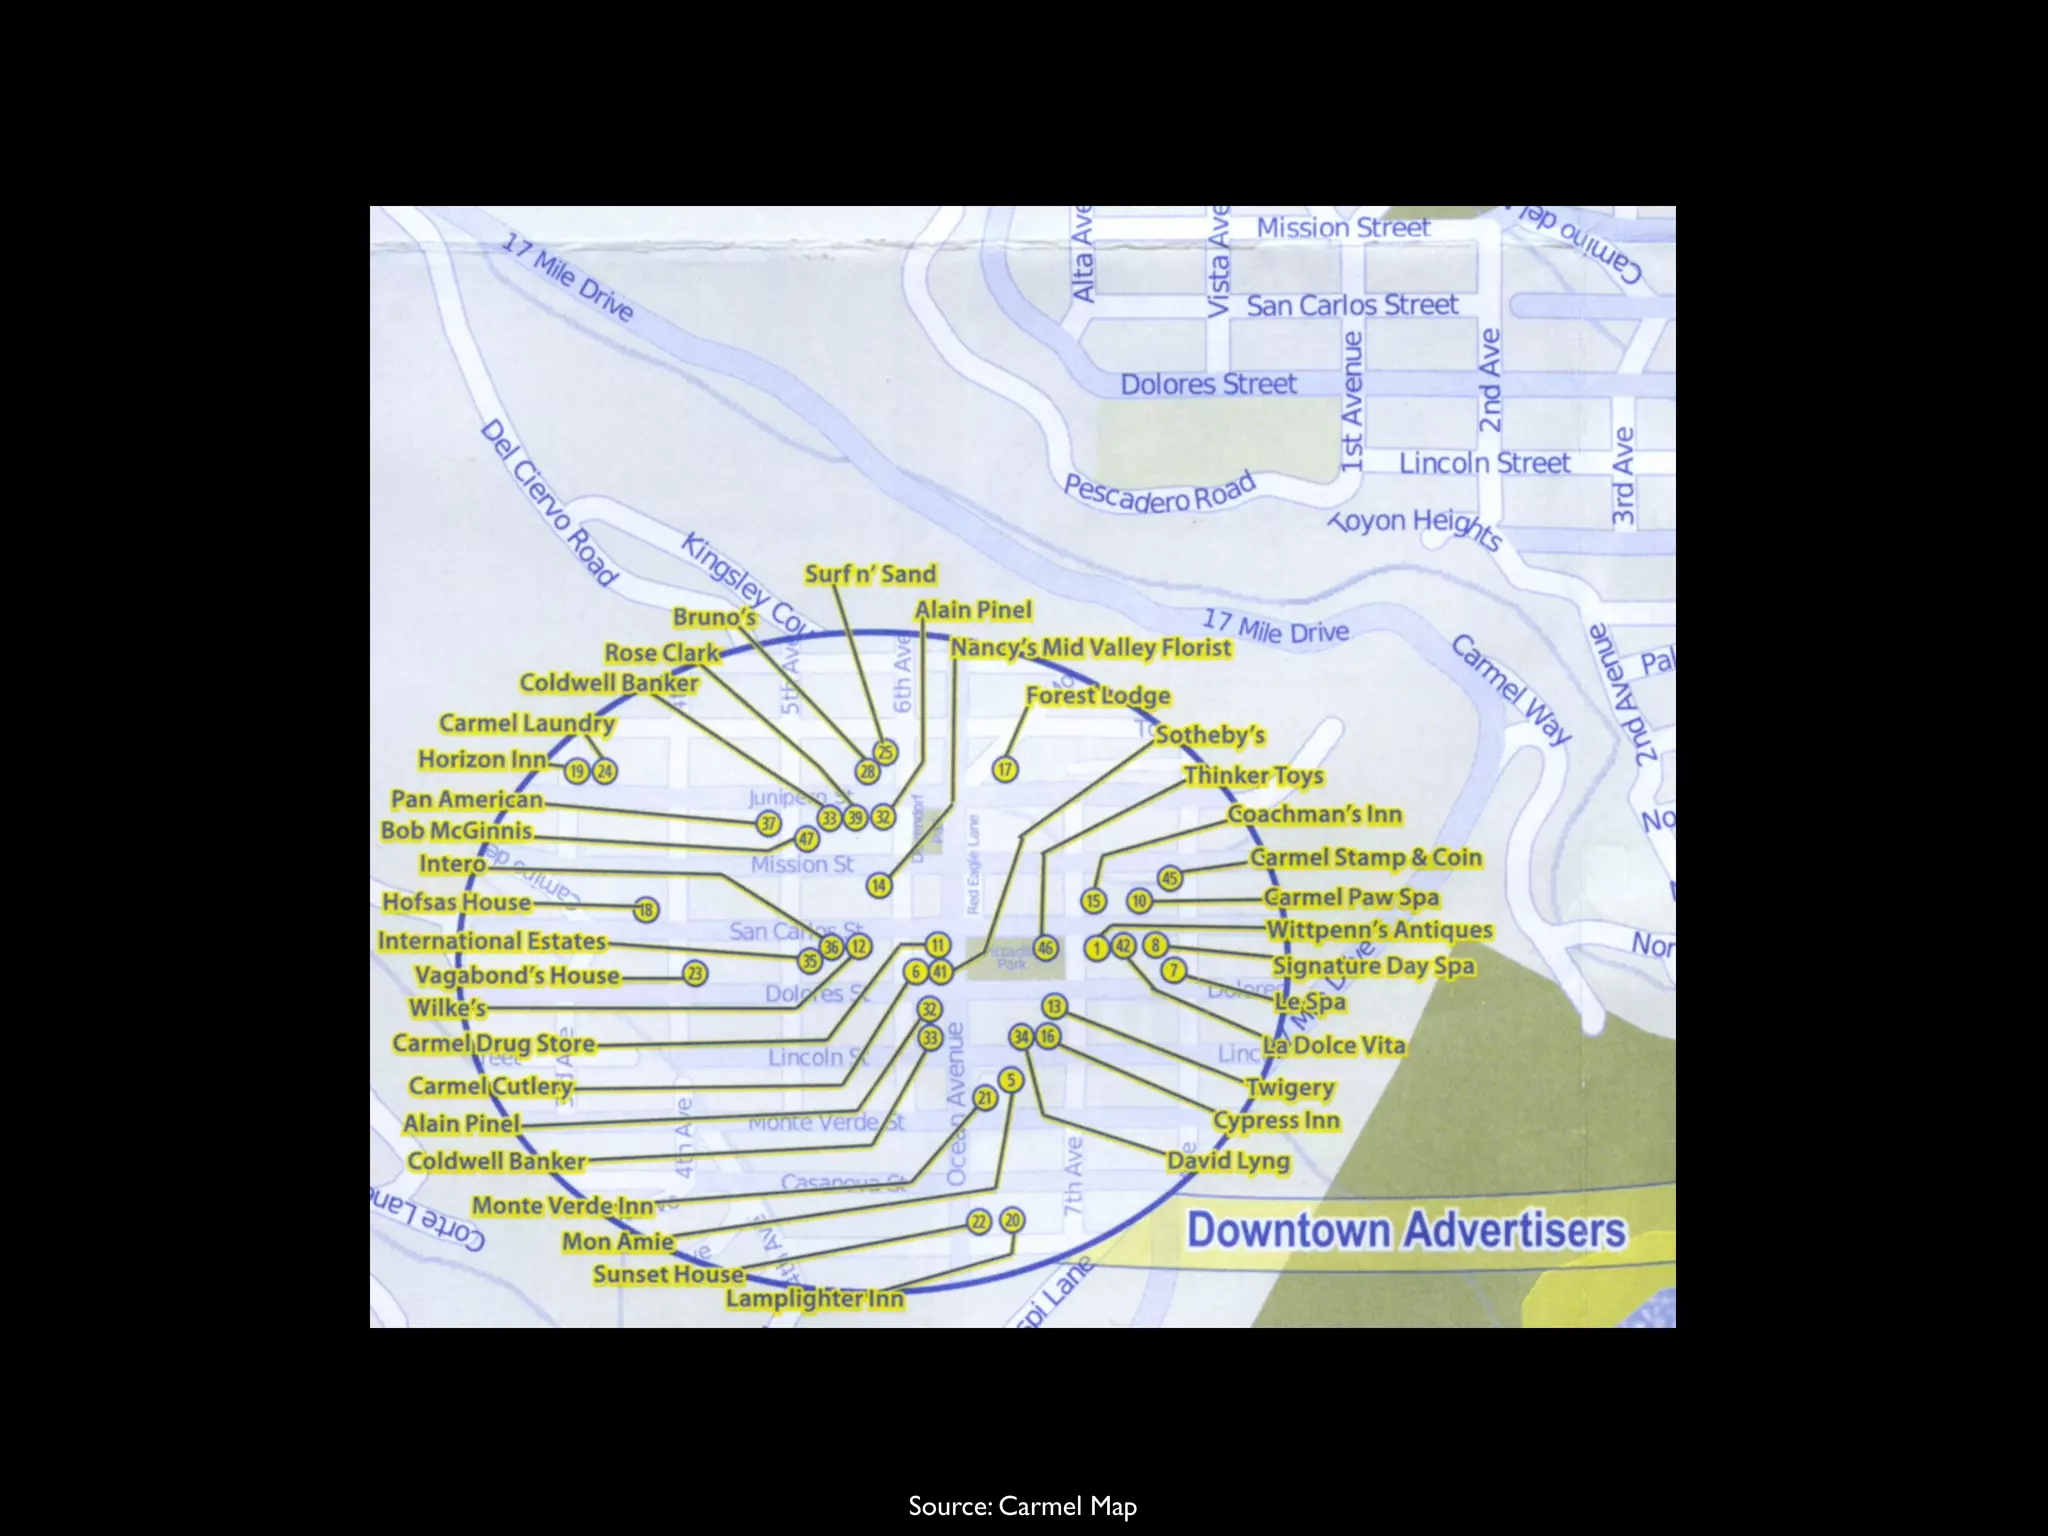

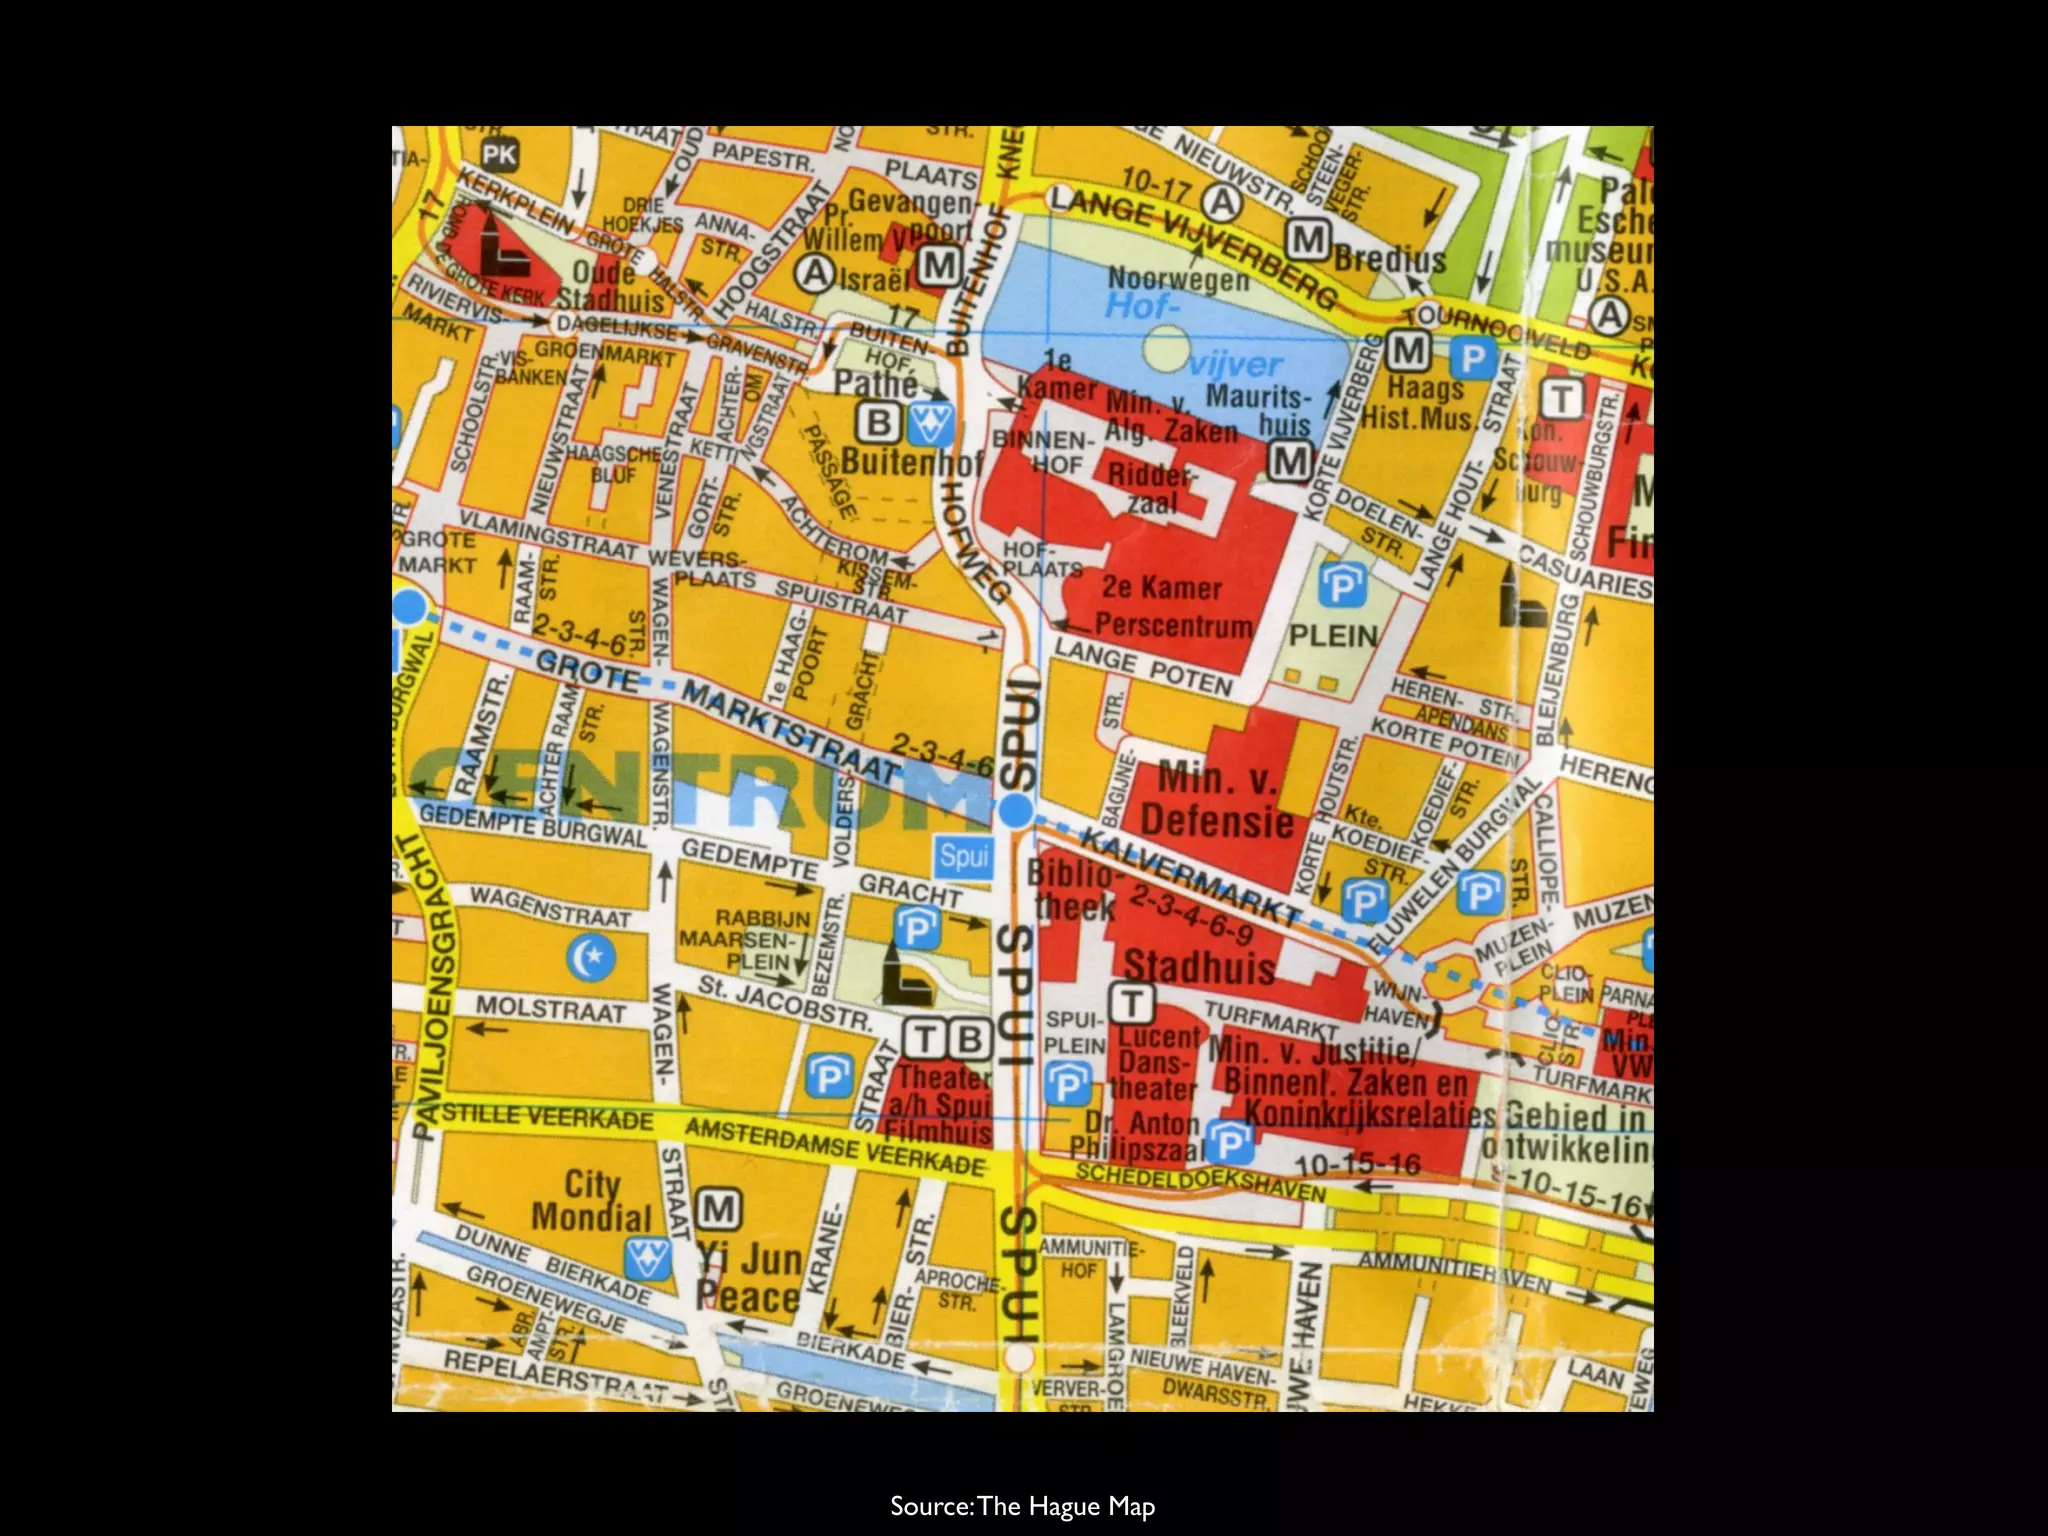

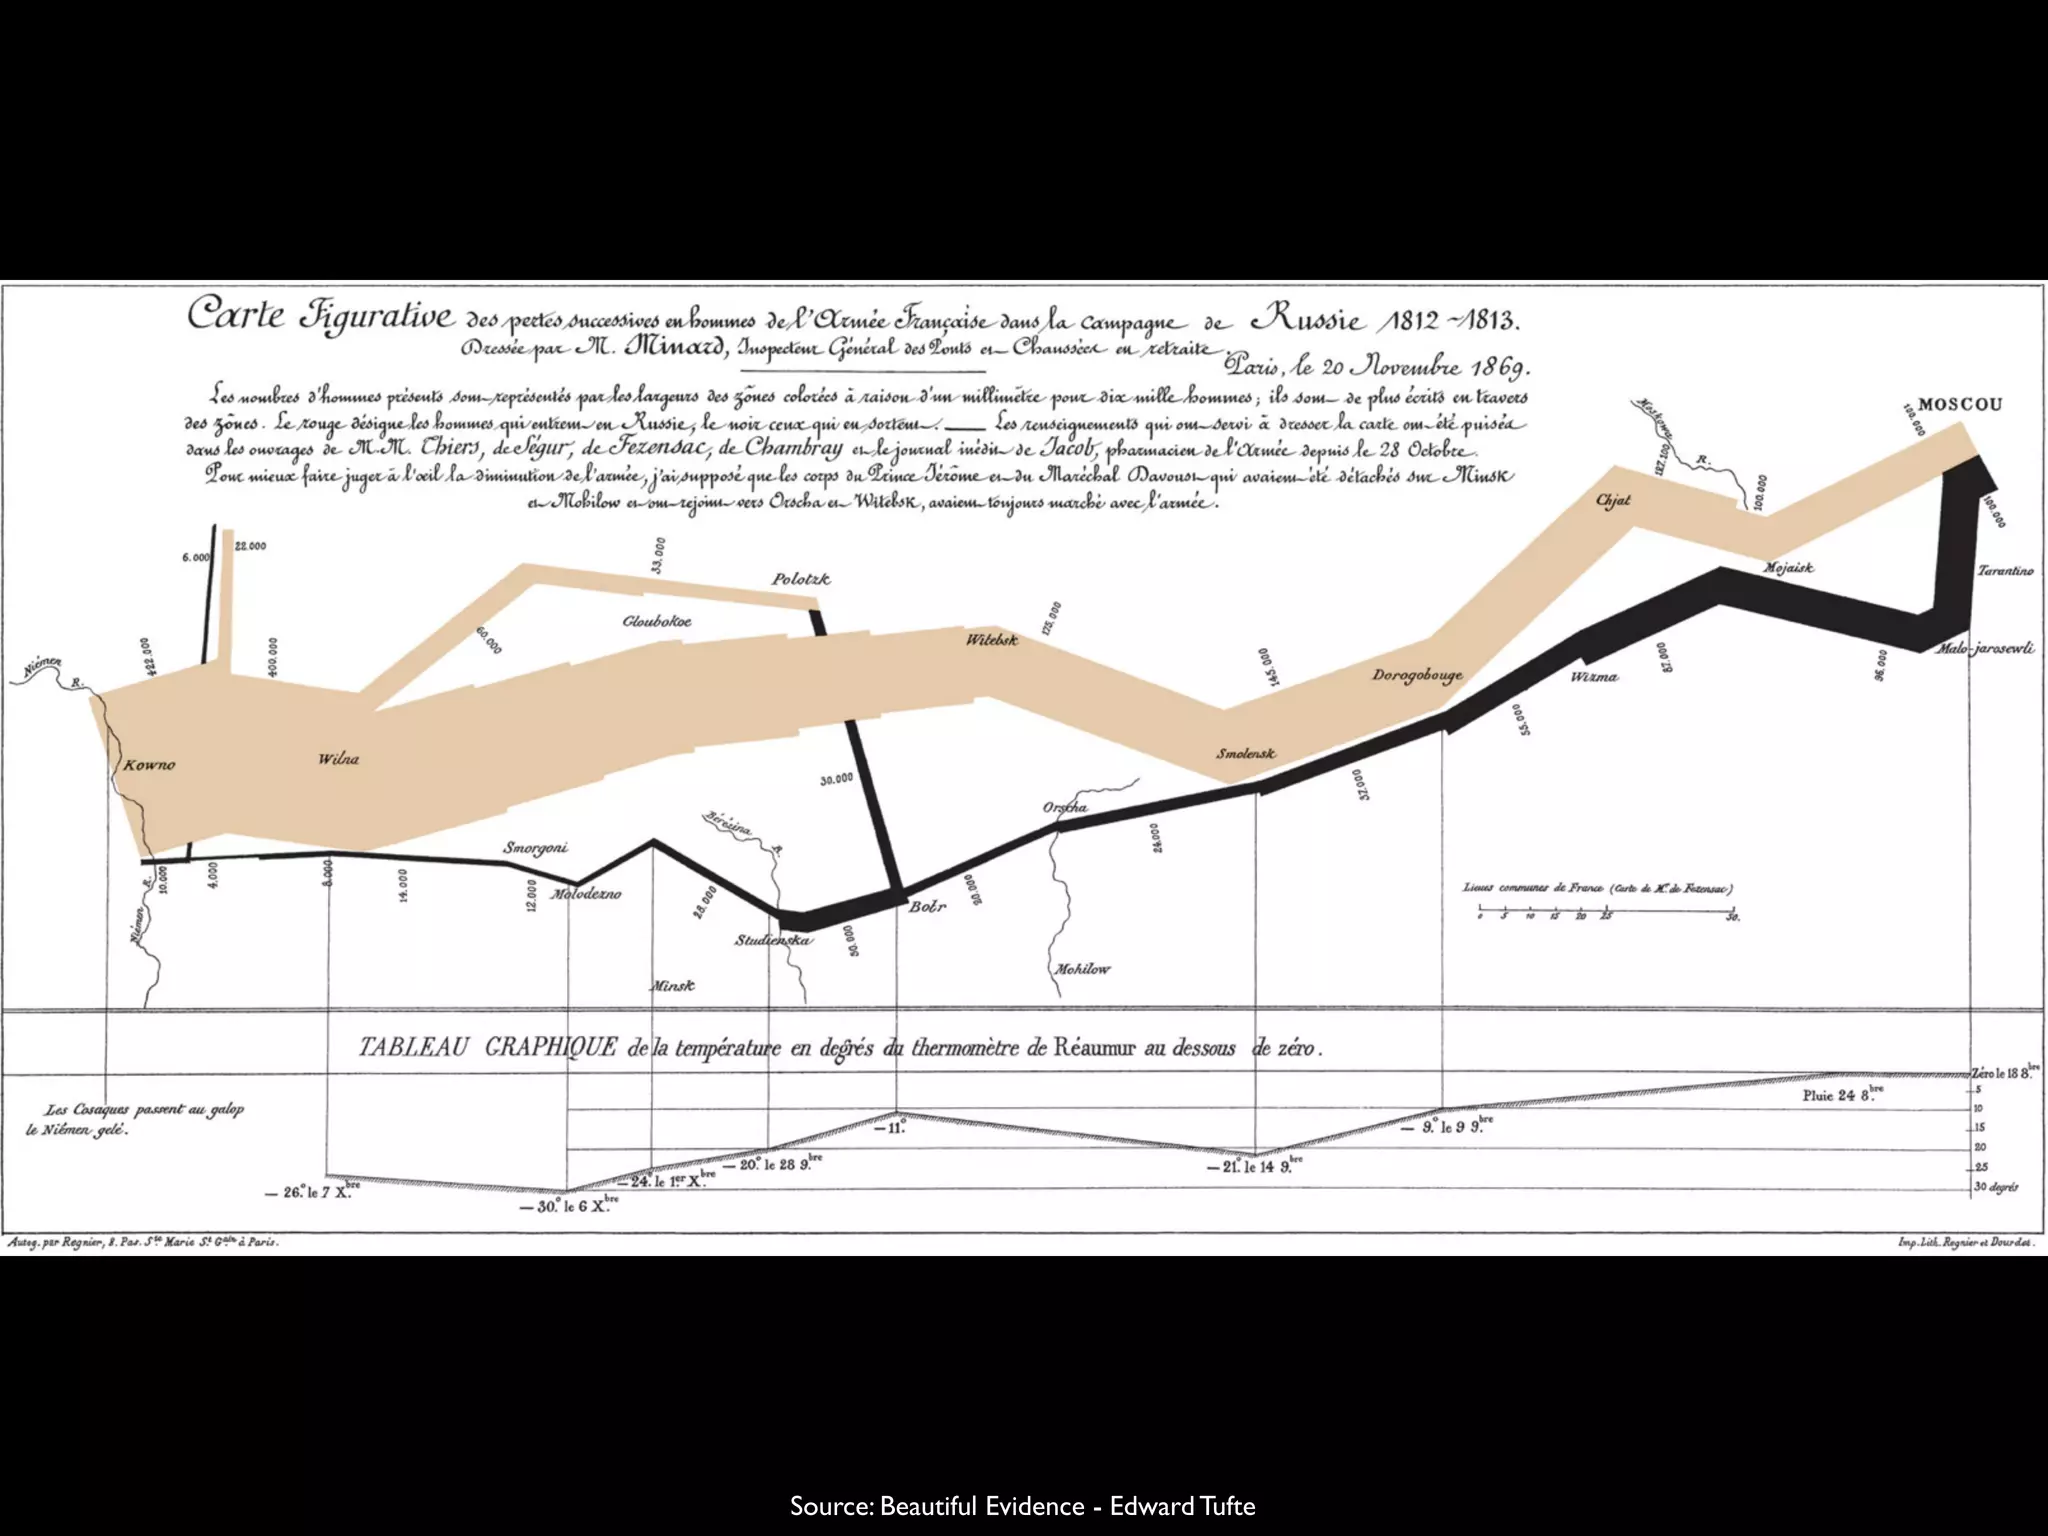


This document outlines six fundamental principles of analytical design according to Edward Tufte: 1) Show comparisons and contrasts 2) Show causality, mechanism, and explanation 3) Show multivariate data using more than one or two variables 4) Completely integrate words, numbers, images, and diagrams 5) Thoroughly describe the evidence, data sources, and measurement scales 6) Content is most important in analytical presentations It provides examples to illustrate each principle from various sources.


![Coded Agents – with UiPath SDK + LangGraph [Virtual Hands-on Workshop]](https://cdn.slidesharecdn.com/ss_thumbnails/codedagentsdeck-251215155422-5497c599-thumbnail.jpg?width=640&height=640&fit=bounds)


