Download as PDF, PPTX

![//Create application
PhiloGL('canvasId', {
program: {
from: 'uris',
vs: 'shader.vs.glsl',
fs: 'shader.fs.glsl'
},
camera: {
position: {
x: 0, y: 0, z: -50
}
},
textures: {
src: ['arroway.jpg', 'earth.jpg']
},
events: {
onDragMove: function(e) {
//do things...
},
onMouseWheel: function(e) {
//do things...
}
},
onError: function() {
alert("There was an error creating the app.");
},
onLoad: function(app) {
/* Do things here */
}
});](https://image.slidesharecdn.com/datavisualizationfortheweb-120420225707-phpapp01/85/Data-visualization-for-the-web-17-320.jpg)
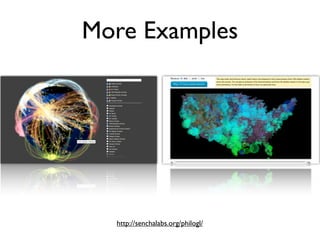

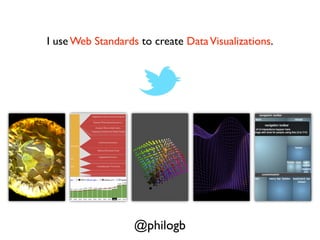
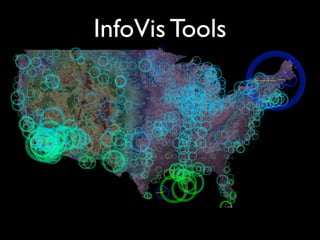
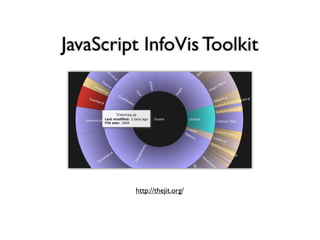
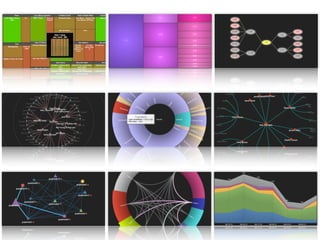
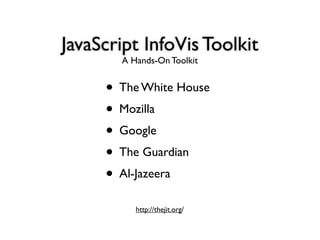
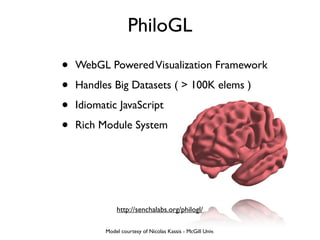
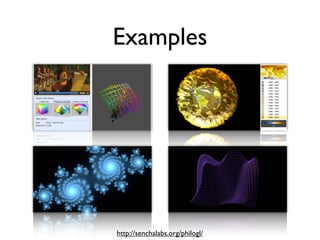
This document provides guidance on data visualization for the web. It discusses using web standards to create data visualizations and introduces several JavaScript libraries for data visualization, including the JavaScript InfoVis Toolkit and PhiloGL. Examples of these libraries are shown and the document provides links to further examples on using them to create interactive data visualizations on the web.