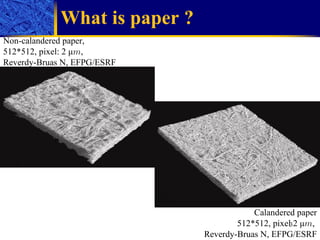
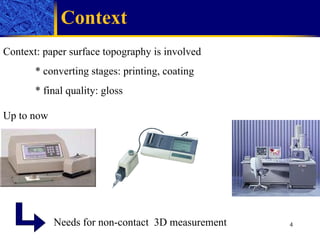
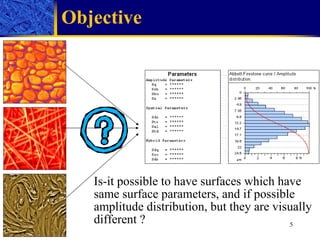
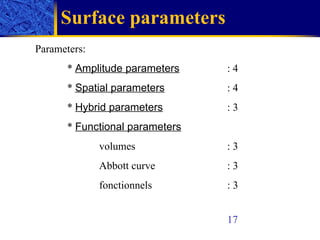
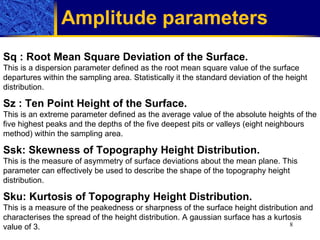
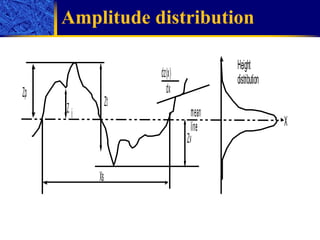
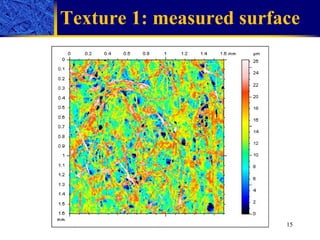
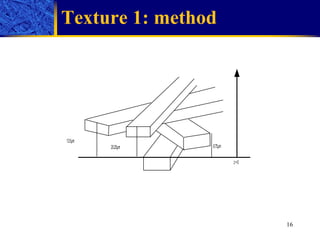
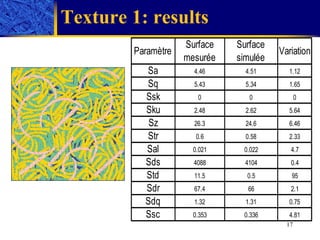
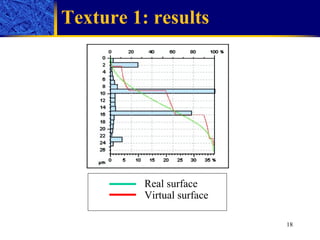
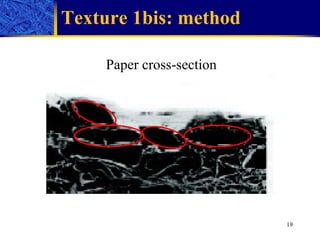
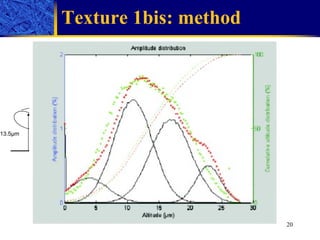
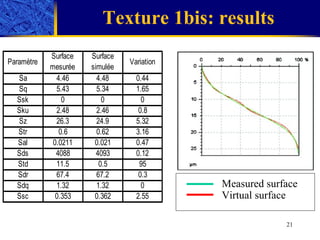
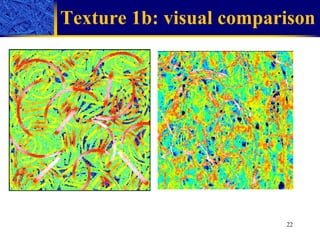
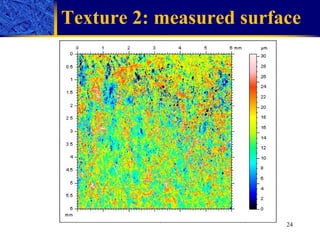
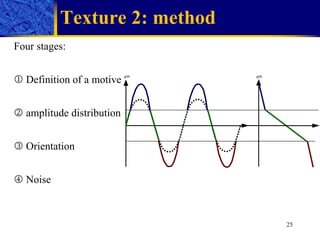
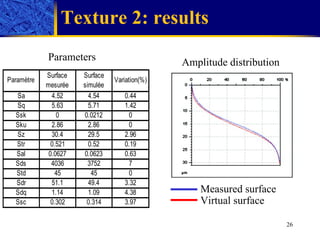
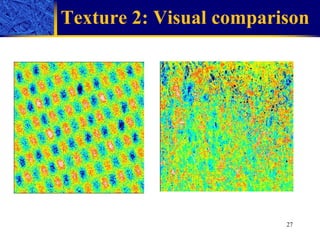
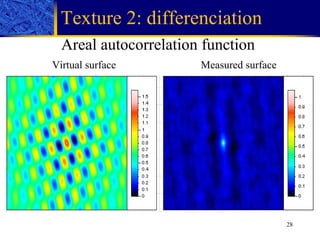
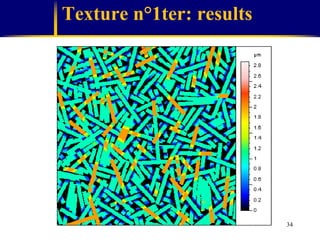
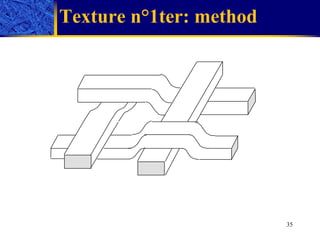
SlideShare a Scribd company logo
1 of 35
Are 3D surface standard parameters discriminant for paper ? Christophe Mercier Jean-Francis Bloch Contact: mercier.christophe1@googlemail.com
Outline    Context / Objectives    Definition of the surface parameters     Simulation    Conclusion / Perspectives
What is paper ? Non-c aland e r ed paper,  512*512, pixel:  2  μm ,  Reverdy-Bruas N , E FPG / ESRF Calandered p aper 512*512, pixel  2  μm ,  Reverdy-Bruas N, EFPG / ESRF
Context Context: paper surface topography is involved * converting stages: printing, coating * final quality: gloss Up to now Needs for non-contact  3D measurement
Objective Is-it possible to have surfaces which have same surface parameters, and if possible amplitude distribution, but they are visually different ?
Outline    Context / Objectives    Definition of the surface parameters     Simulation    Conclusion / Perspectives
Surface parameters Parameters: *  Amplitude parameters   : 4 *  Spatial parameters   : 4 *  Hybrid parameters   : 3 *  Functional parameters   volumes : 3   Abbott curve : 3 fonctionnels : 3 17
Amplitude parameters   Sq  :  Root Mean Square Deviation of the Surface. This is a dispersion parameter defined as the root mean square value of the surface departures within the sampling area. Statistically it the standard deviation of the height distribution. Sz  :  Ten Point Height of the Surface. This is an extreme parameter defined as the average value of the absolute heights of the five highest peaks and the depths of the five deepest pits or valleys (eight neighbours method) within the sampling  a rea. Ssk :  Skewness of Topography Height Distribution. This is the measure of asymmetry of surface deviations about the mean plane. This parameter can effectively be used to describe the shape of the topography height distribution.  Sku :  Kurtosis of Topography Height Distribution. This is a measure of the peakedness or sharpness of the surface height distribution and characterises the spread of the height distribution. A gaussian surface has a kurtosis value of 3.
Spatial parameters   Sds   Density of Summits of the Surface. This is the number of summits of a unit sampling area (eight neighbours method) Str Texture Aspect Ratio of the Surface This is a parameter used to identify texture strength i.e. uniformity of texture aspect. It is defined from auto-correlation function. Str can be defined as its ratio of the fastest to slowest decay to correlation lengt h Sal The Fastest Decay Auto-correlation Length.This is a  parameter in length dimension used to describe the auto-correlation character of the AACF. It is defined as the horizontal distance of the AACF which has the fastest decay to 0.2. In other words the Sal  Std Texture Direction of the Surface. This is the parameter used to determine the most pronounced direction of the surface texture with respect to the y axis within the frequency domain, i.e. it gives the lay direction of the surface.
Hybrid parameters   SDq Root mean square value of surface slope within the sampling area Ssc Arithmetic Mean Summit Curvature of the Surface. This is defined as the average of the principal curvatures of the summits within the sampling area. The sum of the curvatures of a surface at a point along any two orthogonal directions is equal to the sum  Sdr Developed Interfacial Area Ratio. This is the ratio of the increment of the interfacial area of a surface over the sampling area. The developed interfacial area ratio reflects the hybrid property of surfaces.
Functional parameters   Sbi Surface Bearing Index.  This is the ratio of the Sq parameter over the surface height at 5% bearing area. A larger surface bearing index indicates a good bearing property. Sci Core Fluid Retention Index.  This is the ratio of the void volume of the unit sampling area at the core zone (5% ~ 80% bearing area) over the Sq parameter. A larger Sci indicates a good fluid retention. For a Gaussian surface, this index is about 1.56. Svi Valley Fluid Retention Index.  This is the ratio of the void volume of the unit sampling area at the valley zone (80% ~ 100%) over the Sq parameter. A larger Svi indicates a good fluid retention in the valley zone. Sm   Material  Volume of the Surface. The material volume is defined as the material portion enclosed in the 10% bearing area and normalised to unity. The material volume and the material volume ratio are not only geometrical descriptors of the surface Sc Core Void Volume of the Surface.  A core void volume is enclosed from10% to 80% of surface bearing area and normalised to the unit sampling area. Sv Valley Void Volume of the Surface. The valley void volume of the unit sampling area is defined as a void volume at the valley zone from 80% to 100% surface bearing area. The void volume is proposed here to provide a direct inspection of lubrication and fl
Selected Surface Parameters Parameters: *  Amplitude parameters   : 4 *  Spatial parameters   : 4 *  Hybrid parameters   : 3 11
Amplitude distribution
Outline    Context / Objectives    Definition of the surface parameters     Simulation Texture 1 Texture 2    Conclusion / Perspectives
Texture 1: measured surface
Texture 1: method
Texture 1: results
Texture 1: results Real surface Virtual surface
Texture 1bis: method Paper cross-section
Texture 1bis: method z = 0 6.75µm 13.5µm 20.25µm
Texture 1bis: results Measured surface Virtual surface
Texture 1b: visual comparison
Outline    Context / Objectives    Definition of the surface parameters     Simulation Texture 1 Texture 2    Conclusion / Perspectives
Texture 2: measured surface
Texture 2: method µm µm Four stages:    Definition of a motive    amplitude distribution    Orientation    Noise
Texture 2: results Parameters Amplitude distribution Measured surface Virtual surface
Texture 2: Visual comparison
Texture 2: differenciation Areal autocorrelation function  Virtual surface Measured surface
Outline    Context / Objectives    Definition of the surface parameters     Simulation    Conclusion / Perspectives
Conclusion S imulations  proove : S urfaces could have  comparable  *  standard parameters  * amplitude distributions and exhibit  different visual aspects.
Perspectives I n the case of paper surface , t he control of topography needs further improvements. Hence, considering only the used parameters,  classical in  surface quality control, one could conclude that the different   surfaces are similar.
Acknowledgments
Questions
Texture n°1ter: results
Texture n°1ter: method

More Related Content

What's hot

Interpolation techniques in ArcGIS
Interpolation techniques in ArcGISInterpolation techniques in ArcGIS
Interpolation techniques in ArcGISHarsha Chamara
 
Drawing Sketch Maps of O.S. Maps and Aerial Photographs
Drawing Sketch Maps of O.S. Maps and Aerial PhotographsDrawing Sketch Maps of O.S. Maps and Aerial Photographs
Drawing Sketch Maps of O.S. Maps and Aerial PhotographsAisling O Connor
 
Ce6304 surveying 1 contour (iv unit) lecture ppt notes
Ce6304 surveying 1   contour (iv unit) lecture ppt notesCe6304 surveying 1   contour (iv unit) lecture ppt notes
Ce6304 surveying 1 contour (iv unit) lecture ppt notesnandishsajjan
 
APPLICATION OF KRIGING IN GROUND WATER STUDIES
APPLICATION OF KRIGING IN GROUND WATER STUDIESAPPLICATION OF KRIGING IN GROUND WATER STUDIES
APPLICATION OF KRIGING IN GROUND WATER STUDIESAbhiram Kanigolla
 
The Turbidity (TB) Varies with Time And Space in The Reservoir Using GWR And ...
The Turbidity (TB) Varies with Time And Space in The Reservoir Using GWR And ...The Turbidity (TB) Varies with Time And Space in The Reservoir Using GWR And ...
The Turbidity (TB) Varies with Time And Space in The Reservoir Using GWR And ...National Cheng Kung University
 
Contouring in "Survey & Levelling".
Contouring in "Survey & Levelling".Contouring in "Survey & Levelling".
Contouring in "Survey & Levelling".Ar. Avitesh
 
A statistical assessment of GDEM using LiDAR data
A statistical assessment of GDEM using LiDAR dataA statistical assessment of GDEM using LiDAR data
A statistical assessment of GDEM using LiDAR dataTomislav Hengl
 
Spatial interpolation comparison
Spatial interpolation comparisonSpatial interpolation comparison
Spatial interpolation comparisonTomislav Hengl
 
Contours on OS Maps
Contours on OS MapsContours on OS Maps
Contours on OS MapsMr Dowdican
 
Surveying ( introduction )
Surveying ( introduction )Surveying ( introduction )
Surveying ( introduction )laxman singh
 
FR3.TO5.2.pptx
FR3.TO5.2.pptxFR3.TO5.2.pptx
FR3.TO5.2.pptxgrssieee
 
Contour lines - Survey & Levelling
Contour lines - Survey & LevellingContour lines - Survey & Levelling
Contour lines - Survey & LevellingAr. Avitesh
 
Scale - Geography Skill
Scale - Geography SkillScale - Geography Skill
Scale - Geography SkillMr Shipp
 
Introduction geostatistic for_mineral_resources
Introduction geostatistic for_mineral_resourcesIntroduction geostatistic for_mineral_resources
Introduction geostatistic for_mineral_resourcesAdi Handarbeni
 

What's hot (20)

Interpolation techniques in ArcGIS
Interpolation techniques in ArcGISInterpolation techniques in ArcGIS
Interpolation techniques in ArcGIS
 
Taramelli Melelli
Taramelli MelelliTaramelli Melelli
Taramelli Melelli
 
Drawing Sketch Maps of O.S. Maps and Aerial Photographs
Drawing Sketch Maps of O.S. Maps and Aerial PhotographsDrawing Sketch Maps of O.S. Maps and Aerial Photographs
Drawing Sketch Maps of O.S. Maps and Aerial Photographs
 
Map reading
Map readingMap reading
Map reading
 
Ce6304 surveying 1 contour (iv unit) lecture ppt notes
Ce6304 surveying 1   contour (iv unit) lecture ppt notesCe6304 surveying 1   contour (iv unit) lecture ppt notes
Ce6304 surveying 1 contour (iv unit) lecture ppt notes
 
APPLICATION OF KRIGING IN GROUND WATER STUDIES
APPLICATION OF KRIGING IN GROUND WATER STUDIESAPPLICATION OF KRIGING IN GROUND WATER STUDIES
APPLICATION OF KRIGING IN GROUND WATER STUDIES
 
The Turbidity (TB) Varies with Time And Space in The Reservoir Using GWR And ...
The Turbidity (TB) Varies with Time And Space in The Reservoir Using GWR And ...The Turbidity (TB) Varies with Time And Space in The Reservoir Using GWR And ...
The Turbidity (TB) Varies with Time And Space in The Reservoir Using GWR And ...
 
Contouring in "Survey & Levelling".
Contouring in "Survey & Levelling".Contouring in "Survey & Levelling".
Contouring in "Survey & Levelling".
 
A statistical assessment of GDEM using LiDAR data
A statistical assessment of GDEM using LiDAR dataA statistical assessment of GDEM using LiDAR data
A statistical assessment of GDEM using LiDAR data
 
Surveying (introduction)
Surveying (introduction)Surveying (introduction)
Surveying (introduction)
 
PROJECTS ON SURVEYING
PROJECTS ON SURVEYINGPROJECTS ON SURVEYING
PROJECTS ON SURVEYING
 
Spatial interpolation comparison
Spatial interpolation comparisonSpatial interpolation comparison
Spatial interpolation comparison
 
Contours on OS Maps
Contours on OS MapsContours on OS Maps
Contours on OS Maps
 
Surveying ( introduction )
Surveying ( introduction )Surveying ( introduction )
Surveying ( introduction )
 
FR3.TO5.2.pptx
FR3.TO5.2.pptxFR3.TO5.2.pptx
FR3.TO5.2.pptx
 
Map Reading
Map ReadingMap Reading
Map Reading
 
Contour lines - Survey & Levelling
Contour lines - Survey & LevellingContour lines - Survey & Levelling
Contour lines - Survey & Levelling
 
Introduction to surveying
Introduction to surveyingIntroduction to surveying
Introduction to surveying
 
Scale - Geography Skill
Scale - Geography SkillScale - Geography Skill
Scale - Geography Skill
 
Introduction geostatistic for_mineral_resources
Introduction geostatistic for_mineral_resourcesIntroduction geostatistic for_mineral_resources
Introduction geostatistic for_mineral_resources
 

Similar to Are 3D surface standard parameters discriminant for paper ?

Mechanical Measurement & Metrology - Surface finish.
Mechanical Measurement & Metrology - Surface finish.Mechanical Measurement & Metrology - Surface finish.
Mechanical Measurement & Metrology - Surface finish.Darshan Panchal
 
Mmm SURFACE FINISH MECHANICAL MEASUREMENTS
Mmm SURFACE FINISH MECHANICAL MEASUREMENTSMmm SURFACE FINISH MECHANICAL MEASUREMENTS
Mmm SURFACE FINISH MECHANICAL MEASUREMENTSJaimin Patel
 
Method of Fracture Surface Matching Based on Mathematical Statistics
Method of Fracture Surface Matching Based on Mathematical StatisticsMethod of Fracture Surface Matching Based on Mathematical Statistics
Method of Fracture Surface Matching Based on Mathematical StatisticsIJRESJOURNAL
 
Metrology surface roughness.pptx
Metrology surface roughness.pptxMetrology surface roughness.pptx
Metrology surface roughness.pptxKarthik RK
 
Interpolation 2013
Interpolation 2013Interpolation 2013
Interpolation 2013Atiqa Khan
 
Barber_TU2.T03_hk_mb_casa_fg_hk_FINAL.pptx
Barber_TU2.T03_hk_mb_casa_fg_hk_FINAL.pptxBarber_TU2.T03_hk_mb_casa_fg_hk_FINAL.pptx
Barber_TU2.T03_hk_mb_casa_fg_hk_FINAL.pptxgrssieee
 
Igarss-Slides-2011-Fung.ppt
Igarss-Slides-2011-Fung.pptIgarss-Slides-2011-Fung.ppt
Igarss-Slides-2011-Fung.pptgrssieee
 
Igarss-Slides-2011-Fung.ppt
Igarss-Slides-2011-Fung.pptIgarss-Slides-2011-Fung.ppt
Igarss-Slides-2011-Fung.pptgrssieee
 
Igarss-Slides-2011-Fung.ppt
Igarss-Slides-2011-Fung.pptIgarss-Slides-2011-Fung.ppt
Igarss-Slides-2011-Fung.pptgrssieee
 
IE 335 Experiment No.7.pptx
IE 335 Experiment No.7.pptxIE 335 Experiment No.7.pptx
IE 335 Experiment No.7.pptxMateelHaddad1
 
Effect of Surface Roughness on Contact Pressure
Effect of Surface Roughness on Contact PressureEffect of Surface Roughness on Contact Pressure
Effect of Surface Roughness on Contact Pressureijsrd.com
 
Digital Soil Mapping/ Pedomterics
Digital Soil Mapping/ Pedomterics Digital Soil Mapping/ Pedomterics
Digital Soil Mapping/ Pedomterics Soils FAO-GSP
 
Nano Scale Roughness Quantification
Nano Scale Roughness QuantificationNano Scale Roughness Quantification
Nano Scale Roughness QuantificationPratham Ghael
 
A Method for Determining and Improving the Horizontal Accuracy of Geospatial ...
A Method for Determining and Improving the Horizontal Accuracy of Geospatial ...A Method for Determining and Improving the Horizontal Accuracy of Geospatial ...
A Method for Determining and Improving the Horizontal Accuracy of Geospatial ...Juan Tobar
 
ANALYSIS OF LAND SURFACE DEFORMATION GRADIENT BY DINSAR
ANALYSIS OF LAND SURFACE DEFORMATION GRADIENT BY DINSAR ANALYSIS OF LAND SURFACE DEFORMATION GRADIENT BY DINSAR
ANALYSIS OF LAND SURFACE DEFORMATION GRADIENT BY DINSAR cscpconf
 
Evolution of 3D Surface Parameters: A Comprehensive Survey
Evolution of 3D Surface Parameters: A Comprehensive SurveyEvolution of 3D Surface Parameters: A Comprehensive Survey
Evolution of 3D Surface Parameters: A Comprehensive Surveytheijes
 
S S S A2009 Simulation Study Of Segmentation
S S S A2009 Simulation Study Of SegmentationS S S A2009 Simulation Study Of Segmentation
S S S A2009 Simulation Study Of SegmentationWei Wang
 

Similar to Are 3D surface standard parameters discriminant for paper ? (20)

Mechanical Measurement & Metrology - Surface finish.
Mechanical Measurement & Metrology - Surface finish.Mechanical Measurement & Metrology - Surface finish.
Mechanical Measurement & Metrology - Surface finish.
 
Mmm SURFACE FINISH MECHANICAL MEASUREMENTS
Mmm SURFACE FINISH MECHANICAL MEASUREMENTSMmm SURFACE FINISH MECHANICAL MEASUREMENTS
Mmm SURFACE FINISH MECHANICAL MEASUREMENTS
 
Method of Fracture Surface Matching Based on Mathematical Statistics
Method of Fracture Surface Matching Based on Mathematical StatisticsMethod of Fracture Surface Matching Based on Mathematical Statistics
Method of Fracture Surface Matching Based on Mathematical Statistics
 
Metrology surface roughness.pptx
Metrology surface roughness.pptxMetrology surface roughness.pptx
Metrology surface roughness.pptx
 
Interpolation 2013
Interpolation 2013Interpolation 2013
Interpolation 2013
 
Barber_TU2.T03_hk_mb_casa_fg_hk_FINAL.pptx
Barber_TU2.T03_hk_mb_casa_fg_hk_FINAL.pptxBarber_TU2.T03_hk_mb_casa_fg_hk_FINAL.pptx
Barber_TU2.T03_hk_mb_casa_fg_hk_FINAL.pptx
 
Igarss-Slides-2011-Fung.ppt
Igarss-Slides-2011-Fung.pptIgarss-Slides-2011-Fung.ppt
Igarss-Slides-2011-Fung.ppt
 
Igarss-Slides-2011-Fung.ppt
Igarss-Slides-2011-Fung.pptIgarss-Slides-2011-Fung.ppt
Igarss-Slides-2011-Fung.ppt
 
Igarss-Slides-2011-Fung.ppt
Igarss-Slides-2011-Fung.pptIgarss-Slides-2011-Fung.ppt
Igarss-Slides-2011-Fung.ppt
 
IE 335 Experiment No.7.pptx
IE 335 Experiment No.7.pptxIE 335 Experiment No.7.pptx
IE 335 Experiment No.7.pptx
 
Effect of Surface Roughness on Contact Pressure
Effect of Surface Roughness on Contact PressureEffect of Surface Roughness on Contact Pressure
Effect of Surface Roughness on Contact Pressure
 
LECTURE 9.pptx
LECTURE 9.pptxLECTURE 9.pptx
LECTURE 9.pptx
 
B05720509
B05720509B05720509
B05720509
 
Digital Soil Mapping/ Pedomterics
Digital Soil Mapping/ Pedomterics Digital Soil Mapping/ Pedomterics
Digital Soil Mapping/ Pedomterics
 
Nano Scale Roughness Quantification
Nano Scale Roughness QuantificationNano Scale Roughness Quantification
Nano Scale Roughness Quantification
 
A Method for Determining and Improving the Horizontal Accuracy of Geospatial ...
A Method for Determining and Improving the Horizontal Accuracy of Geospatial ...A Method for Determining and Improving the Horizontal Accuracy of Geospatial ...
A Method for Determining and Improving the Horizontal Accuracy of Geospatial ...
 
ANALYSIS OF LAND SURFACE DEFORMATION GRADIENT BY DINSAR
ANALYSIS OF LAND SURFACE DEFORMATION GRADIENT BY DINSAR ANALYSIS OF LAND SURFACE DEFORMATION GRADIENT BY DINSAR
ANALYSIS OF LAND SURFACE DEFORMATION GRADIENT BY DINSAR
 
Evolution of 3D Surface Parameters: A Comprehensive Survey
Evolution of 3D Surface Parameters: A Comprehensive SurveyEvolution of 3D Surface Parameters: A Comprehensive Survey
Evolution of 3D Surface Parameters: A Comprehensive Survey
 
GEOSTATISTICAL_ANALYST
GEOSTATISTICAL_ANALYSTGEOSTATISTICAL_ANALYST
GEOSTATISTICAL_ANALYST
 
S S S A2009 Simulation Study Of Segmentation
S S S A2009 Simulation Study Of SegmentationS S S A2009 Simulation Study Of Segmentation
S S S A2009 Simulation Study Of Segmentation
 

More from Christophe Mercier

Open source print quality software
Open source print quality softwareOpen source print quality software
Open source print quality softwareChristophe Mercier
 
Characterisation of the properties use of paper by topographical analysis of ...
Characterisation of the properties use of paper by topographical analysis of ...Characterisation of the properties use of paper by topographical analysis of ...
Characterisation of the properties use of paper by topographical analysis of ...Christophe Mercier
 
Generalised description of the three-dimensional structure of paper
Generalised description of the three-dimensional structure of paperGeneralised description of the three-dimensional structure of paper
Generalised description of the three-dimensional structure of paperChristophe Mercier
 

More from Christophe Mercier (7)

Open source print quality software
Open source print quality softwareOpen source print quality software
Open source print quality software
 
These mercier christophe
These mercier christopheThese mercier christophe
These mercier christophe
 
Nip 25 mercier_ch
Nip 25 mercier_chNip 25 mercier_ch
Nip 25 mercier_ch
 
MindMapping Skills
MindMapping SkillsMindMapping Skills
MindMapping Skills
 
Virtual Printingl
Virtual PrintinglVirtual Printingl
Virtual Printingl
 
Characterisation of the properties use of paper by topographical analysis of ...
Characterisation of the properties use of paper by topographical analysis of ...Characterisation of the properties use of paper by topographical analysis of ...
Characterisation of the properties use of paper by topographical analysis of ...
 
Generalised description of the three-dimensional structure of paper
Generalised description of the three-dimensional structure of paperGeneralised description of the three-dimensional structure of paper
Generalised description of the three-dimensional structure of paper
 

Are 3D surface standard parameters discriminant for paper ?

  • 1. Are 3D surface standard parameters discriminant for paper ? Christophe Mercier Jean-Francis Bloch Contact: mercier.christophe1@googlemail.com
  • 2. Outline  Context / Objectives  Definition of the surface parameters  Simulation  Conclusion / Perspectives
  • 3. What is paper ? Non-c aland e r ed paper, 512*512, pixel: 2 μm , Reverdy-Bruas N , E FPG / ESRF Calandered p aper 512*512, pixel 2 μm , Reverdy-Bruas N, EFPG / ESRF
  • 4. Context Context: paper surface topography is involved * converting stages: printing, coating * final quality: gloss Up to now Needs for non-contact 3D measurement
  • 5. Objective Is-it possible to have surfaces which have same surface parameters, and if possible amplitude distribution, but they are visually different ?
  • 6. Outline  Context / Objectives  Definition of the surface parameters  Simulation  Conclusion / Perspectives
  • 7. Surface parameters Parameters: * Amplitude parameters : 4 * Spatial parameters : 4 * Hybrid parameters : 3 * Functional parameters volumes : 3 Abbott curve : 3 fonctionnels : 3 17
  • 8. Amplitude parameters Sq : Root Mean Square Deviation of the Surface. This is a dispersion parameter defined as the root mean square value of the surface departures within the sampling area. Statistically it the standard deviation of the height distribution. Sz : Ten Point Height of the Surface. This is an extreme parameter defined as the average value of the absolute heights of the five highest peaks and the depths of the five deepest pits or valleys (eight neighbours method) within the sampling a rea. Ssk : Skewness of Topography Height Distribution. This is the measure of asymmetry of surface deviations about the mean plane. This parameter can effectively be used to describe the shape of the topography height distribution. Sku : Kurtosis of Topography Height Distribution. This is a measure of the peakedness or sharpness of the surface height distribution and characterises the spread of the height distribution. A gaussian surface has a kurtosis value of 3.
  • 9. Spatial parameters Sds Density of Summits of the Surface. This is the number of summits of a unit sampling area (eight neighbours method) Str Texture Aspect Ratio of the Surface This is a parameter used to identify texture strength i.e. uniformity of texture aspect. It is defined from auto-correlation function. Str can be defined as its ratio of the fastest to slowest decay to correlation lengt h Sal The Fastest Decay Auto-correlation Length.This is a parameter in length dimension used to describe the auto-correlation character of the AACF. It is defined as the horizontal distance of the AACF which has the fastest decay to 0.2. In other words the Sal Std Texture Direction of the Surface. This is the parameter used to determine the most pronounced direction of the surface texture with respect to the y axis within the frequency domain, i.e. it gives the lay direction of the surface.
  • 10. Hybrid parameters SDq Root mean square value of surface slope within the sampling area Ssc Arithmetic Mean Summit Curvature of the Surface. This is defined as the average of the principal curvatures of the summits within the sampling area. The sum of the curvatures of a surface at a point along any two orthogonal directions is equal to the sum Sdr Developed Interfacial Area Ratio. This is the ratio of the increment of the interfacial area of a surface over the sampling area. The developed interfacial area ratio reflects the hybrid property of surfaces.
  • 11. Functional parameters Sbi Surface Bearing Index. This is the ratio of the Sq parameter over the surface height at 5% bearing area. A larger surface bearing index indicates a good bearing property. Sci Core Fluid Retention Index. This is the ratio of the void volume of the unit sampling area at the core zone (5% ~ 80% bearing area) over the Sq parameter. A larger Sci indicates a good fluid retention. For a Gaussian surface, this index is about 1.56. Svi Valley Fluid Retention Index. This is the ratio of the void volume of the unit sampling area at the valley zone (80% ~ 100%) over the Sq parameter. A larger Svi indicates a good fluid retention in the valley zone. Sm Material Volume of the Surface. The material volume is defined as the material portion enclosed in the 10% bearing area and normalised to unity. The material volume and the material volume ratio are not only geometrical descriptors of the surface Sc Core Void Volume of the Surface. A core void volume is enclosed from10% to 80% of surface bearing area and normalised to the unit sampling area. Sv Valley Void Volume of the Surface. The valley void volume of the unit sampling area is defined as a void volume at the valley zone from 80% to 100% surface bearing area. The void volume is proposed here to provide a direct inspection of lubrication and fl
  • 12. Selected Surface Parameters Parameters: * Amplitude parameters : 4 * Spatial parameters : 4 * Hybrid parameters : 3 11
  • 14. Outline  Context / Objectives  Definition of the surface parameters  Simulation Texture 1 Texture 2  Conclusion / Perspectives
  • 18. Texture 1: results Real surface Virtual surface
  • 19. Texture 1bis: method Paper cross-section
  • 20. Texture 1bis: method z = 0 6.75µm 13.5µm 20.25µm
  • 21. Texture 1bis: results Measured surface Virtual surface
  • 22. Texture 1b: visual comparison
  • 23. Outline  Context / Objectives  Definition of the surface parameters  Simulation Texture 1 Texture 2  Conclusion / Perspectives
  • 25. Texture 2: method µm µm Four stages:  Definition of a motive  amplitude distribution  Orientation  Noise
  • 26. Texture 2: results Parameters Amplitude distribution Measured surface Virtual surface
  • 27. Texture 2: Visual comparison
  • 28. Texture 2: differenciation Areal autocorrelation function Virtual surface Measured surface
  • 29. Outline  Context / Objectives  Definition of the surface parameters  Simulation  Conclusion / Perspectives
  • 30. Conclusion S imulations proove : S urfaces could have comparable * standard parameters * amplitude distributions and exhibit different visual aspects.
  • 31. Perspectives I n the case of paper surface , t he control of topography needs further improvements. Hence, considering only the used parameters, classical in surface quality control, one could conclude that the different surfaces are similar.

Editor's Notes

  1. Situé entre la présentation des outils et leur utilisation au chapitre 6, un chapitre est consacré à leur connaissance