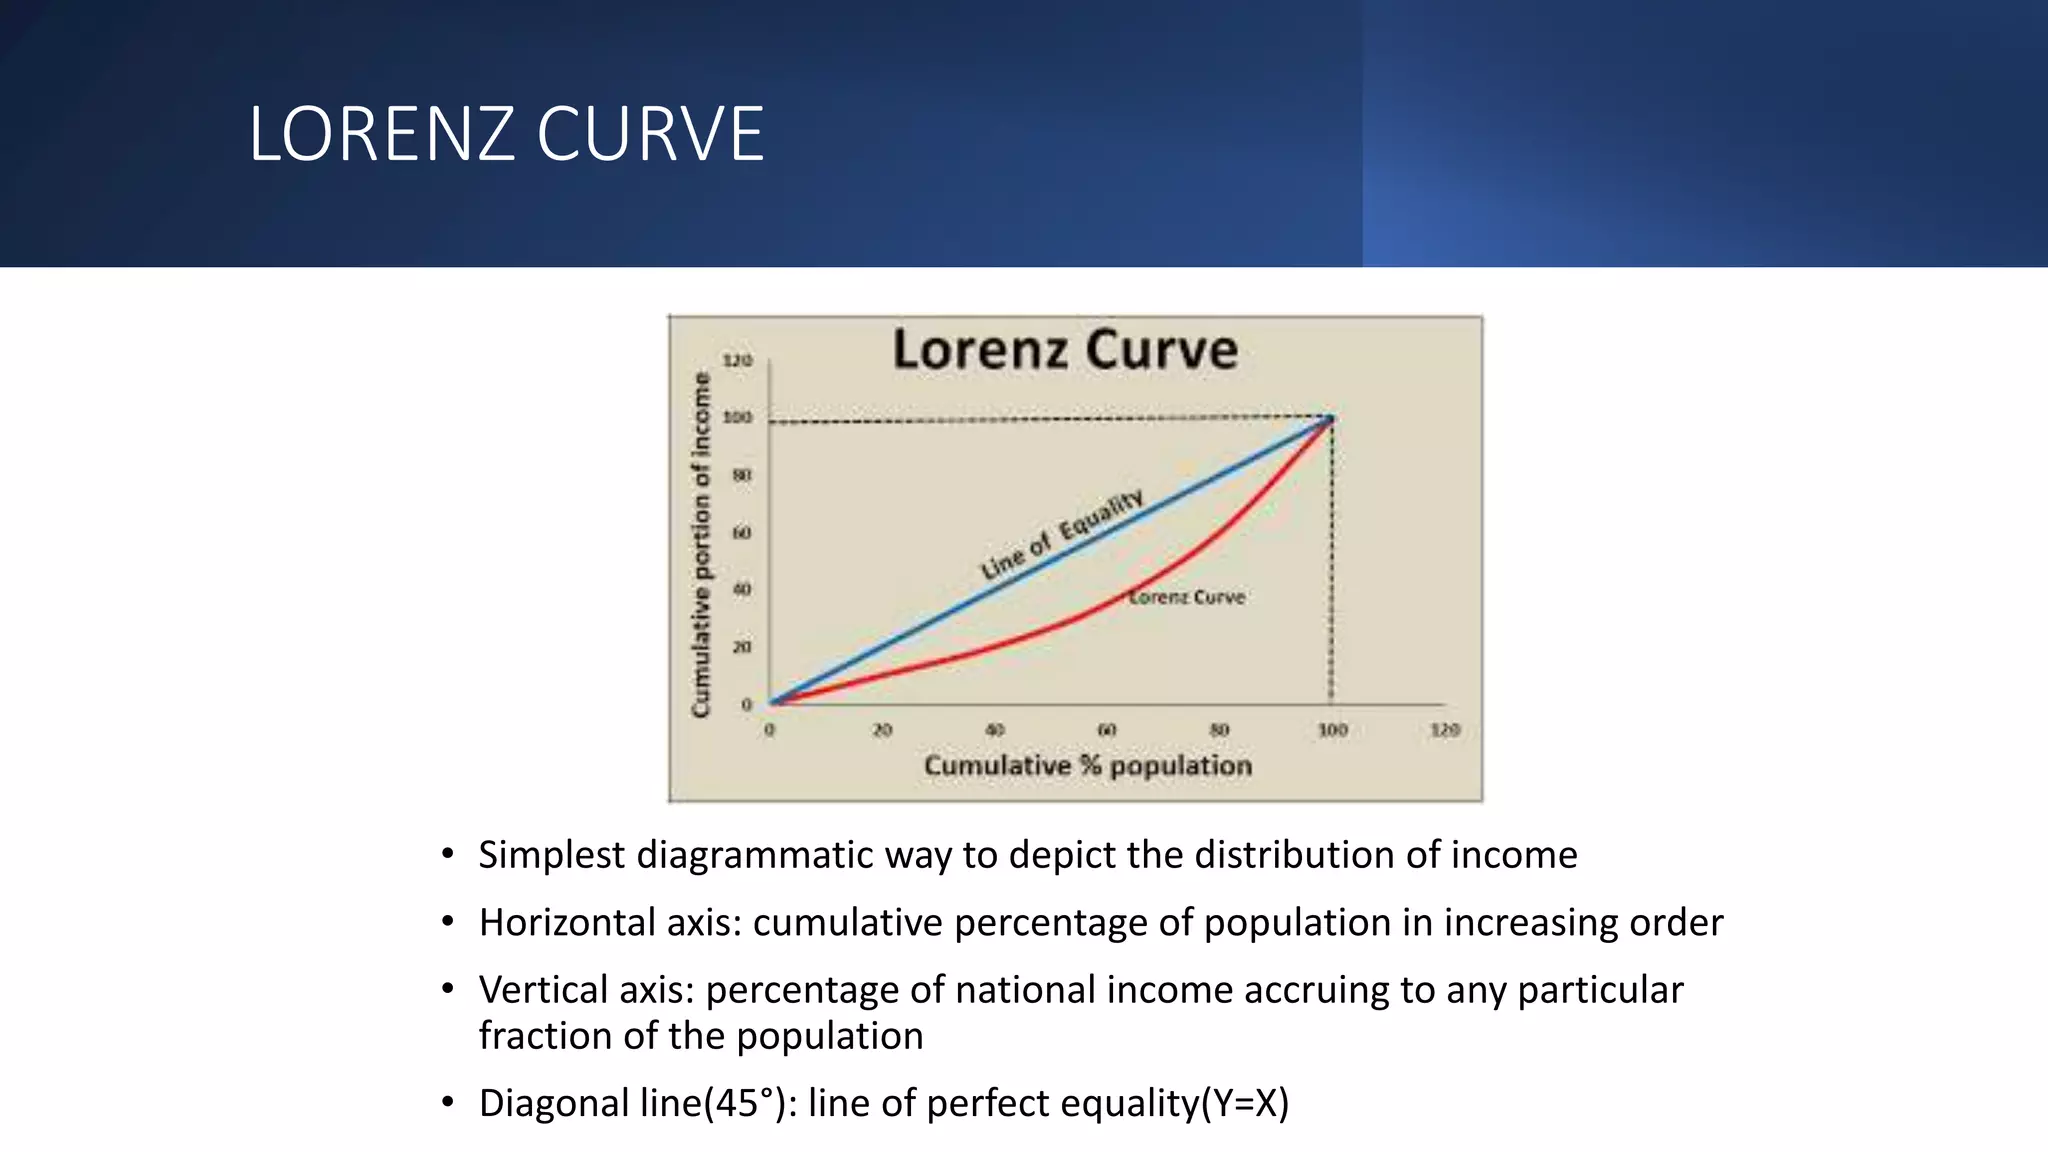
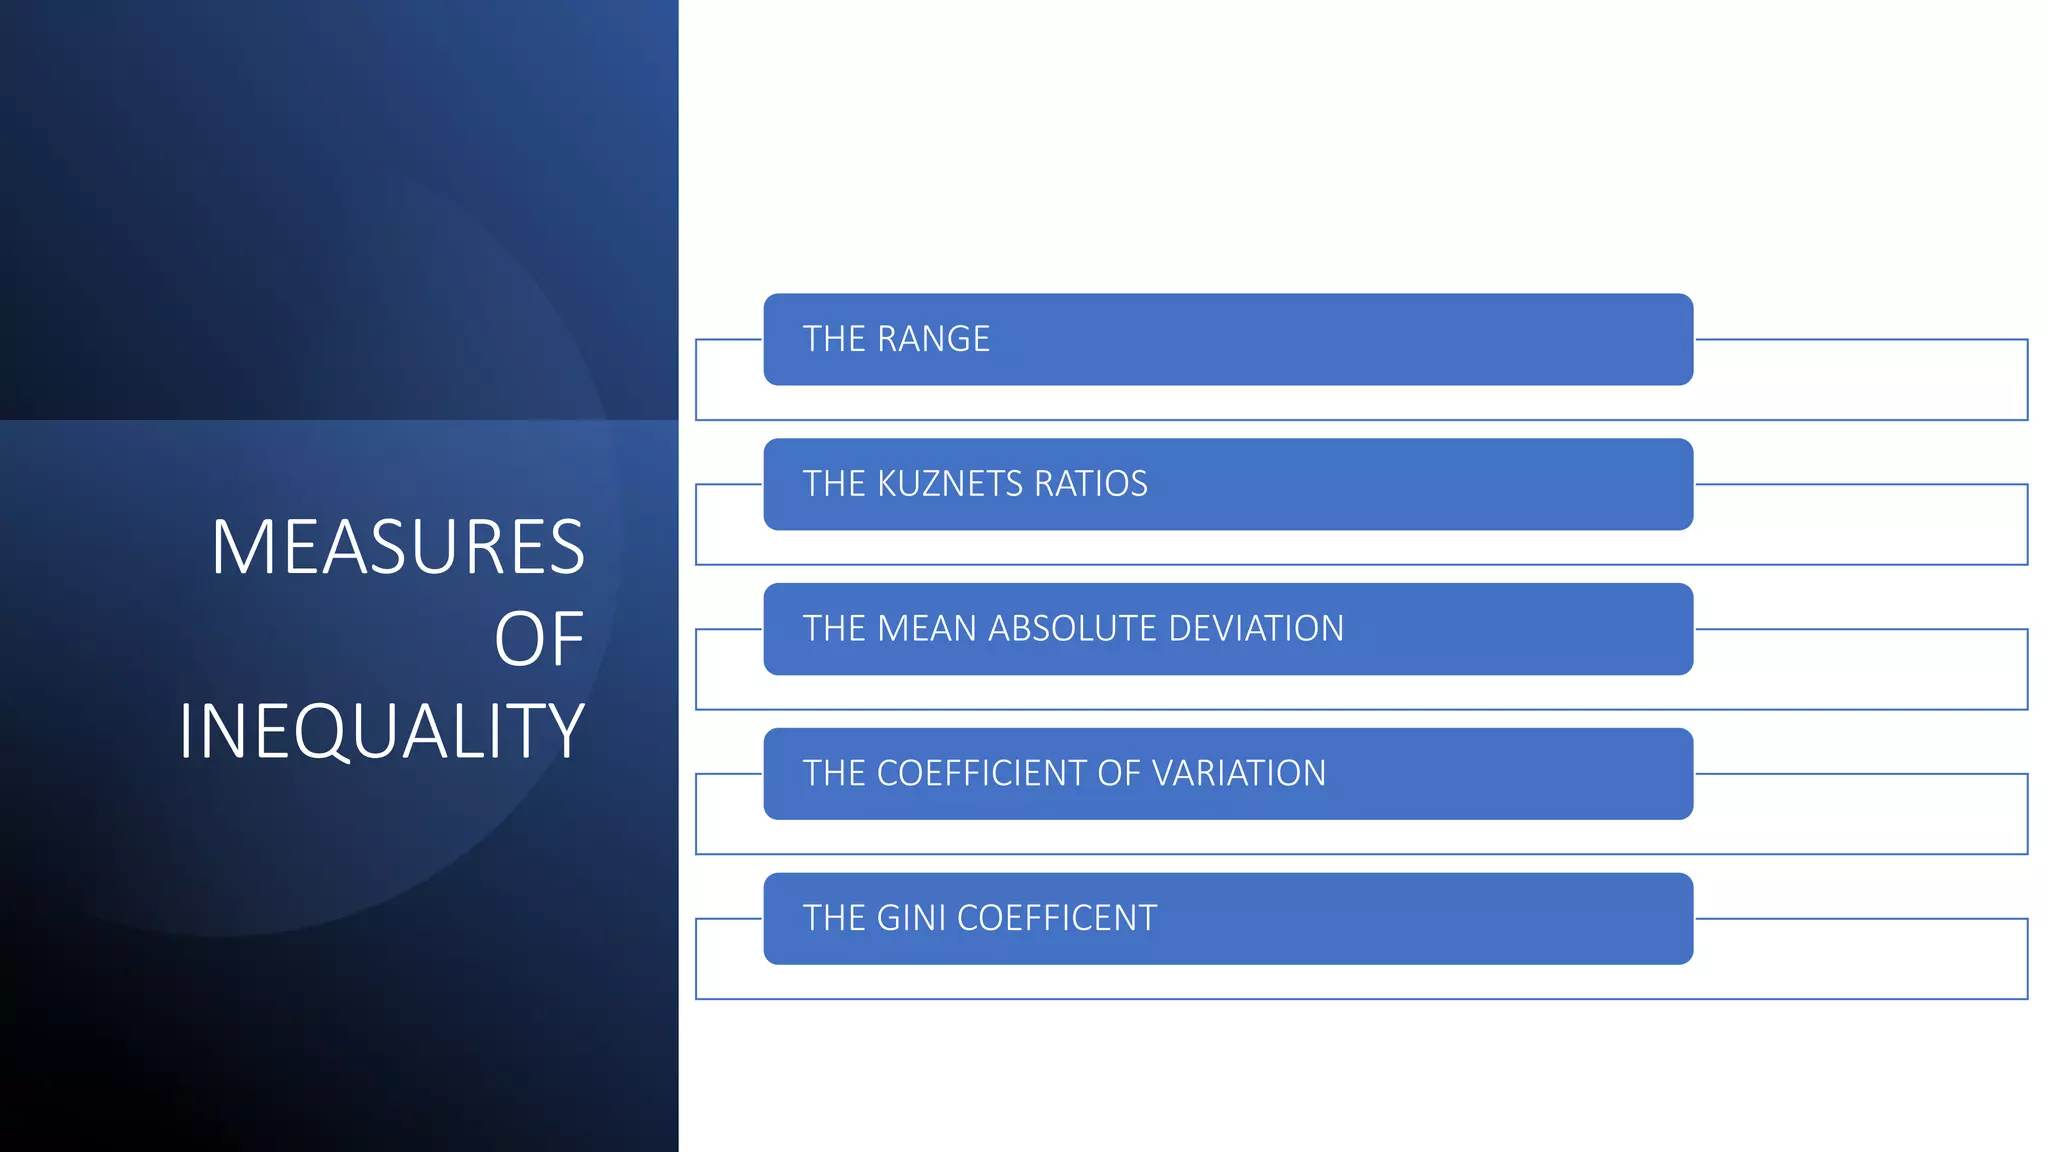
PRINCIPLES AND
MEASURES OF
INEQUALITY
Janisha Dubey
Varadha Krishna
Aparna.S
INTRODUCTION
Economic inequality is the unequal distribution of
income and opportunity between different
groups in society. It is a concern in almost all
countries around the world and often people are
trapped in poverty with little chance to climb up
the social ladder.
The process of wealth concentration arguably
makes economic inequality a vicious cycle
PRINCIPLES OF
INEQUALITY
ANONYMITY PRINCIPLE
POPULATION PRINCIPLE
RELATIVE INCOME PRINCIPLE
DALTON PRINCIPLE
ANONYMITY
PRINCIPLE
• States that it does not matter who earns the income
• Individual A earning Y1 and individual B earning Y2 should
be viewed as identical to one in which A earning Y2 and B
earning Y1.
• We care about the ordering but not the identities of each
earner
• We can always arrange our income distribution so that
Y1 ≤ Y2≤ ……...≤ Yn
• That is, arranging individuals in such a way that they are
ranked from poorest to richest
POPULATION
PRINCIPLE
• States that cloning the entire population should not alter
inequality
• On comparing an income distribution over n people and
another population of 2n people with the same income
pattern repeated twice there should be no difference in
inequality among the two income distribution
• It states that it doesn’t matter how large the population is
we need to focus on the proportions of population that
earn different levels of income
RELATIVE
INCOME
PRINCIPLE
• States that only the relative incomes should matter and the
absolute levels of these incomes should not
• Thus, if we transform one distribution by multiplying a
positive constant (example: Y1 = αY0 ) then inequality
should be the same for the two distributions.
DALTON
PRINCIPLE
• States that if one income distribution can be achieved from
another by constructing a sequence of regressive transfer,
the former distribution must be deemed more unequal
than the latter
• In simpler words, the society will be better off when a unit
of income is transferred from a richer individual to a poorer
individual.
LORENZ CURVE
• Simplest diagrammatic way to depict the distribution of income
• Horizontal axis: cumulative percentage of population in increasing order
• Vertical axis: percentage of national income accruing to any particular
fraction of the population
• Diagonal line(45°): line of perfect equality(Y=X)
LORENZ CURVE
• The overall distance between the 45° line and Lorenz curve represents the amount
of inequality
• With increase in inequality Lorenz curve starts to fall below the diagonal in a loop that is
always bowed out to the right of the diagram.
• Slope of the curve at any point is simply the contribution of the person at the point to
the cumulative share of national income.
• Ordered from poorest to richest the 'marginal contribution' can never fall. That is the
Lorenz curve can never get flatter as we move from left to right.
MEASURES OF INEQUALITY
MEASURES
OF
INEQUALITY
THE RANGE
THE KUZNETS RATIOS
THE MEAN ABSOLUTE DEVIATION
THE COEFFICIENT OF VARIATION
THE GINI COEFFICENT
THE RANGE
• It is given by the difference in the incomes of the richest
and the poorest individual, divided by the mean
• It is a crude measure, it is also useful
THE KUZNETS
RATIOS
• These ratios were introduced by Simon Kuznets
• Refers to the ratio of the shares of income of the richest x%
to the poorest y% where x & y are numbers such as
10,20,30 etc
• Crude measures, it focuses on ends of distribution
THE MEAN
ABSOLUTE
DEVIATION
• Inequality is proportional to distance from the mean income.
• Drawback: it is often insensitive to Dalton principle
COEFFICIENT
OF VARIATION
• Standard measure of relative dispersion
• It satisfies all four principles
GINI
COEFFICIENT
• Widely used in empirical work
• Takes the difference between all pairs of incomes and
simply totals the absolute differences
• It satisfies all four principles
• Gini coefficient is the ratio of the area between the Lorenz
curve and the 45° line to the area of the triangle below the
45° line.
• G = A/(A+B) (from the above figure)
THANK YOU

Principles and measures of inequality (1)

  • 1.
    PRINCIPLES AND MEASURES OF INEQUALITY JanishaDubey Varadha Krishna Aparna.S
  • 2.
    INTRODUCTION Economic inequality isthe unequal distribution of income and opportunity between different groups in society. It is a concern in almost all countries around the world and often people are trapped in poverty with little chance to climb up the social ladder. The process of wealth concentration arguably makes economic inequality a vicious cycle
  • 3.
    PRINCIPLES OF INEQUALITY ANONYMITY PRINCIPLE POPULATIONPRINCIPLE RELATIVE INCOME PRINCIPLE DALTON PRINCIPLE
  • 4.
    ANONYMITY PRINCIPLE • States thatit does not matter who earns the income • Individual A earning Y1 and individual B earning Y2 should be viewed as identical to one in which A earning Y2 and B earning Y1. • We care about the ordering but not the identities of each earner • We can always arrange our income distribution so that Y1 ≤ Y2≤ ……...≤ Yn • That is, arranging individuals in such a way that they are ranked from poorest to richest
  • 5.
    POPULATION PRINCIPLE • States thatcloning the entire population should not alter inequality • On comparing an income distribution over n people and another population of 2n people with the same income pattern repeated twice there should be no difference in inequality among the two income distribution • It states that it doesn’t matter how large the population is we need to focus on the proportions of population that earn different levels of income
  • 6.
    RELATIVE INCOME PRINCIPLE • States thatonly the relative incomes should matter and the absolute levels of these incomes should not • Thus, if we transform one distribution by multiplying a positive constant (example: Y1 = αY0 ) then inequality should be the same for the two distributions.
  • 7.
    DALTON PRINCIPLE • States thatif one income distribution can be achieved from another by constructing a sequence of regressive transfer, the former distribution must be deemed more unequal than the latter • In simpler words, the society will be better off when a unit of income is transferred from a richer individual to a poorer individual.
  • 8.
    LORENZ CURVE • Simplestdiagrammatic way to depict the distribution of income • Horizontal axis: cumulative percentage of population in increasing order • Vertical axis: percentage of national income accruing to any particular fraction of the population • Diagonal line(45°): line of perfect equality(Y=X)
  • 9.
    LORENZ CURVE • Theoverall distance between the 45° line and Lorenz curve represents the amount of inequality • With increase in inequality Lorenz curve starts to fall below the diagonal in a loop that is always bowed out to the right of the diagram. • Slope of the curve at any point is simply the contribution of the person at the point to the cumulative share of national income. • Ordered from poorest to richest the 'marginal contribution' can never fall. That is the Lorenz curve can never get flatter as we move from left to right.
  • 10.
  • 11.
    MEASURES OF INEQUALITY THE RANGE THE KUZNETSRATIOS THE MEAN ABSOLUTE DEVIATION THE COEFFICIENT OF VARIATION THE GINI COEFFICENT
  • 12.
    THE RANGE • Itis given by the difference in the incomes of the richest and the poorest individual, divided by the mean • It is a crude measure, it is also useful
  • 13.
    THE KUZNETS RATIOS • Theseratios were introduced by Simon Kuznets • Refers to the ratio of the shares of income of the richest x% to the poorest y% where x & y are numbers such as 10,20,30 etc • Crude measures, it focuses on ends of distribution
  • 14.
    THE MEAN ABSOLUTE DEVIATION • Inequalityis proportional to distance from the mean income. • Drawback: it is often insensitive to Dalton principle
  • 15.
    COEFFICIENT OF VARIATION • Standardmeasure of relative dispersion • It satisfies all four principles
  • 16.
    GINI COEFFICIENT • Widely usedin empirical work • Takes the difference between all pairs of incomes and simply totals the absolute differences • It satisfies all four principles • Gini coefficient is the ratio of the area between the Lorenz curve and the 45° line to the area of the triangle below the 45° line. • G = A/(A+B) (from the above figure)
  • 17.