Download to read offline


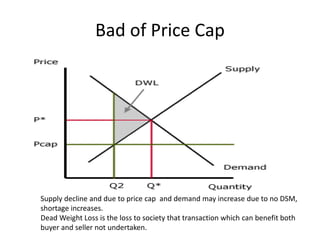
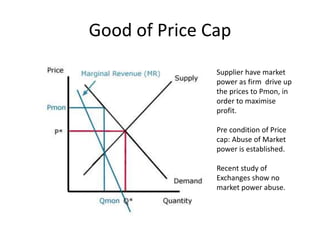
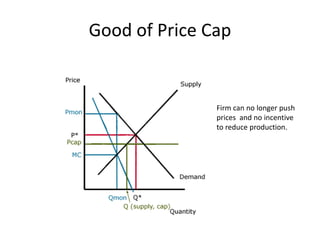
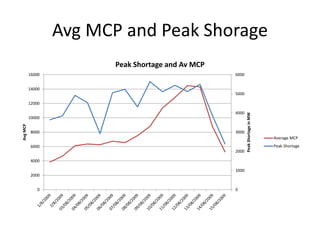
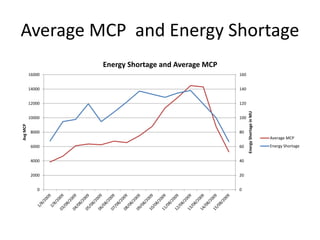
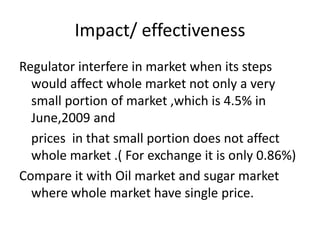
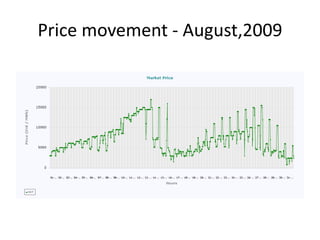
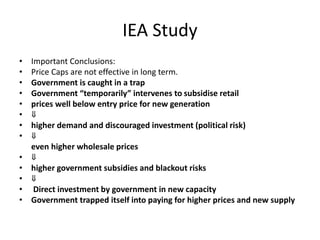

The document discusses the pros and cons of implementing a price cap for electricity in India. It notes that while price caps can prevent supplier market power and price gouging, they can also reduce supply and investment if set too low. International experience shows that price caps are not effective long-term solutions and often trap governments into higher subsidies over time. The document analyzes electricity market data from India and concludes that widespread intervention may not be needed given most power is sold through long-term contracts and exchange prices impact a small percentage of the overall market. Demand response and better regulation of distribution companies are presented as alternatives to consider before implementing a price cap.