Download to read offline
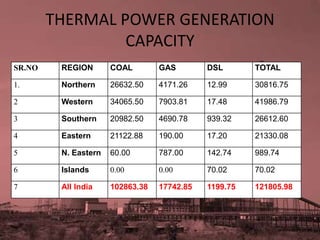
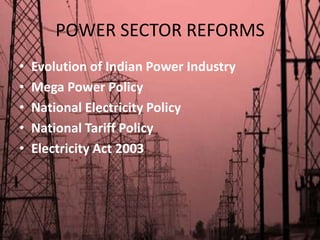
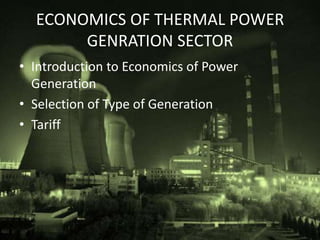
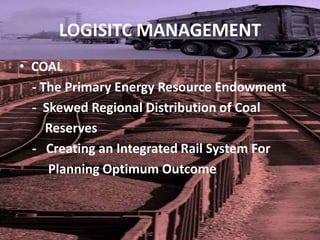


This document provides an overview of the Indian thermal power generation sector. It discusses the current capacity and distribution of coal, gas, and diesel-powered plants across India. It also examines the economics, logistics, financing, and reforms of the sector. Looking ahead, the document predicts that thermal generation will grow by 5.6% annually through 2015 due to increasing coal and gas-fired capacity, before accelerating later in the decade. Key challenges include high AT&C losses, subsidized power rates, and environmental impacts.


