The document details the historical growth and current state of power generation in India, highlighting the transition from hydropower to coal dominance and the rise of renewable energy sources. With projections for substantial growth in energy production and investments in the sector, it also emphasizes the government's targets for renewable energy and electricity generation by 2022. Additionally, the report outlines career opportunities in both the public and private sectors for graduates specializing in power management.
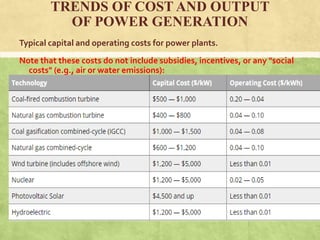
![▪ Operating costs for power plants include fuel, labour and maintenance costs.The fixed costs of
power generation are essentially capital costs and land. The capital cost of building central station
generators vary from region to region, largely as a function of labour costs and "regulatory costs," which
include things like obtaining siting permits, environmental approvals, and so on.
Irrespective of technology, all generators share the following characteristics
which influence the plant's operations:
▪ Ramp rate
This variable influences how quickly the plant can increase or decrease power output, in [MW/h] or in [%
of capacity per unit time]
▪ Ramp time
The amount of time it takes from the moment a generator is turned on to the moment it can start
providing energy to the grid at its lower operating limit (see below), in [h]
▪ Capacity
The maximum output of a plant, in [MW]
▪ Lower Operating Limit (LOL)
The minimum amount of power a plant can generate once it is turned on, in [MW]
▪ Minimum RunTime
The shortest amount of time a plant can operate once it is turned on, in [h].
▪ No-Load Cost
The cost of turning the plant on, but keeping it "spinning," ready to increase power output, in [Rs/MWh].
Another way of looking at the no-load cost is the fixed cost of operation; i.e., the cost incurred by the
generator that is independent of the amount of energy generated.
▪ Start-up and Shut-down Costs
These are the costs involved in turning the plant on and off, in [Rs/MWh].](https://image.slidesharecdn.com/powerenergygenerationreport-170409102501/85/Power-energy-generation-report-20-320.jpg)