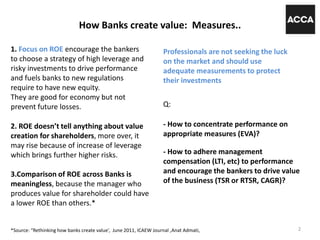
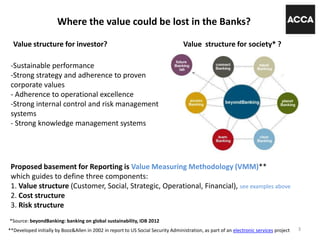
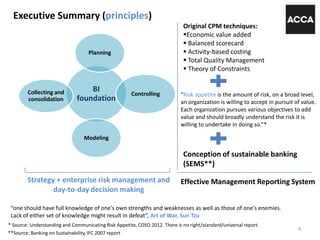
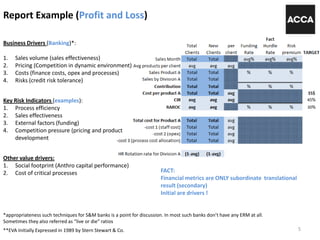
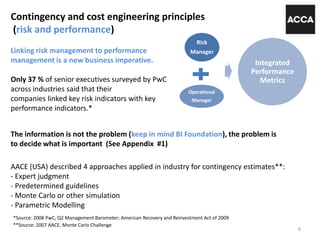
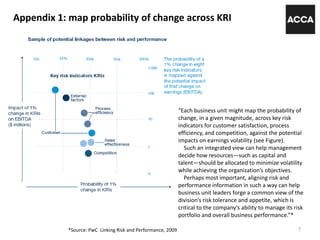
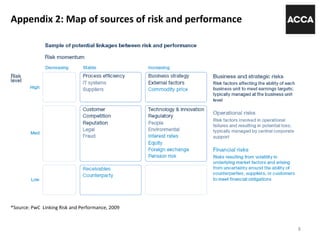
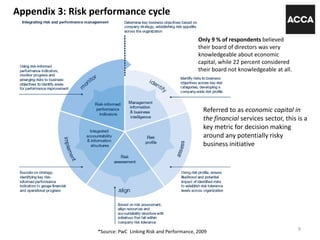
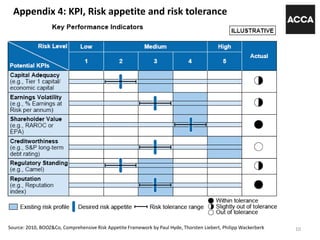
This document discusses effective management reporting systems for banks to measure value creation. It proposes using a value measuring methodology (VMM) with three components: a value structure identifying key areas that create value for customers, society, operations etc.; a cost structure; and a risk structure. Key performance indicators (KPIs) should be linked to key risk indicators (KRIs) to integrate risk and performance management. Appendices provide examples of mapping KRIs against potential impacts; sources of risk and performance; the risk-performance cycle; and how KPIs relate to risk appetite and tolerance. The document advocates a holistic approach linking financial, operational and risk metrics to truly reflect how value is created and destroyed.
2. How Banks create value: Measures..
2
1. Focus on ROE encourage the bankers
to choose a strategy of high leverage and
risky investments to drive performance
and fuels banks to new regulations
require to have new equity.
They are good for economy but not
prevent future losses.
*Source: “Rethinking how banks create value’, June 2011, ICAEW Journal ,Anat Admati,
2. ROE doesn’t tell anything about value
creation for shareholders, more over, it
may rise because of increase of leverage
which brings further higher risks.
3.Comparison of ROE across Banks is
meaningless, because the manager who
produces value for shareholder could have
a lower ROE than others.*
Professionals are not seeking the luck
on the market and should use
adequate measurements to protect
their investments
- How to adhere management
compensation (LTI, etc) to performance
and encourage the bankers to drive value
of the business (TSR or RTSR, CAGR)?
- How to concentrate performance on
appropriate measures (EVA)?
Q:
3. Where the value could be lost in the Banks?
3
*Source: beyondBanking: banking on global sustainability, IDB 2012
Value structure for society* ?Value structure for investor?
-Sustainable performance
-Strong strategy and adherence to proven
corporate values
- Adherence to operational excellence
-Strong internal control and risk management
systems
- Strong knowledge management systems
Proposed basement for Reporting is Value Measuring Methodology (VMM)**
which guides to define three components:
1. Value structure (Customer, Social, Strategic, Operational, Financial), see examples above
2. Cost structure
3. Risk structure
**Developed initially by Booz&Allen in 2002 in report to US Social Security Administration, as part of an electronic services project
4. Executive Summary (principles)
“one should have full knowledge of one's own strengths and weaknesses as well as those of one's enemies.
Lack of either set of knowledge might result in defeat”, Art of War, Sun Tzu
BI
foundation
Planning
Controlling
Modeling
Collecting and
consolidation
Original CPM techniques:
Economic value added
Balanced scorecard
Activity-based costing
Total Quality Management
Theory of Constraints
Strategy + enterprise risk management and
day-to-day decision making
“Risk appetite is the amount of risk, on a broad level,
an organization is willing to accept in pursuit of value.
Each organization pursues various objectives to add
value and should broadly understand the risk it is
willing to undertake in doing so.”*
* Source: Understanding and Communicating Risk Appetite, COSO 2012. There is no right/standard/universal report.
4
Conception of sustainable banking
(SEMS**)
Effective Management Reporting System
**Source: Banking on Sustainability, IFC 2007 report
5. Report Example (Profit and Loss)
5
*appropriateness such techniques for S&M banks is a point for discussion. In most such banks don’t have any ERM at all.
Sometimes they also referred as “live or die” ratios
FACT:
Financial metrics are ONLY subordinate translational
result (secondary)
Initial are drivers !
**EVA Initially Expressed in 1989 by Stern Stewart & Co.
Other value drivers:
1. Social footprint (Anthro capital performance)
2. Cost of critical processes
Business Drivers (Banking)*:
1. Sales volume (sales effectiveness)
2. Pricing (Competition in dynamic environment)
3. Costs (finance costs, opex and processes)
4. Risks (credit risk tolerance)
Key Risk Indicators (examples):
1. Process efficiency
2. Sales effectiveness
3. External factors (funding)
4. Competition pressure (pricing and product
development
6. Contingency and cost engineering principles
(risk and performance)
AACE (USA) described 4 approaches applied in industry for contingency estimates**:
- Expert judgment
- Predetermined guidelines
- Monte Carlo or other simulation
- Parametric Modelling
Linking risk management to performance
management is a new business imperative.
Only 37 % of senior executives surveyed by PwC
across industries said that their
companies linked key risk indicators with key
performance indicators.*
*Source: 2008 PwC, Q2 Management Barometer; American Recovery and Reinvestment Act of 2009
Risk
Manager
Operational
Manager
Integrated
Performance
Metrics
**Source: 2007 AACE, Monte Carlo Challenge
The information is not the problem (keep in mind BI Foundation), the problem is
to decide what is important (See Appendix #1)
6
7. Appendix 1: map probability of change across KRI
“Each business unit might map the probability of
change, in a given magnitude, across key risk
indicators for customer satisfaction, process
efficiency, and competition, against the potential
impacts on earnings volatility (see Figure).
Such an integrated view can help management
decide how resources—such as capital and
talent—should be allocated to minimize volatility
while achieving the organization’s objectives.
Perhaps most important, aligning risk and
performance information in such a way can help
business unit leaders forge a common view of the
division’s risk tolerance and appetite, which is
critical to the company’s ability to manage its risk
portfolio and overall business performance.”*
7*Source: PwC Linking Risk and Performance, 2009
8. Appendix 2: Map of sources of risk and performance
8
*Source: PwC Linking Risk and Performance, 2009
9. Appendix 3: Risk performance cycle
9*Source: PwC Linking Risk and Performance, 2009
Referred to as economic capital in
the financial services sector, this is a
key metric for decision making
around any potentially risky
business initiative
Only 9 % of respondents believed
their board of directors was very
knowledgeable about economic
capital, while 22 percent considered
their board not knowledgeable at all.
10. 10
Appendix 4: KPI, Risk appetite and risk tolerance
Source: 2010, BOOZ&Co, Comprehensive Risk Appetite Framework by Paul Hyde, Thorsten Liebert, Philipp Wackerberk