SYLLABUS OVERVIEW
Syllabus areaWeightings
Corporate finance objectives and measurements 10%
Corporate financing strategies 30%
Dividend policy and capital gains 5%
Corporate investment appraisal 20%
Corporate growth strategy 20%
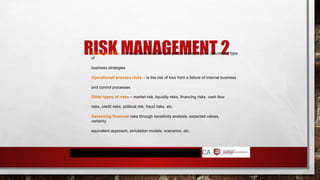
Corporate risk identification and management 15%
3.
ABOUT THE LECTURER
Qualifications MBA - Australia,
MAFE - Sri Lanka,
CGMA – USA
FCCA – UK
ACMA - UK
FCMA – Sri Lanka
CPA - Australia
MACS – Australia
Six Sigma GB – India
Dip. In Psychology
Areas of expertise Strategic planning
Management
Accounting
BPR and
process
improveme
nt
Perfor
mance
Mana
geme
nt
Strategy Development
Financial management
Project Management
Risk management
Legal &
Regulatory
Compliance
Change Management
Leade
rship
Develo
pment
Business/
Product
Development
Achievements Won the “Highest
Achievement Student
Award” and Gold
Medal
for MBA
Invited to the
“Golden Key Club”
Won the Town
Hall
Award
Won the
Brainwave
Award
Completed 2
masters
degrees together
4.
[CHAPTER 1: STRATEGICROLE AND INTEGRATION OF FINANCIAL MANAGEMENT]
Syllabus areas
Objectives of companies
Stakeholders and objectives
Objectives of publicly owned and non-commercial bodies
Financial management decisions
Strategic Role and Integration of Financial Management
5.
CHAPTER 1: STRATEGICROLE AND INTEGRATION OF FINANCIAL MANAGEMENT
Learning Outcomes
Discuss the evolving role and strategic scope of financial management (including profit maximisation, wealth
maximisation, value for money, and balanced scorecard approach) in achieving organisational objectives.
Assess how the finance function integrates with other business units to support strategic decision-making and long-
term growth. What are the areas considered in the balanced scorecard approach?
Assess the strategic importance of the treasury function within financial management in managing liquidity, funding,
and financial risks.
Evaluate the leadership role of finance professionals in driving corporate strategy.
6.
WHAT IS FINANCIALMANAGEMENT
Financial management evaluates how funds are used and procured
Financial management is the managerial activity which is concerned with planning and controlling of the firms financial resources.
In other words it is concerned with acquiring, financing and managing assets to accomplish the overall goal of a business
enterprise(mainly to maximise the shareholder wealth)
In todays world where positive cashflow is more important than book profit, financial management can also be defined as planning for
the future of a business enterprise to ensure a positive cashflow
WHAT IS STRATEGIC FINANCIAL MANAGEMENT?
Strategic financial management is 'the identification of the possible strategies capable of maximising an organisation's net present value,
the allocation of scarce capital resources among the competing opportunities and the implementation and monitoring of the chosen
strategy so as to achieve stated objectives’.
Strategic financial management is the study of finance with a long term view considering the strategic goals of the enterprise. Financial
management is nowadays increasingly referred to as "Strategic Financial Management" so as to give it an increased frame of reference.
The approach of strategic financial management is to drive decision making that prioritizes business objectives in the long term. Strategic
financial management not only assists in setting company targets but also creates a platform for planning and governing plans to tackle
challenges along the way. It also involves laying out steps to drive the business towards its objectives
7.
OBJECTIVES OF COMPANIES:PROFIT MAXIMIZATION
Profit maximization means increasing the net income of a firm.
Profit earning is the main aim of every organisation that is engaged in economic activity.
While No business can survive without earning profit, Profit is a measure of efficiency of a business enterprise.
Profit also serve as a protection against risk which enables a business to face risk like fall in prices, competition from other units, adverse
govt. polices etc. So the profit maximization is considered as the main objective of business.
Arguments for profit maximization
Profitability is the yardstick for measuring efficiency and economic prosperity of a business enterprise
Profits are the main source of finance for the growth of a business.
A business will be able to survive under unfavorable situation only if it has some past earnings
Criticism of Profit Maximization: -
It is vague: - The price meaning of profit maximization objective is unclear. Whether short term or long term profit, profits before tax or
after tax, total profit or earning per share and so on.
Ignores the timing of the return: - The profit maximization objective ignores the time value of money. If values benefits received today and
benefits received after a period as the same, it avoids the fact that cash received today is more important than the same amount of cash
received after some years.
It ignores risk: - The streams of benefit may possess different degree of certainty. Two firms may have same total expected earnings, but if
the earnings of one firm fluctuate considerably as compared to the other, it will be more risky. Profit maximization objective ignores this
factor.
8.
OBJECTIVES OF COMPANIES: WEALTH MAXIMIZATION
Profit maximisation is often assumed to be the main objective of a business but shareholders may still be disappointed even when profits
are rising.
Therefore, It is assumed that the goal of the firm should be to maximize the wealth of its current shareholders
Wealth maximization is the appropriate objective of an enterprise.
A stockholder‘s current wealth in the firm is the product of the number of shares owned, multiplied with the current stock price per share.
Stockholder‘s current wealth in a firm = (Number of shares owned) x (Current stock price per share).
The wealth maximization should be the criterion for every financial decision taken by the company
Arguments for Wealth maximization
It serves the interests of shareholders who are the owners of the organsiation
Management is the elected body of shareholders. The shareholders may not like to change a management if it is able to increase the value
of their holdings. The efficient allocation of productive resources will be essential for raising the wealth of the company
9.
OBJECTIVES OF COMPANIES: NON-FINANCIAL OBJECTIVES
Non-financial objectives such as quality measures, innovation
measures and customer-based measures can also be important for a
profit-making entity.
A company's non-financial objectives may include the following.
10.
OBJECTIVES OF COMPANIES: MEASURING NON FINANCIAL PERFORMANCE: VALUE FOR MONEY(VFM)
A key theme in contemporary performance management is that organisations need to measure, and manage, non-financial aspects of
performance, rather than focusing solely on financial aspects
However, in profit-seeking organisations, there remains an underlying financial objective: typically, to maximise profit in order to
maximise value for shareholders.
By definition though not-for-profit organisations do not have this underlying objective. Nonetheless, financial performance remains
important in not-for-profit organisations (for example, comparing actual expenditure against budget, or comparing the surplus (or deficit)
of income over expenditure.
However, these organisations also need to monitor how efficiently they are using the resources available to them, and how well they are
performing in relation to their key objectives. For example, for hospitals and medical centres, how effectively they are providing health care
to their patients; for schools and universities, the quality of education they are providing to their students.
Value for money is seen as an appropriate framework for measuring performance in not-for-profit organisations, because value for money
reflects not only the cost of providing a service but also the benefits achieved by providing it. In the absence of an underlying profit motive,
assessing the benefits provided by a service is a particularly important part of evaluating its performance: for example, the benefits
received by patients from hospital treatment they receive; the quality of education that students receive at their school or college.
Importantly also, value for money is not simply about minimising cost. To use the UK National Audit Office’s definition: “Good value for
money is the optimal use of resources to achieve the intended outcomes” where ‘optimal’ means “the most desirable possible given
expressed or implied restrictions or constraints”.
11.
:VALUE FOR MONEY(VFM)– THE THREE E’S
The key to achieving good value for money is finding an appropriate balance between
the three Es (as summarised in Figure 1).
Economy: obtaining the appropriate quantity and quality of resources at the lowest
cost possible; optimising the resources (inputs) which an organisation has.
Efficiency: maximising the output generated from units of resource used; optimising
the process by which inputs are turned into outputs.
Efficiency can often be measured in terms of the cost of providing a service per unit of
resource used, per unit of output, or per beneficiary served (in the context of a service).
For example, if the number of teachers employed by two schools is the same, but the
first school has twice as many pupils as the second, we could say the first school is
more efficient, because the staff costs per pupil will be lower.
Effectiveness: the relationship between the organisation’s intended and actual results
(outputs); the extent to which it achieves its objectives.
For example, one of the indicators which is often used to measure schools’ performance
is exam results, and this provides a measure of effectiveness. Is the tuition which pupils
receive building their knowledge and, in turn, helping them to pass their exams?
12.
OBJECTIVES OF COMPANIES: MEASURING NON FINANCIAL PERFORMANCE : BALANCED SCORECARD APPORACH
The Balanced Scorecard (BSC) is a tool that measures a company's performance not just by
financial performance , but also by how well it serves customers, runs its operations, and
prepares for future growth.
This approach was introduced by business scholars Robert S. Kaplan and David P. Norton in a
Harvard Business Review article in 1992.
Their broadened performance measurement is designed to provide companies with a
comprehensive view of their overall health, enabling leaders to implement long-term
strategies, synchronize daily operations with their objectives, and drive ongoing
improvements.
Kaplan and Norton argued that "What you measure is what you get," highlighting the need
for a balanced set of metrics to steer organizational behavior toward strategic objectives.
They demonstrated through case study research that traditional financial metrics like return
on investment (ROI) and earnings before interest, taxes, depreciation, and amortization
(EBITDA) often failed to capture the drivers of future performance, such as process
capabilities and employee competencies
To remedy this, the authors proposed adding customer, internal process, as well as innovation
and learning measures to financial data, creating a multidimensional dashboard that reflects
an organization’s strategic priorities. This approach helped managers focus on the early signs
of success rather than relying solely on the past financial results, which can hide new
opportunities or problems
13.
FINANCIAL MANAGEMENT ANDSTRATEGIC DECISION MAKING :
In order to maximise shareholder wealth an organisation must
take sensible financing, investment and dividend decisions. The
cashflow patterns of relating to these decisions are interrelated as
identified below.
An organisation needs to source funds (the finance decision), decide
how to invest those funds (investment decision) then decide how
much to reinvest within the organisation from the surplus funds that
gets retained or whether to distribute the surplus funds back to
providers of finance as dividends(dividend decision).
14.
FINANCIAL MANAGEMENT ANDSTRATEGIC DECISION MAKING : INVESTMENT DECISION MAKING
Concerning how funds are allocated to long-term assets.
Focus on evaluating and selecting projects or investment opportunities that yield maximum returns (e.g., capital budgeting).
Involve assessing risk, expected returns, and strategic alignment with organizational goals
Investment decision involves careful selection of the assets where funds will be invested by the corporates.
This is where managers choose where and how to allocate resources to generate the best possible returns for the company’s investors
the following factors should be considered for decision making.
15.
FINANCIAL MANAGEMENT ANDSTRATEGIC DECISION MAKING : FINANCING DECISIONS
Focus on determining the optimal capital structure (debt vs. equity).
Evaluate sources of finance (e.g., equity, loans, bonds) and their cost.
Aim to minimize the cost of capital while ensuring adequate funding.
Financing decisions mainly focus on how much debt a firm is planning to use.
The level of gearing that is appropriate for a business depends on several practical issues:
Life cycle - A new, growing business will find it difficult to forecast cash flows with any certainty so high levels of gearing are unwise.
Operating gearing- If fixed costs are a high proportion of total costs, then cash flows will be volatile; so high gearing is not sensible.
Stability of revenue- If operating in a highly dynamic business environment then high gearing is not sensible.
Security- If unable to offer security, then debt will be difficult and expensive to obtain
Financing decisions relate to when, where and how should the business acquire the funds in order to manage the business operations.
financing decisions include those for both the long term (capital structure) and the short term (working capital management).
Under long term financing decisions, the following factors should be considered for decision making.
16.
OBJECTIVES OF COMPANIES: MEASURING NON FINANCIAL PERFORMANCE : BALANCED SCORECARD APPORACH
The Balanced Scorecard (BSC) is a tool that measures a company's performance not just by
financial performance , but also by how well it serves customers, runs its operations, and
prepares for future growth.
This approach was introduced by business scholars Robert S. Kaplan and David P. Norton in a
Harvard Business Review article in 1992.
Their broadened performance measurement is designed to provide companies with a
comprehensive view of their overall health, enabling leaders to implement long-term
strategies, synchronize daily operations with their objectives, and drive ongoing
improvements.
Kaplan and Norton argued that "What you measure is what you get," highlighting the need
for a balanced set of metrics to steer organizational behavior toward strategic objectives.
They demonstrated through case study research that traditional financial metrics like return
on investment (ROI) and earnings before interest, taxes, depreciation, and amortization
(EBITDA) often failed to capture the drivers of future performance, such as process
capabilities and employee competencies
To remedy this, the authors proposed adding customer, internal process, as well as innovation
and learning measures to financial data, creating a multidimensional dashboard that reflects
an organization’s strategic priorities. This approach helped managers focus on the early signs
of success rather than relying solely on the past financial results, which can hide new
opportunities or problems
17.
FINANCIAL MANAGEMEMNT DECISIONMAKING
The Balanced Scorecard (BSC) is a tool that measures a company's performance not just by
financial performance , but also by how well it serves customers, runs its operations, and
prepares for future growth.
This approach was introduced by business scholars Robert S. Kaplan and David P. Norton in a
Harvard Business Review article in 1992.
Their broadened performance measurement is designed to provide companies with a
comprehensive view of their overall health, enabling leaders to implement long-term
strategies, synchronize daily operations with their objectives, and drive ongoing
improvements.
Kaplan and Norton argued that "What you measure is what you get," highlighting the need
for a balanced set of metrics to steer organizational behavior toward strategic objectives.
They demonstrated through case study research that traditional financial metrics like return
on investment (ROI) and earnings before interest, taxes, depreciation, and amortization
(EBITDA) often failed to capture the drivers of future performance, such as process
capabilities and employee competencies
To remedy this, the authors proposed adding customer, internal process, as well as innovation
and learning measures to financial data, creating a multidimensional dashboard that reflects
an organization’s strategic priorities. This approach helped managers focus on the early signs
of success rather than relying solely on the past financial results, which can hide new
opportunities or problems
18.
CHAPTER 1: STRATEGICROLE AND INTEGRATION OF FINANCIAL
MANAGEMENT
Strategic financial management is 'the identification of the possible strategies
capable of maximising an organisation's net present value, the allocation of
scarce capital resources among the competing opportunities and the
implementation and monitoring of the chosen strategy so as to achieve stated
objectives’.
It is a long-term plan and that considers the long-term objectives of an
organisation's stakeholders. In essence, it ensures that the organisation's finances
are congruent with business strategy and should ultimately meet stakeholder
goals.
Strategy depends on stated objectives or targets. Therefore, an obvious starting
point is the identification and formulation of these objectives. Strategy is a course
of action, including the specification of resources required, to achieve a specific
objective.
19.
CHAPTER 1: STRATEGICROLE AND INTEGRATION OF FINANCIAL
MANAGEMENT
Maximise Wealth
Considers timing of returns
Consider riskiness of returns
Considers real cash
flows
Maximise Profit
Max. revenue, min. costs
Firm’s value
increases
Market Value of the firm (Share
Price) increases
Objective: Maximise shareholders’ wealth
Fin. Targets examples
EPS, Borrowing levels,
profit retention, cash
generation, etc.
20.
CHAPTER 1:
STRATEGIC ROLEAND
INTEGRATION OF
FINANCIAL
MANAGEMENT
Non financial objectives
Customer satisfaction
Welfare of employees, management and society
Responsibilities to suppliers
Leadership in R&D
Maintaining competitive position and market share
21.
CHAPTER 1:
STRATEGIC ROLEAND
INTEGRATION OF
FINANCIAL
MANAGEMENT
The balanced scorecard perspective
Financial (profitability)
Customer
People (Innovation and learning)
Process (Internal business perspective)
Problems using the balanced scorecard
Conflicting measures
Selecting measures
Expertise
Interpretation
Management commitment
22.
CHAPTER 1:
STRATEGIC ROLEAND
INTEGRATION OF
FINANCIAL
MANAGEMENT
Stakeholders
Those parties with a
legitimate interest in
how the organisation
behaves
Internal
Connected
External
Stakeholders’ interests
are liable to conflict.
Shareholders
Customers
Suppliers
Lenders
Trade unions
Competitors
Owners/
Founders
Manage
ment
Staff
• Government
• Local
government
• Public
• Pressure
groups
• Opinion
leaders
Internal Connected External
23.
CHAPTER 1: STRATEGICROLE AND
INTEGRATION OF FINANCIAL MANAGEMENT
The Agency Theory
Main concepts
Conflict of interest
Goal congruence
24.
CHAPTER 1:
STRATEGIC ROLEAND
INTEGRATION OF
FINANCIAL
MANAGEMENT
Not-for-profit organisations
Value for money
Economical
Efficient
Effectiveness
25.
CHAPTER 1:
STRATEGIC ROLEAND
INTEGRATION OF
FINANCIAL
MANAGEMENT
Financial Management Role
Financial Decision Making
Investment Decision
Should the company
invest in new product?
expand operations?
how often to replace
machinery?
Financing Decision
Where is the capital
coming from?
How much equity?
How much debt?
Payout/Dividend
Decision
How to distribute
earnings?
Cash dividends, bonus
shares, rights offers
How much do we keep
for next year’s
investment decision?
26.
[CHAPTER 2: FINANCIALSTRATEGY]
Syllabus areas
Constraint on financial strategy
Regulatory bodies
Economic constraints
International constraints
The treasury function
Mohamed Intikab Bin Ali
27.
CHAPTER 2: FINANCIAL
STRATEGY
Constrainton financial strategy
Funding constraint
Investor relations – keep investor happy
Agency theory
Business strategy – investment opportunities, lack of funds/ access to funds,
capacity issues, availability of skills
28.
CHAPTER 2: FINANCIAL
STRATEGY
Regulatorybodies
Impact of legislation – Companies Acts, H&S regulations, consumer
protection laws, employment laws, environment protection laws, etc.
Compliance with legislations – extra cost, barriers to entry, penalties, bad
publicity
Corporate governance – how companies are directed and controlled.
Responsibilities of the board include; setting company’s strategic aims;
providing the leadership to put them into effect; Supervising the management
of the business; Reporting to shareholders on their stewardship
Competition regulation – industry regulators (i.e. price control, profit control),
regulation of takeover (i.e. effective competition within the industry, consumers
–
quality, price and variety, the reduction of costs)
29.
CHAPTER 2: FINANCIAL
STRATEGY
Economicconstraint
Effects of inflation – effects on factors of production, regular price revisions,
high level of uncertainty, pressure on cash flow, increase investments in working
capital, effects on financial reporting, etc.
Interest rates – affects the cost of borrowing, impact on foreign
exchange value, act as a guide for short term returns
(1+ nominal rate of interest) = (1+real rate of interest) x (1+ inflation rate)
The general level of interest rates – earn a real rate of return, cover
expected rates of inflation, liquidity preferences of investors and the demand
for borrowing, effects on balance of payment, monetary policy, interest rates
influenced by other countries
30.
CHAPTER 2: FINANCIAL
STRATEGY
Interestrates in different markets and market
segments
Risk
The need to make a profit on re-lending
The duration of the lending
The size of the loan
Different types of financial assets
The yield curve
31.
CHAPTER 2: FINANCIAL
STRATEGY
Downwardyield curve
Future expectation – when interest rates are expected to fall
Government policy of keeping interest rates relatively high might have the
effect
of forcing short-term interest rates higher than long-term rates
The market segmentation theory – the slope of the yield curve will
reflect different conditions in different segments of the market
Exchange rates
Effects the
The cost of imports
The value of exports
The costs and benefits of international borrowing and lending
32.
CHAPTER 2: FINANCIAL
STRATEGY
Internationalconstraints
Trading abroad – foreign exchange constraints, political issues, geographical
separation (i.e. issues in management control, language and cultural
barriers),
litigation(i.e. legislations and regulations in selling products in different
countries.
Eg. Shariah compliant in the Middle East)
Multinationals – one which owns or controls production facilities or
subsidiaries or service facilities outside the country in which it is based. Eg.
Carson and Cumberbatch PLC in Sri Lanka
33.
CHAPTER 2: FINANCIAL
STRATEGY
Treasurymanagement
A separate treasury department is set up in large companies to manage
cash (funds) and currency efficiently.
Motives for holding cash
Transaction motive – to meet day-to-day obligations
Precautionary motive – hold cash as a safety net
Speculative motive – to exploit investment opportunities
34.
CHAPTER 2: FINANCIAL
STRATEGY
Therole of treasurer
Corporate financial objectives – aims, policies and
strategies, systems
Liquidity management – working capital management, money
transmission management, money management and
investment, banking relationships
Funding management – funding policies, sources,
types, security, interest rates, duration, etc.
Currency management – exposure policies and
procedures, exchange dealings (i.e. futures and options),
exchange regulations
Corporate finance – raising equity, dividend policy, obtaining
stock exchange listing, M&A, business sales, project finance
and joint ventures, etc.
35.
CHAPTER 2: FINANCIAL
STRATEGY
Treasurypolicy
Aims of a treasury policy is to establish direction, specify
parameters and exercise control, and also provide a clear
framework and guidelines for decisions.
The areas covered are;
Counterparty exposure – i.e. counterparty limits and monitoring
Currency and interest rate risk
Funding risk- i.e. limits and targets for different sources of funding
Liquidity management
Investment management
Bank relationships
Treasury function as a cost centre or a profit centre?
[CHAPTER 3: FORECASTING& ANALYSIS]
Syllabus areas
Performance analysis
Cash forecasts
Forecasting financial statements – detailed example
Sensitivity analysis and changes in variations
Financing requirements
Mohamed Intikab Bin Ali
38.
PERFORMANCE ANALYSIS
Ratio analysisis the process of comparing and quantifying relationships
between financial variables, such as those variables found in the statement of
financial position (i.e. the balance sheet) and income statement of a company.
They are important in the following areas.
Measuring the achievement of corporate objectives
Investment appraisal
Working capital management
Capital structure
Business valuations
39.
PERFORMANCE ANALYSIS
Limitations ofration analysis
Availability of corporate information
Use of historical/ out of date information
Ratios are not definitive
Need for careful interpretation
Manipulation
Other information – ratios alone are not sufficient
40.
PERFORMANCE ANALYSIS
Financial ratioscan be categorised as follows.
1. Profitability ratios – GP/ NP Margin, ROCE, ROE, etc
2. Liquidity ratios – Current Ratio & Quick Ratio
3. Gearing and Capital structure/ Debt ratios – Capital Gearing, Interest Cover,
Debt Ratio, etc.
4. Operating/ activity ratios – Inventory days, Debtor days, Creditor Days, Inv.
T/O, etc
5. Investor/ Capital Market Ratios – EPS, P/E Ratio, DPS, Div. Cover, Div. Yield,
etc.
41.
PERFORMANCE ANALYSIS
Profitability andreturn ratios
Return on Capital Employed (ROCE)
ROCE gives a measure of how efficiently a business is using the funds available.
It measures how much is earned per Rs. 1 invested.
ROCE = Profit before interest and tax (PBIT) x100%
Capital Employed (CE)
PBIT = Operating profit CE = Non Current assets + Current Assets –
Current Liabilities;
or
= Share Capital + Reserves + Long Term Loans
Return on Equity (ROE)
ROE measures how much profit a company generates for its ordinary shareholders
with the money they have invested in the company
ROE = Profit after tax and preference dividends x100%
Book value of Shareholders’ Funds
Please refer p.65 for DuPont model where ROCE = Asset Turnover x Profit Margin
42.
PERFORMANCE ANALYSIS
Please referp. 66 for debt and gearing ratios, p. 67 for liquidity ratios and p. 68
for
investor ratios
Overtrading is when a business is trying to support too large a volume of trade with
the capital resources at its disposal
Symptoms of overtrading
Rapid increase in revenue
Rapid increase in current assets
Increase in non-current assets
Asset increases financed by trade payables/bank overdraft
Little/no increase in proprietors’ capital
Decrease in current/quick ratios
Liquidity deficit
43.
PERFORMANCE ANALYSIS
Other informationwhich gives a company’s performance
The revaluation of non-current assets
Share capital and reserves
Loans and other liabilities
Contingencies
Events after the statement of financial position date
Cash forecasts
Cash budgets – is a detailed budget of estimated cash inflows and
outflows incorporating both revenue and capital items
44.
PERFORMANCE ANALYSIS
Estimating aforecast of financial position
Can be used to assess the scale of funding requirements or cash surpluses expected
over time, and to act as a check on the realism of cash flow based forecast.
Trying to predict the cash and short-term investments
Each item should be estimated with its future value at a future date
Intangible non-current assets and long-term investments
Property, plant and equipment – purchases and disposals. Revaluations are
ignores
Current assets – inventory and receivables (can increase, decrease, remains the
same, can be in line with sales, etc.)
Current liabilities – trade payables and accruals, bank loans/ overdraft, taxation,
dividends payables
Non-current creditors and Accumulated profits
[CHAPTER 4: SHORT-TERMFINANCIAL STRATEGY]
Syllabus areas
Short-term financial strategy
Working capital management
Cash operating cycle
Managing inventories
Managing account receivables
Mohamed Intikab Bin Ali
Managing accounts payables
Working capital financing
Other factors to consider
49.
CHAPTER 4: SHORT-TERM
FINANCIALSTRATEGY
Short-term financial strategy
Working capital management
Cash operating cycle
Managing inventories
Managing account receivables
Managing accounts payables
Working capital financing
Other factors to consider
50.
SHORT-TERM FINANCIAL
STRATEGY
Short-term financialstrategy – is to strike a balance between liquidity and profitability
Working capital is the capital available for running the day to day operations of
an organisation. It can be calculated as follows.
The amount tied up in working capital is equal to the value of raw materials, work-in-
progress, finished goods inventories and accounts receivable less accounts payable.
The size of this net figure has a direct effect on the liquidity of an organisation.
Common causes of business failure due to working capital.
Demands of cash during periods of growth being too great (overtrading)
and overstocking
Inability to meet bills as they fall due
Working Capital = Current assets - Current Liabilities
51.
SHORT-TERM FINANCIAL
STRATEGY
Working capitalmanagement: Conservative vs aggressive approach
Conservative
Aims to reduce the risk of system
breakdown by holding high levels of
working capital
Customers are allowed generous
payment terms
High finished goods inventory –
avoid
stock out situations to customers
High raw materials and WIP - avoid
stock out situations for
production
Prompt payment for suppliers
Aggressive
Aims to reduce the financing cost and
increase profitability
Cutting inventories
Speeding up collection from
customers
Delaying payments for
suppliers
52.
SHORT-TERM FINANCIAL
STRATEGY
Cash operatingcycle
The cash operating cycle is the period of time which elapses between the point at
which cash begins to be expended on the production of a product and the collection of
cash
from a purchaser.
Inventory days Receivable days
Payable days
Cash Operating Cycle
Purchases Sales Receipts from receivables
Pay Payables
53.
SHORT-TERM FINANCIAL STRATEGY
Managinginventory
Holding costs
Cost of capital –
capital tied up in
inventory
Warehouse/
handling costs
Deterioration/
obsolescence
Insurance
Pilferage
Procuring costs
Ordering costs
Delivery costs
Shortage costs
Contribution from lost sales
Emergency inventory
Stock-out costs
54.
SHORT-TERM FINANCIAL
STRATEGY
Economic Orderquantity (EOQ) - is the optimal ordering quantity for an item
of inventory which will minimise costs
Where; D = Annual demand (in units), Co = Cost of placing one
order CH = Holding cost
Example on p. 107
Re-order level = maximum usage x maximum lead time
Safety inventory held when demand is uncertain or supply lead time
is variable
Average annual safety inventory cost
= Safety inventory quantity × annual unit inventory holding costs
55.
SHORT-TERM FINANCIAL
STRATEGY
Maximum inventorylevel = Re-order level + Re-order quantity – (Min. Usage x
Min. Lead time)
Buffer Safety inventory = Re-order level - (Avg. Usage x Avg. lead time)
Average inventory = Buffer safety inventory + (Re-order amount/ 2)
Example on p. 109 of the study text
56.
SHORT-TERM FINANCIAL
STRATEGY
Just InTime (JIT)
A policy of obtaining goods from suppliers at the latest possible time, avoiding the
need to carry materials / component inventory
Benefits of JIT
Lower inventory holding costs and manufacturing lead times
Higher labour productivity
Lower labour / scrap / warranty costs
Lower material purchase costs (discounts)
Lower number of transactions
57.
SHORT-TERM FINANCIAL
STRATEGY
Managing accountsreceivable
The inflow of cash into the organisation comes through debtors’ payments and
collections.
The company should have a credit policy which sets out the credit limit, credit
period and payments terms and conditions.
the company should have a robust system to monitor debtors and make
collections on-time when they fall due.
The debtor outstanding period can be calculated as follows.
Accounts Receivables Period = Receivables x 365
Credit Sales
58.
SHORT-TERM FINANCIAL STRATEGY
Managingaccounts receivable
A credit analysis system
(credit worthiness)
Trade references
Bank references
Credit rating agency
A credit control system
Decide on credit limit to be
offered for customer
Review regularly
A credit control policy factors to
consider
Administrative cost of debt collection
Procedure for controlling credit
Extra capital required to finance an
extension of credit
Extra capital required to finance an
increase of accounts receivable
Cost savings and additional cost in
operating the credit policy
Implementation of the policy
Effects of easing credit
59.
SHORT-TERM FINANCIAL
STRATEGY
Managing accountsreceivable
A debt collection system
Efficient administration
Aged listing of receivables
Regular statements and
reminders
Clear procedures for taking
legal action or charging
interest
Consider the use of a debt
factor
Analyse whether to use cash discounts to encourage early
payment
60.
SHORT-TERM FINANCIAL
STRATEGY
The benefitsof action to collect debts must be greater than the
costs incurred
Discounts for early settlement
Calculate:
Profits foregone by offering discount
Interest charge changes because customer paid at different
times and sales change
61.
SHORT-TERM FINANCIAL
STRATEGY
Factoring isdebt collection by factor company which advances
proportion of money due
Advantages of factoring
Saving in staff time / admin costs
New source of finance to help liquidity
Frees up management time
Supports a business when sales are rising
Disadvantages of factoring
Can be expensive
Loss of direct customer contact and goodwill
62.
SHORT-TERM FINANCIAL
STRATEGY
Managing AccountsPayable
Attempting to obtain satisfactory credit from suppliers
Attempting extend credit during periods of cash shortages
Maintaining good relations with regular and important suppliers
The cost of lost early payment discounts – (eg. - p. 133
[CHAPTER 5: EQUITYFINANCE]
Syllabus areas
Capital markets
Methods of obtaining a listing
Rights issues
Scrip dividends, bonus issues and share splits
Mohamed Intikab Bin Ali
CAPITAL MARKETS
Capital marketsare markets for trading in long-term finance
Stock markets – raising long-term finance. Eg. CSE in Sri Lanka.. Deals with
government securities (gilts) as well. Traded through the Central Depository
system
(CDS)
Primary markets – raise new finance
Secondary markets – trading of existing investments. Essential for marketability
Realisation of value – where owners can realise their investments by offering
them to the public by floating
Takeover by share exchange – taking over another company by issuing shares.
Only possible if shares offered can be traded in the CSE
67.
CAPITAL MARKETS
Institutionalinvestors – such as pension funds who has large amounts of
funds to invest in various assets to obtain a satisfactory return
Capital market participation
68.
CAPITAL MARKETS
Advantages ofstock market listing
Disadvantages of stock market listing
Greater public regulation, accountability and scrutiny
Diverse requirements of shareholders
Additional costs such as brokerage commissions and under writing
69.
CAPITAL MARKETS
Initialpublic offer (IPO) - The company sells shares to the public at large
Offer for sale by tender - means allotting shares at the highest price they will
be taken up
Prospectus issue – where shares are sold directly to the general public through
prospectus. It is known as ‘offers by prospectus’
Placing - Means arranging for most of an issue to be bought by a small number
of
institutional investors. It is cheaper than an IPO
An introduction – is obtained for greater marketability of shares
Underwriting – making an arrangement to raise finance on shares which were
not subscribed for a fee. Eg. The fee of 2.25% for the shares not subscribed
70.
CAPITAL MARKETS
Pricing sharesfor a stock market launch
Venture capital – is risk capital, normally provided in return for an equity
stake
71.
CAPITAL MARKETS
Private equity– a group of companies tat raises funds from investors, typically
pension funds, and uses the money to buy companies which they run privately
Preference shares – carries a fixed rate of dividends. They can be cumulative
and non-cumulative.
72.
RIGHTS ISSUES
Rights issues– raising of new capital by giving existing shareholders the right to
subscribe to new shares in proportion to their current holdings.
Offer price will be lower than current market price of existing shares
Advantages of rights issue
Lower issue costs than IPO
Shareholders acquire more shares at discount
Relative voting rights unaffected if rights taken up
Value of rights - Theoretical ex-rights price – Issue price
73.
RIGHTS ISSUES
Value ofrights - Theoretical ex-rights price – Issue price
Yield adjusted theoretical ex-rights
price
The value of a right
74.
SCRIP DIVIDENDS, BONUS
ISSUESAND SHARE SPLITS
Scrip dividends – payment of dividends by issuing additional shares
rather than cash
Bonus issues – a bonus/ scrip/ capitalisation issue is the
capitalisation of the reserves of an entity by the issue of new shares to
existing shareholders, in proportion to their holdings
Share splits – splitting the ordinary shares into larger number with
lower nominal value
The difference between a bonus issue and a share split is that a
bonus issue converts equity reserve into share capital, where as a
share split leaves reserves unaffected
75.
[CHAPTER 6: DEBTFINANCE]
Syllabus areas
Medium-term finance
Long-term debt
Convertible securities
Warrants
International debt finance
Small and medium sized entities
Mohamed Intikab Bin Ali
76.
CHAPTER 6: DEBTFINANCE
Debt Finance
Medium Term
Term Loans
Mezzanine
Finance
Long Term
Bonds Debentures
Preference
Shares
Warrants
77.
MEDIUM-TERM FINANCE
Debt finance
Availability depends on size of business
Duration of loan?
Fixed or floating rate?
Security and covenants?
All of these factors will make a difference to the cost of the debt
finance
78.
MEDIUM-TERM FINANCE
Termloans
Mezzanine finance
• it is commonly used for management buy-outs.
• It is used to bridge the gap between the amount of loans that banks are
prepared to make and the amount of equity funding available
• It is an unsecured loan that rank after secured debt but ahead of equity in
a liquidation
Creditworthiness - from the lender’s viewpoint, the interest rate charged
on loan finance will normally reflect the risk associated with the loan, and an
assessment of a company’s creditworthiness will be based on purpose,
amount, repayment terms, duration, and security
79.
LONG-TERM FINANCE
Bonds– it describes various forms of long-term debt a company may issue
• Redeemable
• Irredeemable
• Floating rate
• Zero coupon
• Convertible – i.e. premium or discount
Debentures/ Bonds involves a series of fixed interest payments and a principal
payment to discharge the debt - debt is secured against issuer’s asset
Coupons – periodic cash flows on the bond/debenture, determined by the
coupon rate
Face Value – Par value or maturity value, to be repaid upon maturity of the
bond/ debenture
80.
LONG-TERM FINANCE
Fixedcharge - security would be related to a specific asset or group of
assets. Eg. Land and building
Floating charge– security would be related to certain assets where the
values might be different at different point in time. Eg. inventory
Deep discount bonds – offered at a large discount on the face value of
the debt. The investor is attracted to its large capital gain of the bond.
Zero coupon bonds are issued at a discount, with no interest paid on
them
Convertible bonds give the holder the right to convert to other
securities, normally ordinary shares, at a pre-determined price / rate and
time
81.
LONG-TERM FINANCE
Convertiblebonds give the holder the right to convert to other
securities, normally ordinary shares, at a pre-determined price / rate and
time
Redeemable and irredeemable bonds
Redemption is the repayment of bonds at its maturity
Yield to maturity – is the effective yield or internal rate of return of the
bond
Preference shares pay a fixed rate dividend which is not tax-deductible for
the company.
• These are generally riskier than bonds since they rank behind debt in
the event of a liquidation, although they rank ahead of ordinary shares.
• There are cumulative and non cumulative preference shares
LONG-TERM FINANCE
Value ofirredeemable bonds
Securitisation – bundling together of financial assets into another
financial instrument, often to increase liquidity
89.
CONVERTIBLE SECURITIES
Convertible bonds– is a liability that gives the holder the right to convert into
another instrument, normally ordinary shares, at a pre-determined price/ rate and
time
Conversion value = Conversion ratio x Market price per ordinary share
Conversion premium = Current market value – Current conversion value
Example
WA
RR
ANT
S
Warrant –is a right given by a company to an investor, allowing the investor
to subscribe for new shares at a future date at a fixed, pre-determined
exercise price
Advantages
Do not involve the payment of any interest or dividends
Warrants make a bond issue more attractive and may make an issue of
unsecured bonds possible where adequate security is lacking
Provide a means of generating additional equity funds in the future without
any immediate dilution in EPS
Disadvantages
When exercised, they will result in dilution of share capital
May be exercised when a business does not need additional capital
Has less control over exercise of warrants than it does on the exercise of
share capital
93.
INTERNATIONAL DEBT
FINANCE
Eurocurrency– is currency which is held by individuals and institutions
outside the country of issue of that currency
Eurodollars – are US dollars deposited with, or borrowed from, a bank
outside the US
Eurobonds – are bonds sold outside the jurisdiction of the country in
whose currency the bond is denominated
Please read p.187 and 188 for the steps involved in issuing Eurobonds and
for advantages and disadvantages
Please read p.189 for small and medium sized entities
94.
[CHAPTER 7: LEASEFINANCE]
Syllabus areas
Leasing as a source of finance
Lease or buy decisions
Mohamed Intikab Bin Ali
95.
OPERATING LEASE
There arethree types of lease:
1. Operating lease
2. Finance lease
3. Sale and lease back assets
Operating lease – are rental agreements between the user of the leased
assets (the lessee) and a provider of finance (the lessor)
• Lessor bears most of risk and rewards
• Lessor responsible for servicing and maintenance
• Period of lease short, less than useful economic life of asset
• Asset not shown on lessee’s statement of financial position
96.
FINANCE LEASE
Financelease – is a lease agreement that transfers substantially all the
risks and rewards incidental to ownership of an asset from the lessor to the
lessee
• The lessee is normally responsible for the upkeep, servicing and
maintenance of the asset
• The lease has a primary period, which covers all or most of the useful
life of the asset
• The lessee may be able to continue to lease the asset for an indefinite
secondary period, in return for a very low nominal rent, sometimes called
‘peppercorn rent’
• Asset shown on lessee’s statement of financial position
FINANCE LEASE
Allocating thefinance charge
There are two methods to allocate the finance charge
1. Actuarial method
2. Sum of digits method
Actuarial method – the actuarial method of allocating the finance charge uses
a periodic interest rate to calculate interest on the outstanding amount of the
lease
At the beginning of the lease, the capital investment is equal to the fair value of
the asset (less any initial deposit paid by the lease)
FINANCE LEASE
Sumof digits method – splits the total interest without reference to a rate
of interest in such a way that the greater proportion falls in the earlier years.
The steps are as follows.
1. Assign the digits to each installment,
2. Add the digits [i.e. n(n+1)/2], and
3. Calculate the interest charge for each installment
SALE AND LEASEBACK
ARRANGEMENTS
Sale and leaseback arrangements - the business sells an asset to a
financial institution and leases it back to raise immediate funds
Disadvantages
The company looses ownership of a valuable asset
The future borrowing capacity of the firm will be reduced
The company is contractually committed to occupy the property for many
years ahead, and this can be restricting
The real cost is likely to be high – frequent rent reviews
104.
LEASE OR BUYDECISONS
Lease or buy decisions- Example
A company has decided to invest in a machine that would cost Rs. 20,000,000
to buy outright or which could be leased at Rs. 5,000,000 per year for five years.
The company's post tax cost of borrowing is 10%.
Should the company buy or lease the machine?
105.
LEASE OR BUYDECISONS
Lease or buy decisions with taxation
Taxation adds the following complications:
If the asset is bought, then the owner will enjoy capital allowances (which
make buying cheaper). To complete the story, there will usually be
disposal proceeds also.
If the asset is leased, tax relief will be allowed on the lease payments.
106.
LEASE OR BUYDECISONS
Lease or buy decisions with taxation –
Example
107.
LEASE OR BUYDECISONS
Lease or buy decisions with taxation –
Example
108.
LEASE OR BUYDECISONS
Lease or buy decisions with taxation – Example
An asset costs $100,000 (at the start of an accounting period) and will receive
tax allowances on a 25% straight line basis. It can be sold in four years for
$10,000.
Alternatively, it can be leased for four years at $30,000 per year, payable in
advance.
Post tax cost of capital = 10%; tax = 30% and is paid one year after the end of
the accounting period to which it relates.
109.
LEASE OR BUYDECISONS
Lease or buy decisions with taxation – Example
An asset costs $100,000 and will receive tax allowances on a 25% straight
line basis. It can be sold in four years for $10,000.
Purchasing
0 1 2 3 4 5
Cost (100,000) 10,000
TAD/Bal
allowan
ce
7,50
0
7,50
0
7,500 4,500
Total (100,000) – 7,50
0
7,50
0
17,500 4,500
10% factor 1 0.909 0.82
6
0.75
1
0.683 0.621
PV (100,000) – 6,19
5
5,63
3
11,953 2,794
PV of purchasing = $73,425, ie $100,000, reduced by capital allowances and
scrap value.
110.
LEASE OR BUYDECISIONS
Lease or buy decisions with taxation – Example
Alternatively, it can be leased for four years at $30,000 per year, payable in
advance.
Leasing
PV of leasing = a cost of $78,651.
0 1 2 3 4 5
Lease (30,000) (30,000) (30,000) (30,000)
Tax relief
at 30%
9,000 9,000 9,000 9,000
Total (30,000) (30,000) (21,000) (21,000) 9,000 9,000
10% factor 1 0.909 0.826 0.751 0.683 0.621
PV (30,000) (27,270) (17,346) (15,771) 6,147 5,589
111.
[CHAPTER 8: THECOST OF CAPITAL]
Syllabus areas
Investment decisions, financing and the cost of
capital
The dividend valuation model
The capital assets pricing model
The cost of debt
The weighted average cost of capital
Mohamed Intikab Bin Ali
COST OF ORDINARYSHARES
Calculating the cost of ordinary shares
Capital Assets Pricing Model (CAPM)
Unsystematic risk
Specific to the company
Can be reduced or eliminated by
diversification
Systematic risk
Due to variations in market activity
Cannot be diversified away
THE WEIGHTED AVERAGE
COSTOF CAPITAL
Calculating the Weighted Average Cost of Capital (WACC)
Where:
Ke is cost of equity
Ve is market value of equity
Kd is cost of debt
Vd is market value of debt
[Use market values rather
than book
values unless market values unavailable
(unquoted company)]
Assumptions for WACC
Project small relative to company and has same
business risk as company
WACC reflects company’s long-term future capital
structure and costs
New investments financed by new funds
Cost of capital reflects marginal cost
120.
CAPITAL STRUCTURE 6
Example:
1.An entity has the following information
in its statement of financial position.
Rs. '000
Ordinary shares of Rs 50
12% unsecured bonds
25,000
10,000
The ordinary shares are currently quoted at Rs. 130 each and the bonds
are trading at Rs. 72 per Rs. 100 nominal. The ordinary dividend of Rs.15
has just been paid with an expected growth rate of 10%. Corporation tax
is currently 30%.
Calculate the weighted average cost of capital for this entity.
121.
CAPITAL STRUCTURE 7
Solution
Rs.'000
No. of
Shares
/
Bond
s
MV (Rs.
'000)
W.Avg.
%
of
Tot
al
Cost WACC
Ordinary shares of Rs 50 25,000 500,000 65,000 90% 22.7%
20.4%
12% unsecured bonds 10,000 100,000
7,200
10% 11.7%
1.2%
72,200
21.6%
122.
[CHAPTER 9: CAPITALSTRUCTURE]
Syllabus areas
The capital structure decisions
The effects of capital structure on ratios
Theories of capital structure
Project specific capital structure
Mohamed Intikab Bin Ali
123.
CAPITAL STRUCTURE
DECISIONS
Whatrisk does the capital structure reflect of a company?
What are the advantages and disadvantages of using debt as means of
financing the capital structure?
124.
THE EFFECTS OFCAPITAL
STRUCTURE ON RATIOS
Gearing
Financial gearing – reflects the financial risk based on the capital
structure
Operating gearing – business risk
Interest cover – measures the financial risk
125.
THEORIES OF CAPITAL
STRUCTURE
Thetraditional theory of
WACC Traditional theory
There is an optimal capital mix at which the weighted average cost of capital
is minimised
Shareholders demand increased returns to compensate for greater risk as
gearing rises
However debt costs are
lower leading to
lower overall
cost of capital
At high gearing debt
holders also
require higher
returns
This leads to an increase
in overall cost of
capital
126.
THEORIES OF CAPITAL
STRUCTURE
Modiglianiand Miller theory ignoring tax
The weighted average cost of capital is not influenced by changes in
capital structure
The benefits of issuing debt are counter balanced by the increased cost of
equity
This means that (without
tax implications) the
WACC remains
constant at any level
of gearing
127.
THEORIES OF CAPITAL
STRUCTURE
Modiglianiand Miller theory with tax
The weighted average cost of capital is not influenced by changes in
capital structure
The benefits of issuing debt are counter balanced by the increased cost of
equity
This means that (without
tax implications) the
WACC remains
constant at any level
of gearing
With the tax benefit of
debt however the
WACC will fall as
gearing levels
increase
128.
PROJECT SPECIFIC CAPITAL
STRUCTURE
Impactof cost of capital on investments
The lower a company’s WACC, the higher the NPV of its future cash flows
and the higher its market value
Cost of capital can be calculated using WACC
Projects must be small relative to company
Same financial risk from existing capital structure
Project has same business risk as company
The marginal cost of capital can also be calculated using the CAPM
Project has a different business risk
Finance used to fund investment changes capital structure
Use geared betas
REVISION OF SECTION1 & 2
1. A company has issued 10% convertible bonds which are due to be
redeemed in four years at a 5% premium. They are currently quoted at $80
per $100 nominal. $100 nominal can be converted into 25 shares in four
years.
The share price is currently $4.00 and is expected to grow at a rate of 4%
pa. Assume a 30% rate of tax.
Calculate the cost of the convertible debt.
2. A company's shares are valued at $5.80. Dividends grow 5% pa. The
current dividend of $0.45 is about to be paid.
What is the cost of equity?
133.
REVISION OF SECTION1 & 2
A company has the following capital structure:
Equity: 2 million shares valued at $3.30 each. Current dividend of $0.06 about to
be paid. Dividends for each of the last two years were $0.051 and $0.0415
(earliest)
Debt: 0.5 million 8% debentures valued at $112 per cent. Redeemable in
four year's time at a premium of 20%. Corporation tax is 30%.
What is the WACC?
.
134.
REVISION OF SECTION1 & 2
Rupab Co has in issue five million shares with a market value of $3.81 per share.
The equity beta of the company is 1.2. The yield on short-term government debt
is 4.5% per year and the equity risk premium is approximately 5% per year.
The debt finance of Rupab Co consists of bonds with a total book value of
$2 million. These bonds pay annual interest before tax of 7%. The par value
and market value of each bond is $100.
Rupab Co pays taxation one year in arrears at an annual rate of 25%.
Required: Calculate the after-tax weighted average cost of capital of Rupab
Co. (6 marks)
135.
REVISION OF SECTION1 & 2
Cost of equity = 4.5 + (1.2 × 5) = 10.5%
The bonds are trading at par so the before-tax cost of debt is the same as
the interest rate on the bonds, 7%.
After-tax cost of debt = 7 × (1 – 0.25) = 5.25%
Market value of equity = 5m × 3.81 = $19.05 million
Market value of debt is equal to its par value of $2
million
Sum of market values of equity and debt = 19.05 + 2 =
$21.05 million
WACC = (10.5% × 19.05/21.05) + (5.25% × 2/21.05) =
10.0%
136.
REVISION OF SECTION1 & 2
AMH Co $’000
Ordinary shares ($0.5) 4,000
Reserves
Long-term liabilities
4% Preference shares ($1) 3,000
7% Bonds
redeemable after
six years
3,000
Long-term bank loan
Ex div MV ordinary shares = $4.70 per
share; ordinary dividend of 36.3 cents per
share has just been paid. Recent dividends
(cents)
2008 30.9
2010 33.6
2009 32.2
2011 35.0
Ex div MV preference shares (not
redeemable)= 40 cents per share.
The bank loan rate = 4%
The 7% bonds premium have an ex interest market value of $104.50 per bond and
are redeemable at a 5% premium. Tax = 30%. Required: calculate AMH Co's WACC
137.
REVISION OF SECTION1,2 & 3
A company has the following capital structure:
1 million $1 ordinary shares, MV = $2/share.
0.75 million 8% debentures, MV = $80%.
Its current cost of equity = 20%. Rf = 6% Rm = 16% T = 30%.
What would the company's cost of equity be if it were all equity financed?
Hint calculate the geared beta using CAPM and then calculate the un geared
beta. And then calculate the cost of equity using CAPM
βa = Ve βe
(Ve + Vd(1 – T))
138.
REVISION OF SECTION1,2 & 3
•A HOUSE-BUILDING COMPANY IS FINANCED IN THE RATIO D:E 2:3. IT HAS A COST
OF EQUITY OF 21%. IT IS CONSIDERING EXPANDING INTO OFFICE MAINTENANCE.
•A LISTED COMPANY IN OFFICE MAINTENANCE HAS A COST OF EQUITY OF 15%. IT
IS FINANCED IN THE RATIO D:E 1:1.
•REQUIRED RETURN = RF + Β(RM – RF); RM =16%; RF = 4%; T=30%
•IF THE HOUSE-BUILDING COMPANY FINANCES ITS EXPANSION PURELY BY
EQUITY, WHAT RETURN WOULD BE REQUIRED?
βa = Ve βe
(Ve + Vd(1 – T))
139.
[CHAPTER 10: DIVIDENDPOLICY]
Syllabus areas
Dividend policy – practical issues
Dividend policy - theories
Mohamed Intikab Bin Ali
140.
DIVIDEND POLICY –
PRACTICALISSUES
Dividend policy will depend upon many factors
including:
Sufficient funds available
Law on distributable profits
Loan agreements
Funds for asset replacement
Investors preference for either dividend / capital gains
Preferred gearing level
Other sources of finance
Consistency
Avoid large falls / rises
141.
DIVIDEND POLICY –THEORIES
Theories of dividend
policy Residual theory
If a company can identify projects with positive NPVs, it should invest in
them. Dividends should be paid only if investment opportunities are
exhausted.
Traditional view
The price of a share depends on the mix of dividends, given shareholders’
required rate of return, growth
Irrelevancy theory
MM proposed that in a tax-free world, shareholders are indifferent between
dividends and capital gains, and the value of a company is determined solely
by the ‘earning power’ of its assets and investment
142.
DIVIDEND POLICY –THEORIES
Types of dividend
Scrip dividend is a dividend payment in the form of new shares, not cash
Scrip issue is an issue of new shares to current shareholders by converting
equity reserves
Share repurchase is a use for surplus cash, increases EPS and increases
gearing
It may prevent a takeover or enable a quoted company to withdraw from
the
stock market
143.
[CHAPTER 11: MARKETEFFICIENCY]
Syllabus areas
Share prices and investment returns
The efficient market hypothesis
Mohamed Intikab Bin Ali
144.
SHARE PRICES AND
INVESTMENTRETURNS
Theories of share price behaviour
The fundamental analysis theory
Technical analysis (chartist theory)
Random walk theory
The fundamental analysis theory
The value of a share is derived from a valuation of estimated future dividend
(dividend valuation model)
Fundamental analysis is the analysis of internal and external influences that
directly affect the operations of a company with a view to assisting in
investment decisions. Information include industry trends, competitor analysis,
financial statements, fiscal policy, etc.
145.
SHARE PRICES AND
INVESTMENTRETURNS
Technical analysis (chartist theory)
Attempts to predict share price movements by assuming that past price
patterns will be repeated
Technical analysis is the analysis of past movements in the prices of financial
instruments, currencies, commodities etc. with a view to, by applying
analytical techniques, predicting future price movements
Random walk theory
It is consistent with the traditional theory. However, the share price will be
altered
when new information becomes available.
One of its underlying assumptions is that all relevant information about a
company is available to all potential investors who will act on the information in
a rational manner
146.
THE EFFICIENT MARKET
HYPOTHESIS
Theefficient market hypothesis is the theory that the stock market
reacts immediately to all the information that is available
The features of an efficient market are:
Prices reflect all relevant information
No individual dominates market
Transaction costs insignificant
There are three forms of efficiency:
Weak-form efficiency suggests prices reflect all relevant information about past
price movements and their implications
Semi strong-form efficiency suggests prices are also influenced by publicly
available knowledge
Strong-form efficiency suggests prices are also influenced by inside
information
147.
THE EFFICIENT MARKET
HYPOTHESIS
Theimplications of an efficient market are:
The share price of a company is the best basis for a takeover bid
A company should concentrate on maximising NPV of investments
There is no point in attempting to mislead the market
Practical considerations
Efficiency in a market relates to how quickly and accurately prices adjust to new
information
Liquidity is the ease of dealing in shares
Large companies have better liquidity and greater marketability than
small companies
Irrationality often drives the stock market eg seasonal effects, short-run
overreactions
148.
THE EFFICIENT MARKET
HYPOTHESIS
Practicalconsiderations
Market capitalisation is the market value of a company’s shares multiplied by the
number of issued shares
The return from investing in smaller companies can be greater in the long run
Behavioural finance attempts to explain the market implications of the
psychological factors behind investor decisions
Suggests that irrational investor behaviour may cause over-reactions
in prices
149.
[CHAPTER 12: INVESTMENTAPPRAISAL
TECHNIQUES]
Syllabus areas
Investments and projects
Capital investment appraisal
Risk and uncertainty
Investment performance and post-completion audit
Mohamed Intikab Bin Ali
INVESTMENTS AND PROJECTS
2
Natureof projects
They have a defined beginning and end
They have resources allocated to them
They are intended to be done only once
There are clear goals/ objectives and a plan to achieve it
They have cross functional teams to drive the project
Project success factors
Clearly defined mission and goals
Top management support
Competent project manager and a project team
Sufficient resources – finance, material, people, processes
Excellent communication channels
152.
CAPITAL INVESTMENTS
APPRAISAL 1
CapitalInvestment Appraisal Techniques
Investment
Appraisal
Techniques
Non-Discounted Cash
flow Methods
Payback Period
Accounting (book)
rate of return
(AROR)
Discounted Cash flow
Methods
Profitability Index
(PI)
Internal Rate of
Return (IRR)/ MIRR
Net Present Value
(NPV)
153.
CAPITAL INVESTMENTS
APPRAISAL 2
AccountingRate of Return (AROR)
Also known as Return on Capital Employed (ROCE) or Return on Investment
(ROI)
Can be used to rank projects taking place over a number of years (using average
profits and investment)
Can also rank mutually exclusive projects
There are several ways of calculating the AROR/ ROCE/ ROI
Criteria for acceptance
If AROR > Hurdle rate
If AROR < Hurdle rate
Accept project
Reject project
CAPITAL INVESTMENTS
APPRAISAL 6
PaybackPeriod
Payback is the time taken for the cash inflows from a capital investment project
to equal the cash outflows
(When will the project’s cash flows allow us to break-even?)
The concept behind the payback approach is to favour investments that return
the
invested capital as quickly as possible.
Usually expressed in years
It is used as a minimum target / first screening method
Example Rs. ’000 X Y
Investment 60 60
Year 1 profits 20 50
Year 2 profits 30 20
Year 3 profits 50 5
Calculate the payback period.
158.
CAPITAL INVESTMENTS
APPRAISAL 7
NetPresent Value (NPV)
The NPV is the total present value of expected cash flows minus the initial outlay.
NPV measures the improvement/ deterioration of a firm’s value as a result of
undertaking a project in today’s rupees.
It considers the profitability during the total life of the project and take into
account the time value of money.
Relevant cost are – cash based, opportunity cost, futuristic, incremental.
Ignores sunk cost and centrally allocated costs (overheads)
The decision rule;
If NPV > 0
If NPV < 0
Accept project
Reject project
RISK AND UNCERTAINTY
Followingare the methods to deal with risk and
certainty
1. Sensitivity analysis
2. Certainty equivalents
3. Probability analysis
4. Simulation models
5. Discounted payback
6. Risk adjusted discounting factor
165.
RISK AND UNCERTAINTY
Followingare the methods to deal with risk and certainty
1. Sensitivity analysis
NPV could depend on a number of uncertain variables such as selling price, sales
volume, initial cost, operating cash flows, discounting factor and benefits
RISK AND UNCERTAINTY
BYTHIS METHOD, THE EXPECTED CASH FLOWS ARE CONVERTED TO
EQUIVALENT RISKLESS AMOUNTS.
THE CASH FLOWS ARE DISCOUNTED AT THE RISK FREE RATE
THE DISADVANTAGE OF THIS METHOD IS THE SUBJECTIVITY INVOLVED IN
ADJUSTING THE CASH FLOWS
2. Certainty equivalents
[CHAPTER 13: INTERNATIONALINVESTMENT
APPRAISAL ]
Syllabus areas
International Investments
International Investment Appraisal
Mohamed Intikab Bin Ali
FINANCING OVERSEAS
SUBSIDIARIES
Following arethe ways in which we can finance overseas operations
1. Using free cash flows
2. Using parent company’s home currency
3. Using subsidiary’s home currency
4. Using other country’s capital markets
The risks of overseas investments
5. Foreign exchange risk
6. Political ad country risks
7. Geographical separation
8. Litigation risks
9. Risks of loss of goods in transit
183.
IMPLICATIONS OF FOREIGN
INVESTMENT
Followingare the implications of foreign investment
1. Cost of capital will be high since the risk is high than the domestic market
2. Translation risk due to the conversion f foreign currency into the local currency
Tax implications
Profits of an overseas branch or agency
Income from foreign securities
Dividends from foreign subsidiary
Gains made on disposal of foreign assets
Double taxation relief (DTR)
[CHAPTER 15: BUSINESSVALUATION ]
Syllabus areas
Reasons for valuation and valuation issues
Assets valuation bases
Earnings valuation bases
Dividend valuation bases
Cash flow valuation bases
Intangible assests and intellectual capital
Mohamed Intikab Bin Ali
188.
REASONS FOR VALUATIONS
A company going public
Merging with another company
Selling shares
When pledging shares as collateral
Tax purposes
When a group of companies wants to sell its subsidiaries
When companies are broken in liquidation
When a stake of a company needs to be sold out (eg. Yahoo vs Microsoft
bid)
189.
GENERAL FACTORS AFFECTING
VALUATIONS
The size of the shareholdings to be acquired
The distribution of other shareholdings
The rights related to the shares
Any restrictions in transfer
Valuing listed companies – (S.P x No. of shares) Market capitalisation
Valuing unlisted companies
190.
VALUATION METHODS
Assetsbased
Earnings based
Dividend based – dividend growth model
Cash flow based
191.
VALUATION METHODS
Assetsbased
o net assets based on historical, replacement or
NRV
Earnings based
o P/E Ratio
o Earnings yield
o ARR
Dividend based – dividend growth model
Cash flow based
VALUATION ISSUES
Impactof market efficiency
Availability of information
Mergers and takeovers
Share valuation and change in market structure
Traditional approach – firm’s value is maximised by reducing the cost of
capital
Net operating income approach – the value of a geared company will
always
be greater than its ungeared counterpart
Valuation prior to flotation
Refer examples in p. 467 to 472 for illustration
196.
SHARE VALUATION AND
CHANGEIN CAPITAL
STRUCTURE
Impact of market efficiency
Availability of information
Mergers and takeovers
Share valuation and change in market structure
Traditional approach – firm’s value is maximised by reducing the cost of
capital
Net operating income approach – the value of a geared company will
always
be greater than its ungeared counterpart
Valuation prior to flotation
Refer examples in p. 467 to 472 for illustration
EVA
AND
MVA
Market value added(MVA) approach
Shows how much management has added to the value of capital contributed by the capital
providers
MVA = Market Value of Debt + Market Value of Equity – Book Value of
Equity
MVA related to EVA: MVA is simply PV of future EVAs of the company
If market value and book value of debt are the same, MVA is the difference between market value
of common stock and equity capital of the firm
Economic Value Added (EVATM)
EVATM = NOPAT - (cost of capital x capital employed)
Adjustments to NOPAT
Add:
Interest on
debt
Goodwill
written off
Accounting
depreciation
Increases in
provisions
Net
capitalised
intangibles
[CHAPTER 16: AMALGAMATIONSAND
RESTRUCTURING]
Syllabus areas
Mergers and acquisitions
The conduct of a takeover
Payment methods
Valuation of mergers and acquisitions
Regulation of takeovers and Post-acquisition integration
Impact of mergers and takeovers on stakeholders
Exit strategies
Mohamed Intikab Bin Ali
EVA
AND
MVA
Market value added(MVA) approach
Shows how much management has added to the value of capital contributed by the capital
providers
MVA = Market Value of Debt + Market Value of Equity – Book Value of
Equity
MVA related to EVA: MVA is simply PV of future EVAs of the company
If market value and book value of debt are the same, MVA is the difference between market value
of common stock and equity capital of the firm
Economic Value Added (EVATM)
EVATM = NOPAT - (cost of capital x capital employed)
Adjustments to NOPAT
Add:
Interest on
debt
Goodwill
written off
Accounting
depreciation
Increases in
provisions
Net
capitalised
intangibles
220.
[CHAPTER 17: CORPORATEFAILURE AND
RECONSTRUCTION]
Mohamed Intikab Bin Ali
Syllabus areas
Predicting business failure
Assessment of corporate failure
prediction models
Performance improvement
strategies and corporate failure
Organisational survival and life
cycle issues
Implementing performance improvement
strategies
Implementing performance improvement
strategies
Reconstruction schemes
Financial reconstructions
Leverage buyouts (LBO)
Market response to financial
reconstruction
[CHAPTER 19: MANAGINGFOREIGN EXCHANGE
RISK]
Mohamed Intikab Bin Ali
Syllabus areas
Translation, transaction and economic risk
Exchange rates
Internal hedging techniques
Forward contracts
Money market hedging
Choosing a hedging method
Currency futures, options and swaps
Devising a foreign currency hedging strategy
225.
TRANSACTION, TRANSLATION
AND ECONOMICRISKS
Translation: differences arise when consolidating foreign subsidiaries and
branches.
No cash flow effect
Value of foreign operations rise and fall as exchange rates alter
The effect can be reduced by using loans in the foreign currency to part-
finance the subsidiary, because the foreign currency assets and liabilities will
partially cancel
226.
TRANSACTION, TRANSLATION
AND ECONOMICRISKS
Transaction: imports and exports where payments and receipts depend on
exchange rates.
The most important source of currency risk in the exam
Many techniques to reduce the risk:
Invoicing in domestic currency
Leading and lagging
Matching assets and liabilities
Forward contracts
Interest rate hedging
Futures
Options
227.
TRANSACTION, TRANSLATION
AND ECONOMICRISKS
Economic risk: long term exchange rate fluctuations affect the competitiveness of
exports and imports.
If a currency gets stronger (ie more expensive) its products will become more
expensive in export markets.
If a currency gets stronger imports become cheaper when translated from the
foreign currency. (This can affect the competitiveness of home businesses
which neither import nor export.)
The only defence is to diversify the customer and supplier base and hope
that
not all currencies move in the same direction.
EXCHANGE RATE 3
Youare a US importer and have to pay an Indian supplier Rupees 500,000. Exchange
rate quoted is:
INR/US$ = 60.1853 – 60.2354
How much will you pay in US$?
You are an Australian exporter and need to change €30,000 from an overseas sale
into Australian $ (AUD). The exchange rates quoted by your bank is:
€/AUD 0.6833 – 0.6843
How much will you receive AU$?
231.
HEDGING TECHNIQUES
Invoicingin domestic currency
Leading (accelerating) and lagging (delaying) payments to avoid potential
additional costs due to currency rate movements
Matching receipts and payments
Netting – credit balances are netted off against debit balances
Forward contract - sets in advance the rate at which a specified quantity
of
currency will be bought and sold at a specified date in the future.
A forward contract is binding: the agreed amount of currency must be
delivered or paid for.
Money market hedging
232.
HEDGING TECHNIQUES
EXAMPLES
Forward contract
AUK company has made a sale to a US customer for $5 million. Payment will
be received in three months.
The company will protect itself against exchange rate risk by taking out a
forward contract to deliver $5 million in three months.
Three month forward rate = 1.5299 ± 0.0006.
What is the £ receipt from the transaction?
233.
MONEY MARKET HEDGING
TECHNIQUES1
Money market hedging
The result is very similar to forward contracts, but the process is quite
complex.
Risk is eliminated by changing the currency now rather than when it is
received or paid.
We need to look at two cases: receiving a foreign currency amount
and paying a foreign currency amount.
234.
MONEY MARKET HEDGING
TECHNIQUES2
Money market hedging
The result is very similar to forward contracts, but the process is quite complex.
Risk is eliminated by changing the currency now rather than when it is received
or paid.
We need to look at two cases: receiving a foreign currency amount and paying
a foreign currency amount.
235.
MONEY MARKET HEDGING
TECHNIQUES3
A German manufacturer will receive US $5m in three months.
Borrow enough US$ now
to become $5m in three
months after interest
charged
Convert the US$ amount
borrowed at the spot €/$
rate: the German company
now has a definite, risk
free amount of €
The loan grows to $5m in
three months
Use the $5 million
received in three months
to pay back the loan.
1
2
3
4
236.
MONEY MARKET HEDGING
TECHNIQUES4
A German manufacturer will receive US $5m in three months.
Spot rate for €/US$ = 0.7524
US 3 month interest rates = 2.5% – 3.2% pa
€ 3 month interest rates = 0.2% – 0.8% pa
Show how exchange rate risk can be managed using money market hedging.
237.
MONEY MARKET HEDGING
TECHNIQUES5
A German manufacturer will receive US $5m in three months. Spot rate for €/US$
= 0.7524; US 3 month rates = 2.5% – 3.2% pa € 3 month rates = 0.2% – 0.8% pa
1. Borrow enough $ now to become $5m in three months
The bank will charge 3.2% for borrowing (the higher US $ rate). This is
always quoted for 12 months, but will apply for three month loans. Therefore
borrow
$X so that:
$X (1 + (0.032/4)) = 5,000,000
$X = 5,000,000/ (1 + (0.032/4)) = $4,960,317
238.
MONEY MARKET HEDGING
TECHNIQUES6
A German manufacturer will receive US $5m in three months. Spot rate for €/US$
= 0.7524; US 3 month rates = 2.5% – 3.2% pa € 3 month rates = 0.2% – 0.8% pa
2. Convert $4,960,317 at the spot rate of 0.7524 €/$ to obtain $4,960,317 ×
0.7524 = € 3,732,143 now [Note that this amount is received now so is
certain.]
3. The loan of $4,960,317 will grow to $5m in three months and the $5m receipt
from the US customer will pay this off precisely. Using a $ receipt to pay
$ will not involve exchange risk.
The € 3,732,143 received now can be spent now.
Alternatively, it can be invested for three months (to match the time of the receipt) at
the € rate to become: € 3,732,143 × (1 + (0.002/4)) = € 3,734,009
239.
MONEY MARKET HEDGING
TECHNIQUES7
A UK importer must pay US $10m in three months.
Deposit enough US$ now
to become $10m in three
months after interest
earned
Convert £ now to the
required the US$ amount
to be deposited. The UK
company has paid a
definite, risk free
amount of £ for $
The deposit grows to
$10m in three months
The $10 million is used to 4
pay the supplier in three
months.
1
2
3
240.
MONEY MARKET HEDGING
TECHNIQUES8
A UK importer must pay US $10m in three months.
Spot rate for £/US$ = 1.5123
US 3 month interest rates = 2.5% – 3.2% pa
£ 3 month interest rates = 1.6% – 4.2% pa
Show how exchange rate risk can be managed using money market hedging
241.
MONEY MARKET HEDGING
TECHNIQUES9
UK importer must pay US$10m in three mths. Spot rate £/US$ = 1.5123. US $ 3
mth interest rates = 2.5% – 3.2% pa. £ 3 mth interest rates = 1.6% – 4.2% pa
1. To have US$ 10 million in three months, the company has to deposit $X at
2.5%
now (lower rate paid by bank) where:
X (1 + (0.025/4)) = 10,000,000
X = 10,000,000/ (1 + (0.025/4)) = $9,937,888
242.
MONEY MARKET HEDGING
TECHNIQUES10
UK importer must pay US$10m in three months. Spot rate £/US$ = 1.5123. US $
3 mth interest rates = 2.5% – 3.2% pa. £ 3 mth interest rates = 1.6% – 4.2% pa
2. $9,937,888 can be obtained now at the spot rate of £/US$ 1.5123. So the
current, certain £ cost is:
$9,937,888/1.5123 = £6,571,373
3. In three months the $ deposit will have grown to $10m and will be used to
pay the supplier.
Of course, the company has had to find £6,571,373 now, three months earlier
than the supplier needs to be paid.
The true cost of the transaction should take into account the cost of borrowing
this amount for three months
£6,571,373 × (1 + (0.042/4)) = £6,640,372
243.
MONEY MARKET HEDGING
TECHNIQUES11
TGA Co, a US company, expects to receive €500,000 from export sales at the end
of three months. A forward rate of €1.687 per $1 has been offered by the
company's bank and the spot rate is €1.675 per $1. TGA Co can borrow short term
in the euro at 9% per year and deposit in the US at 4% per year.
Required:
Calculate the dollar income from a forward market hedge and a money
market hedge, and indicate which hedge would be financially preferred by
TGA Co.
244.
RISK MANAGEMENT 2
Strategicrisks - is the potential volatility of profits caused by the nature and type
of
business strategies
Operational/ process risks - is the risk of loss from a failure of internal business
and control processes
Other types of risks – market risk, liquidity risks, financing risks, cash flow
risks, credit risks, political risk, fraud risks, etc.
Assessing financial risks through sensitivity analysis, expected values,
certainty
equivalent approach, simulation models, scenarios, etc.
245.
FOREIGN EXCHANGE RISK1
Test your understanding. Can you answer the following?
What are spot rates and forward rates?
What is bid price and offer price?
What is spread?
What internal hedging techniques are available for an organisation in dealing
with foreign exchange risk?
246.
FOREIGN EXCHANGE RISK2
Internal hedging techniques
Leading and lagging
Invoicing in home currency
Matching receipts and payments
Multilateral netting
Other hedging techniques
Forward contracts
Money market hedging
![[CORPORATE FINANCE AND RISK MANAGEMENT]
Mohamed Intikab Bin Ali
December 2015 Session](https://image.slidesharecdn.com/castrategicfinanceintro-260103084442-4cea6436/85/CA-strategic-finance-intro-pptx-bbbbbbbbb-1-320.jpg)


![[CHAPTER 1: STRATEGIC ROLE AND INTEGRATION OF FINANCIAL MANAGEMENT]
Syllabus areas
Objectives of companies
Stakeholders and objectives
Objectives of publicly owned and non-commercial bodies
Financial management decisions
Strategic Role and Integration of Financial Management](https://image.slidesharecdn.com/castrategicfinanceintro-260103084442-4cea6436/85/CA-strategic-finance-intro-pptx-bbbbbbbbb-4-320.jpg)
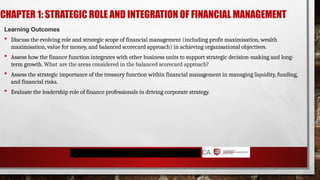
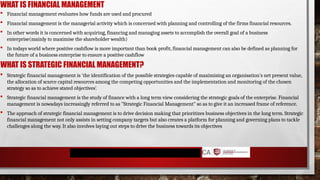
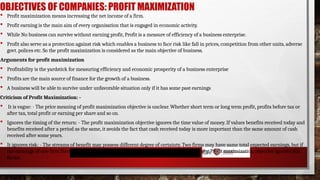
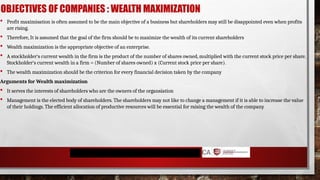
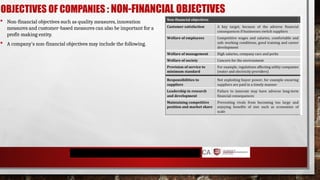
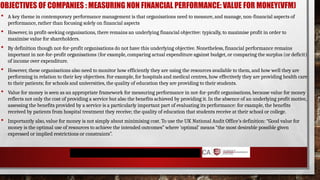


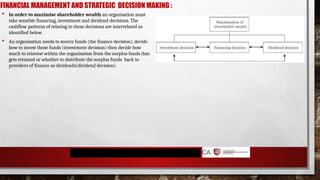

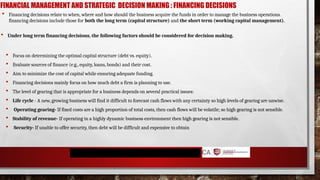
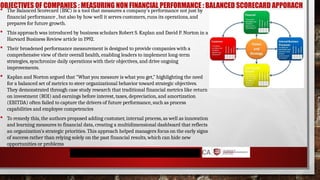
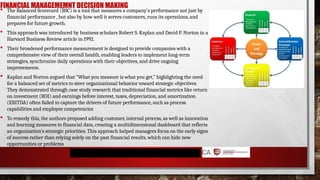
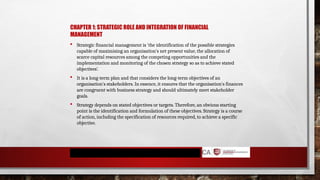

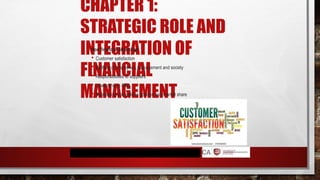
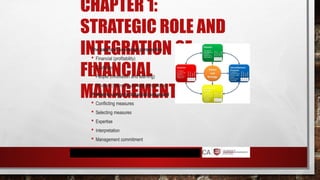


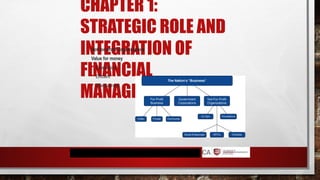
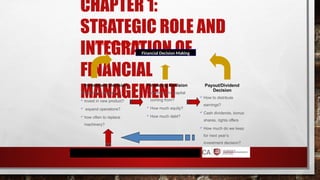
![[CHAPTER 2: FINANCIAL STRATEGY]
Syllabus areas
Constraint on financial strategy
Regulatory bodies
Economic constraints
International constraints
The treasury function
Mohamed Intikab Bin Ali](https://image.slidesharecdn.com/castrategicfinanceintro-260103084442-4cea6436/85/CA-strategic-finance-intro-pptx-bbbbbbbbb-26-320.jpg)

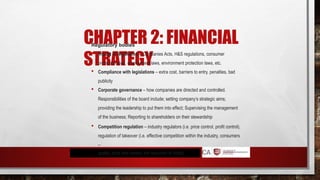


![[CHAPTER 3: FORECASTING & ANALYSIS]
Syllabus areas
Performance analysis
Cash forecasts
Forecasting financial statements – detailed example
Sensitivity analysis and changes in variations
Financing requirements
Mohamed Intikab Bin Ali](https://image.slidesharecdn.com/castrategicfinanceintro-260103084442-4cea6436/85/CA-strategic-finance-intro-pptx-bbbbbbbbb-37-320.jpg)


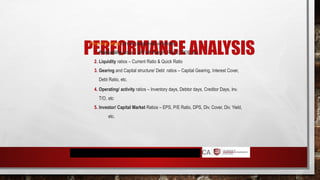
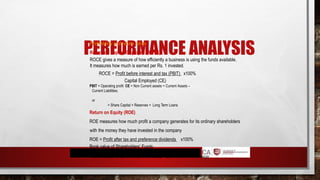


![[CHAPTER 4: SHORT-TERM FINANCIAL STRATEGY]
Syllabus areas
Short-term financial strategy
Working capital management
Cash operating cycle
Managing inventories
Managing account receivables
Mohamed Intikab Bin Ali
Managing accounts payables
Working capital financing
Other factors to consider](https://image.slidesharecdn.com/castrategicfinanceintro-260103084442-4cea6436/85/CA-strategic-finance-intro-pptx-bbbbbbbbb-48-320.jpg)


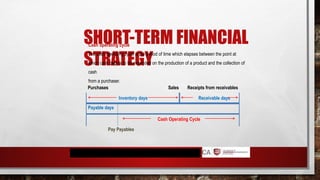


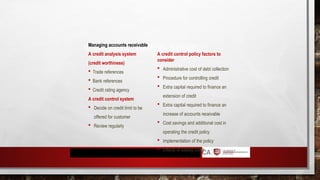


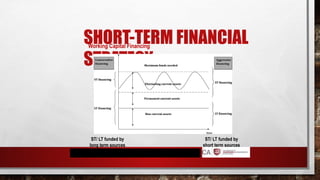
![[CHAPTER 5: EQUITY FINANCE]
Syllabus areas
Capital markets
Methods of obtaining a listing
Rights issues
Scrip dividends, bonus issues and share splits
Mohamed Intikab Bin Ali](https://image.slidesharecdn.com/castrategicfinanceintro-260103084442-4cea6436/85/CA-strategic-finance-intro-pptx-bbbbbbbbb-64-320.jpg)


![[CHAPTER 6: DEBT FINANCE]
Syllabus areas
Medium-term finance
Long-term debt
Convertible securities
Warrants
International debt finance
Small and medium sized entities
Mohamed Intikab Bin Ali](https://image.slidesharecdn.com/castrategicfinanceintro-260103084442-4cea6436/85/CA-strategic-finance-intro-pptx-bbbbbbbbb-75-320.jpg)
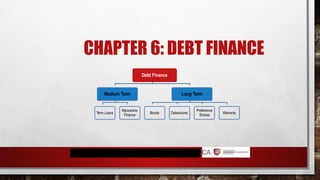


![[CHAPTER 7: LEASE FINANCE]
Syllabus areas
Leasing as a source of finance
Lease or buy decisions
Mohamed Intikab Bin Ali](https://image.slidesharecdn.com/castrategicfinanceintro-260103084442-4cea6436/85/CA-strategic-finance-intro-pptx-bbbbbbbbb-94-320.jpg)


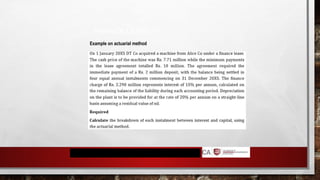
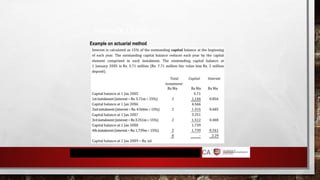
![FINANCE LEASE
Sum of digits method – splits the total interest without reference to a rate
of interest in such a way that the greater proportion falls in the earlier years.
The steps are as follows.
1. Assign the digits to each installment,
2. Add the digits [i.e. n(n+1)/2], and
3. Calculate the interest charge for each installment](https://image.slidesharecdn.com/castrategicfinanceintro-260103084442-4cea6436/85/CA-strategic-finance-intro-pptx-bbbbbbbbb-101-320.jpg)


![[CHAPTER 8: THE COST OF CAPITAL]
Syllabus areas
Investment decisions, financing and the cost of
capital
The dividend valuation model
The capital assets pricing model
The cost of debt
The weighted average cost of capital
Mohamed Intikab Bin Ali](https://image.slidesharecdn.com/castrategicfinanceintro-260103084442-4cea6436/85/CA-strategic-finance-intro-pptx-bbbbbbbbb-111-320.jpg)
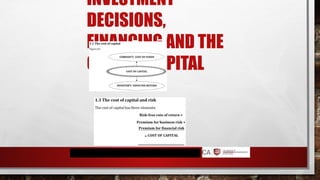


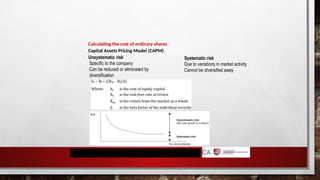


![THE WEIGHTED AVERAGE
COST OF CAPITAL
Calculating the Weighted Average Cost of Capital (WACC)
Where:
Ke is cost of equity
Ve is market value of equity
Kd is cost of debt
Vd is market value of debt
[Use market values rather
than book
values unless market values unavailable
(unquoted company)]
Assumptions for WACC
Project small relative to company and has same
business risk as company
WACC reflects company’s long-term future capital
structure and costs
New investments financed by new funds
Cost of capital reflects marginal cost](https://image.slidesharecdn.com/castrategicfinanceintro-260103084442-4cea6436/85/CA-strategic-finance-intro-pptx-bbbbbbbbb-119-320.jpg)

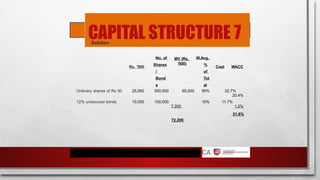
![[CHAPTER 9: CAPITAL STRUCTURE]
Syllabus areas
The capital structure decisions
The effects of capital structure on ratios
Theories of capital structure
Project specific capital structure
Mohamed Intikab Bin Ali](https://image.slidesharecdn.com/castrategicfinanceintro-260103084442-4cea6436/85/CA-strategic-finance-intro-pptx-bbbbbbbbb-122-320.jpg)
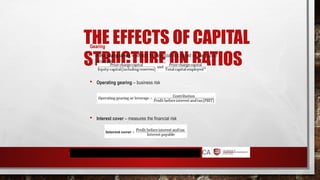

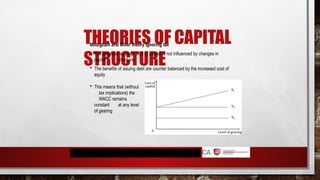
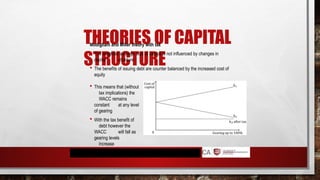
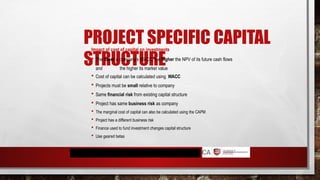


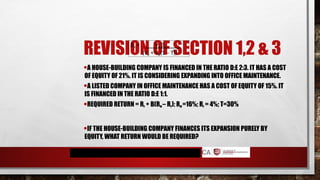
![[CHAPTER 10: DIVIDEND POLICY]
Syllabus areas
Dividend policy – practical issues
Dividend policy - theories
Mohamed Intikab Bin Ali](https://image.slidesharecdn.com/castrategicfinanceintro-260103084442-4cea6436/85/CA-strategic-finance-intro-pptx-bbbbbbbbb-139-320.jpg)

![[CHAPTER 11: MARKET EFFICIENCY]
Syllabus areas
Share prices and investment returns
The efficient market hypothesis
Mohamed Intikab Bin Ali](https://image.slidesharecdn.com/castrategicfinanceintro-260103084442-4cea6436/85/CA-strategic-finance-intro-pptx-bbbbbbbbb-143-320.jpg)


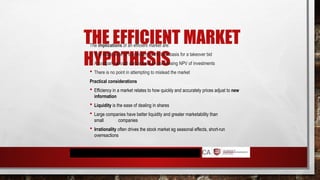
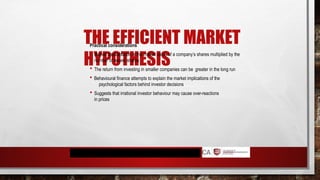
![[CHAPTER 12: INVESTMENT APPRAISAL
TECHNIQUES]
Syllabus areas
Investments and projects
Capital investment appraisal
Risk and uncertainty
Investment performance and post-completion audit
Mohamed Intikab Bin Ali](https://image.slidesharecdn.com/castrategicfinanceintro-260103084442-4cea6436/85/CA-strategic-finance-intro-pptx-bbbbbbbbb-149-320.jpg)


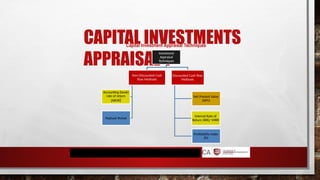
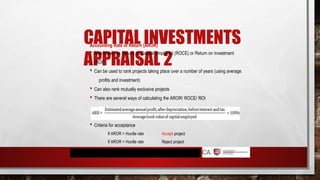
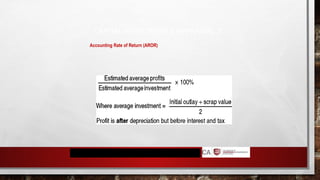


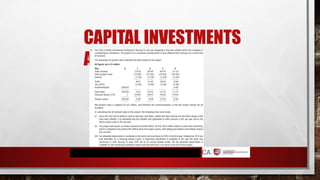


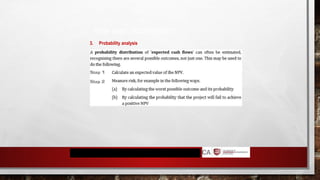


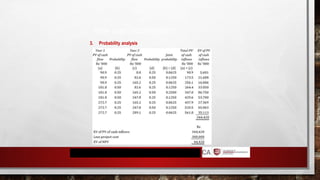
![[CHAPTER 13: INTERNATIONAL INVESTMENT
APPRAISAL ]
Syllabus areas
International Investments
International Investment Appraisal
Mohamed Intikab Bin Ali](https://image.slidesharecdn.com/castrategicfinanceintro-260103084442-4cea6436/85/CA-strategic-finance-intro-pptx-bbbbbbbbb-175-320.jpg)


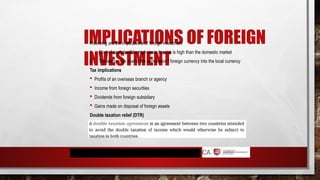


![[CHAPTER 15: BUSINESS VALUATION ]
Syllabus areas
Reasons for valuation and valuation issues
Assets valuation bases
Earnings valuation bases
Dividend valuation bases
Cash flow valuation bases
Intangible assests and intellectual capital
Mohamed Intikab Bin Ali](https://image.slidesharecdn.com/castrategicfinanceintro-260103084442-4cea6436/85/CA-strategic-finance-intro-pptx-bbbbbbbbb-187-320.jpg)

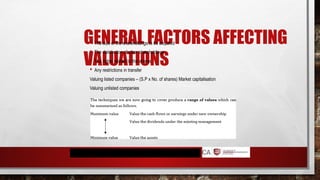


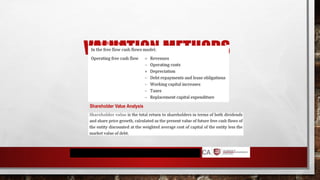
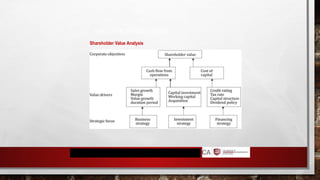
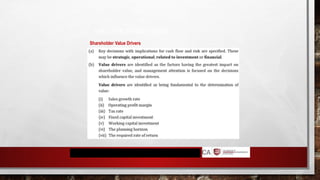
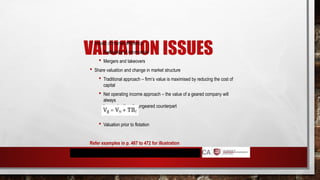


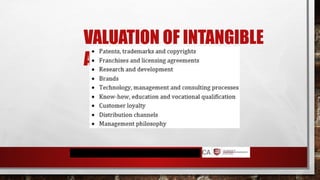


![[CHAPTER 16: AMALGAMATIONS AND
RESTRUCTURING]
Syllabus areas
Mergers and acquisitions
The conduct of a takeover
Payment methods
Valuation of mergers and acquisitions
Regulation of takeovers and Post-acquisition integration
Impact of mergers and takeovers on stakeholders
Exit strategies
Mohamed Intikab Bin Ali](https://image.slidesharecdn.com/castrategicfinanceintro-260103084442-4cea6436/85/CA-strategic-finance-intro-pptx-bbbbbbbbb-204-320.jpg)


![[CHAPTER 17: CORPORATE FAILURE AND
RECONSTRUCTION]
Mohamed Intikab Bin Ali
Syllabus areas
Predicting business failure
Assessment of corporate failure
prediction models
Performance improvement
strategies and corporate failure
Organisational survival and life
cycle issues
Implementing performance improvement
strategies
Implementing performance improvement
strategies
Reconstruction schemes
Financial reconstructions
Leverage buyouts (LBO)
Market response to financial
reconstruction](https://image.slidesharecdn.com/castrategicfinanceintro-260103084442-4cea6436/85/CA-strategic-finance-intro-pptx-bbbbbbbbb-220-320.jpg)

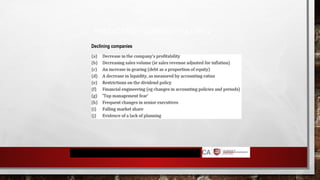

![[CHAPTER 19: MANAGING FOREIGN EXCHANGE
RISK]
Mohamed Intikab Bin Ali
Syllabus areas
Translation, transaction and economic risk
Exchange rates
Internal hedging techniques
Forward contracts
Money market hedging
Choosing a hedging method
Currency futures, options and swaps
Devising a foreign currency hedging strategy](https://image.slidesharecdn.com/castrategicfinanceintro-260103084442-4cea6436/85/CA-strategic-finance-intro-pptx-bbbbbbbbb-224-320.jpg)


![MONEY MARKET HEDGING
TECHNIQUES 6
A German manufacturer will receive US $5m in three months. Spot rate for €/US$
= 0.7524; US 3 month rates = 2.5% – 3.2% pa € 3 month rates = 0.2% – 0.8% pa
2. Convert $4,960,317 at the spot rate of 0.7524 €/$ to obtain $4,960,317 ×
0.7524 = € 3,732,143 now [Note that this amount is received now so is
certain.]
3. The loan of $4,960,317 will grow to $5m in three months and the $5m receipt
from the US customer will pay this off precisely. Using a $ receipt to pay
$ will not involve exchange risk.
The € 3,732,143 received now can be spent now.
Alternatively, it can be invested for three months (to match the time of the receipt) at
the € rate to become: € 3,732,143 × (1 + (0.002/4)) = € 3,734,009](https://image.slidesharecdn.com/castrategicfinanceintro-260103084442-4cea6436/85/CA-strategic-finance-intro-pptx-bbbbbbbbb-238-320.jpg)