Download as PDF, PPTX

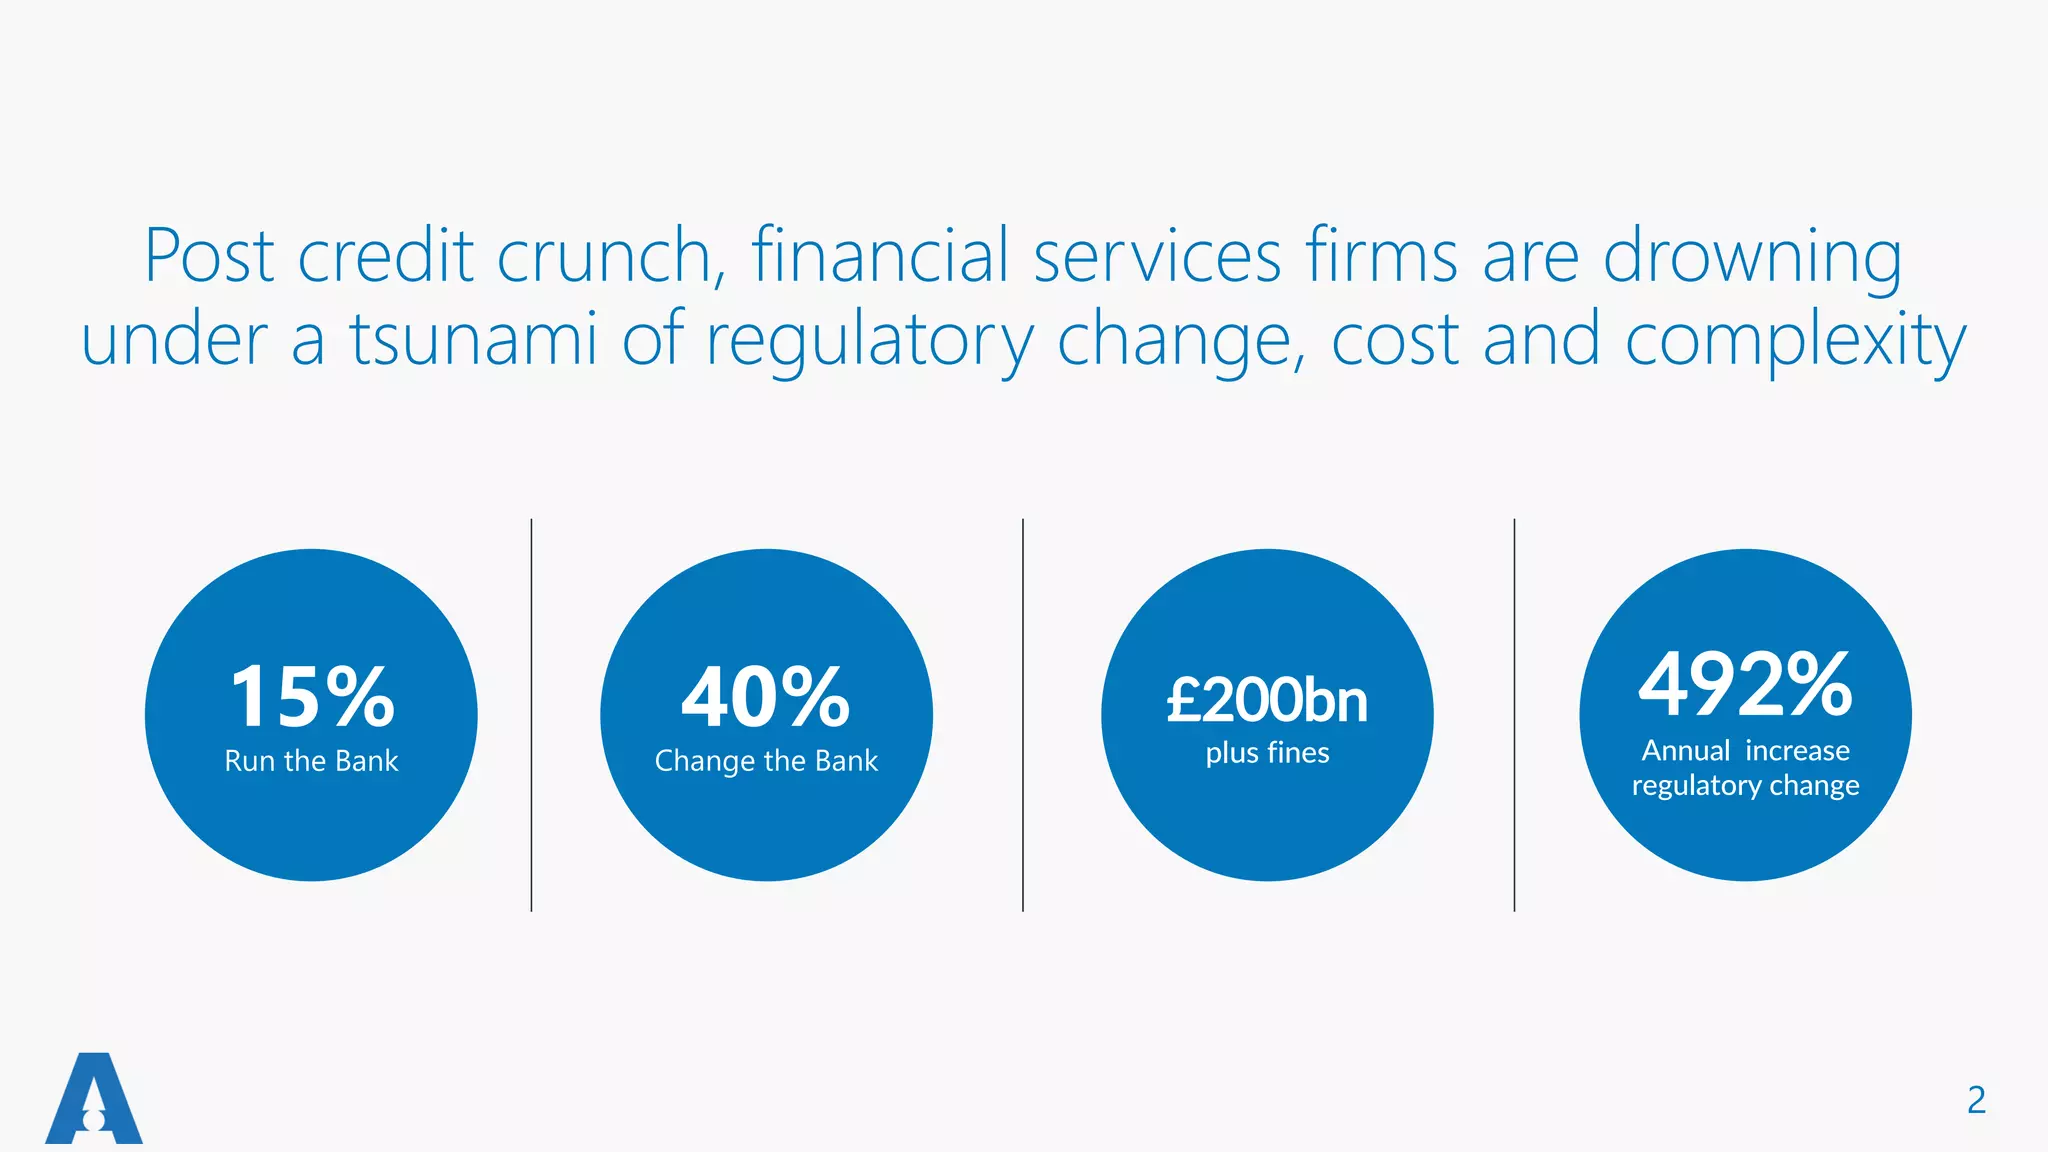
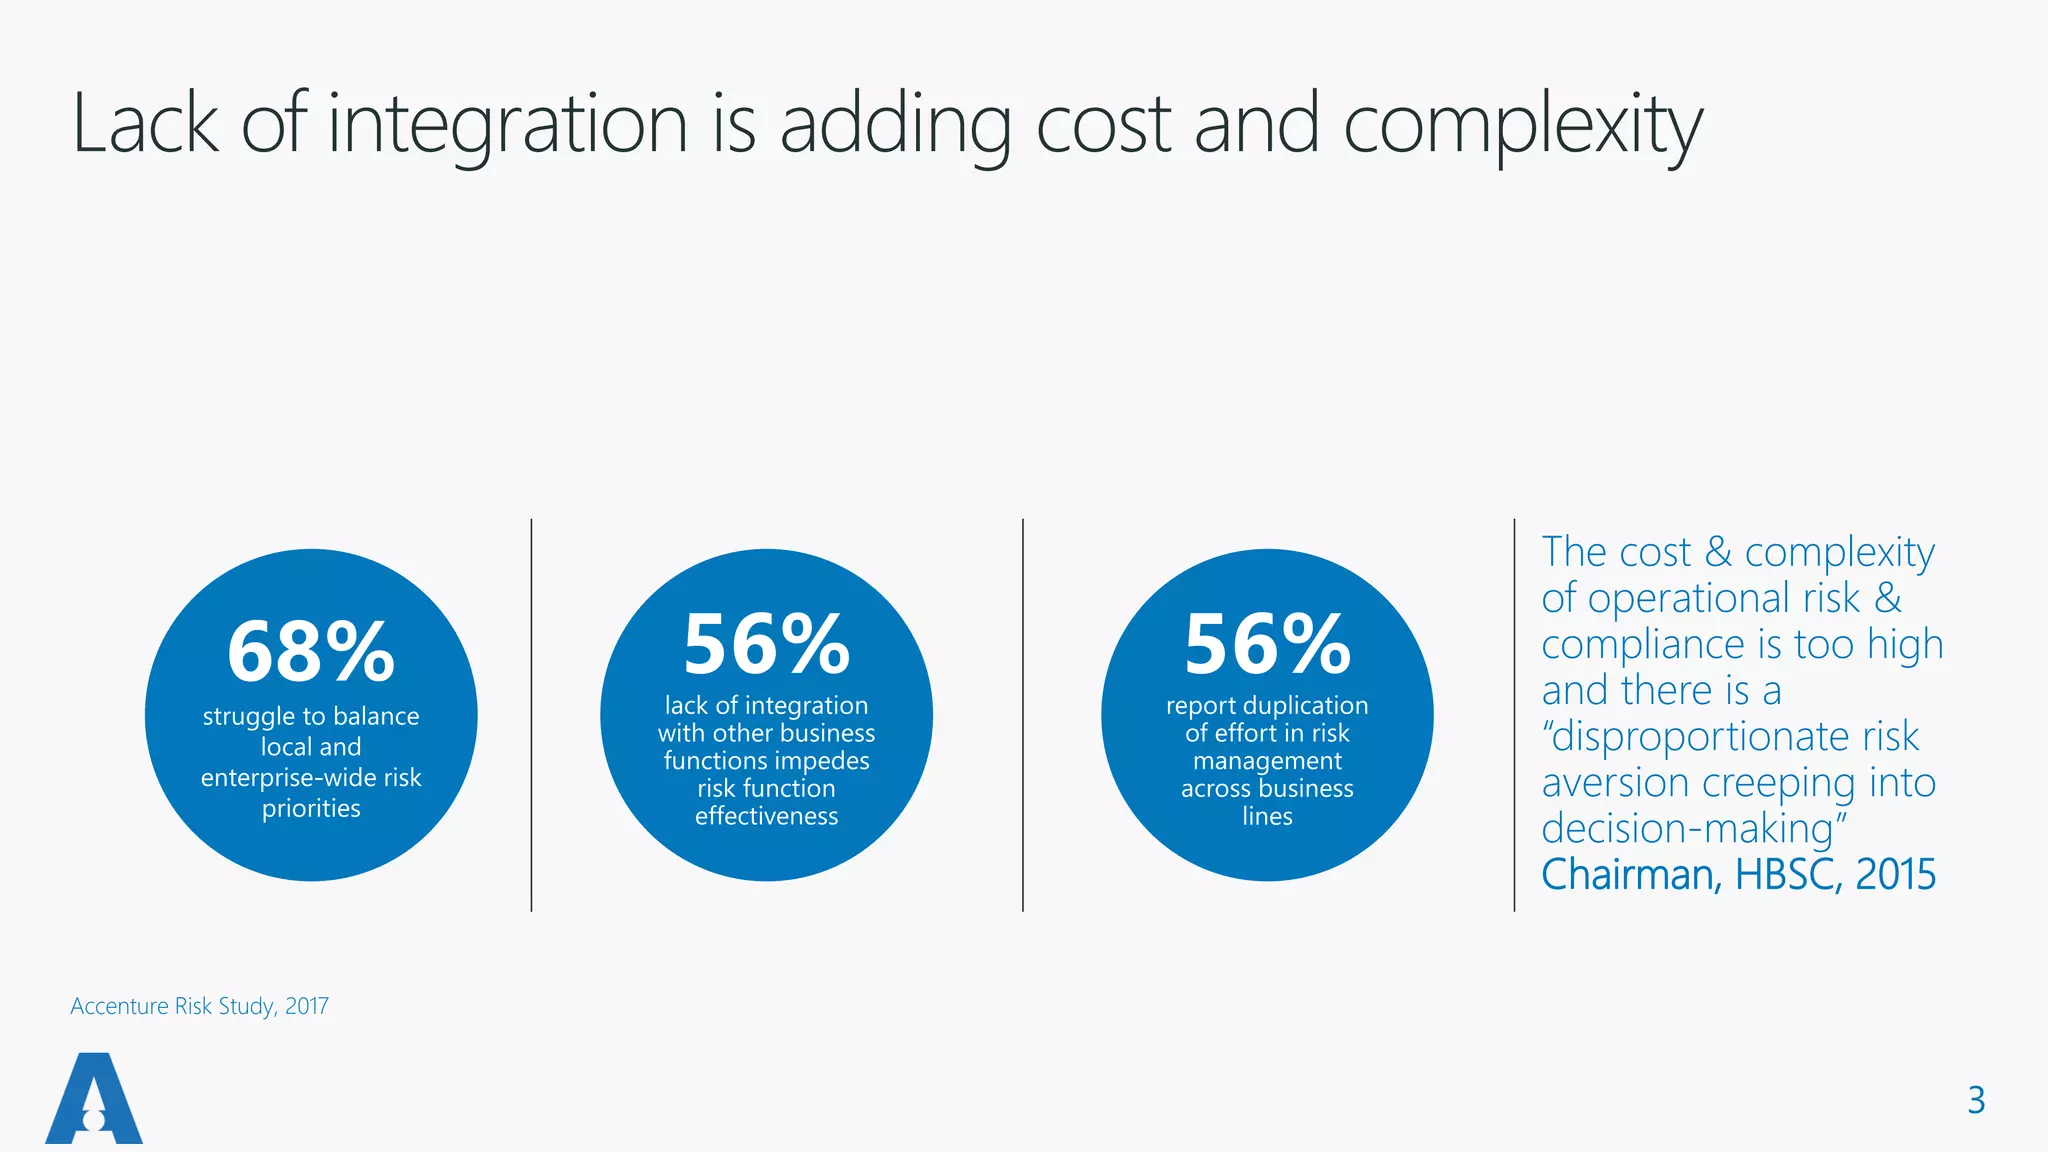

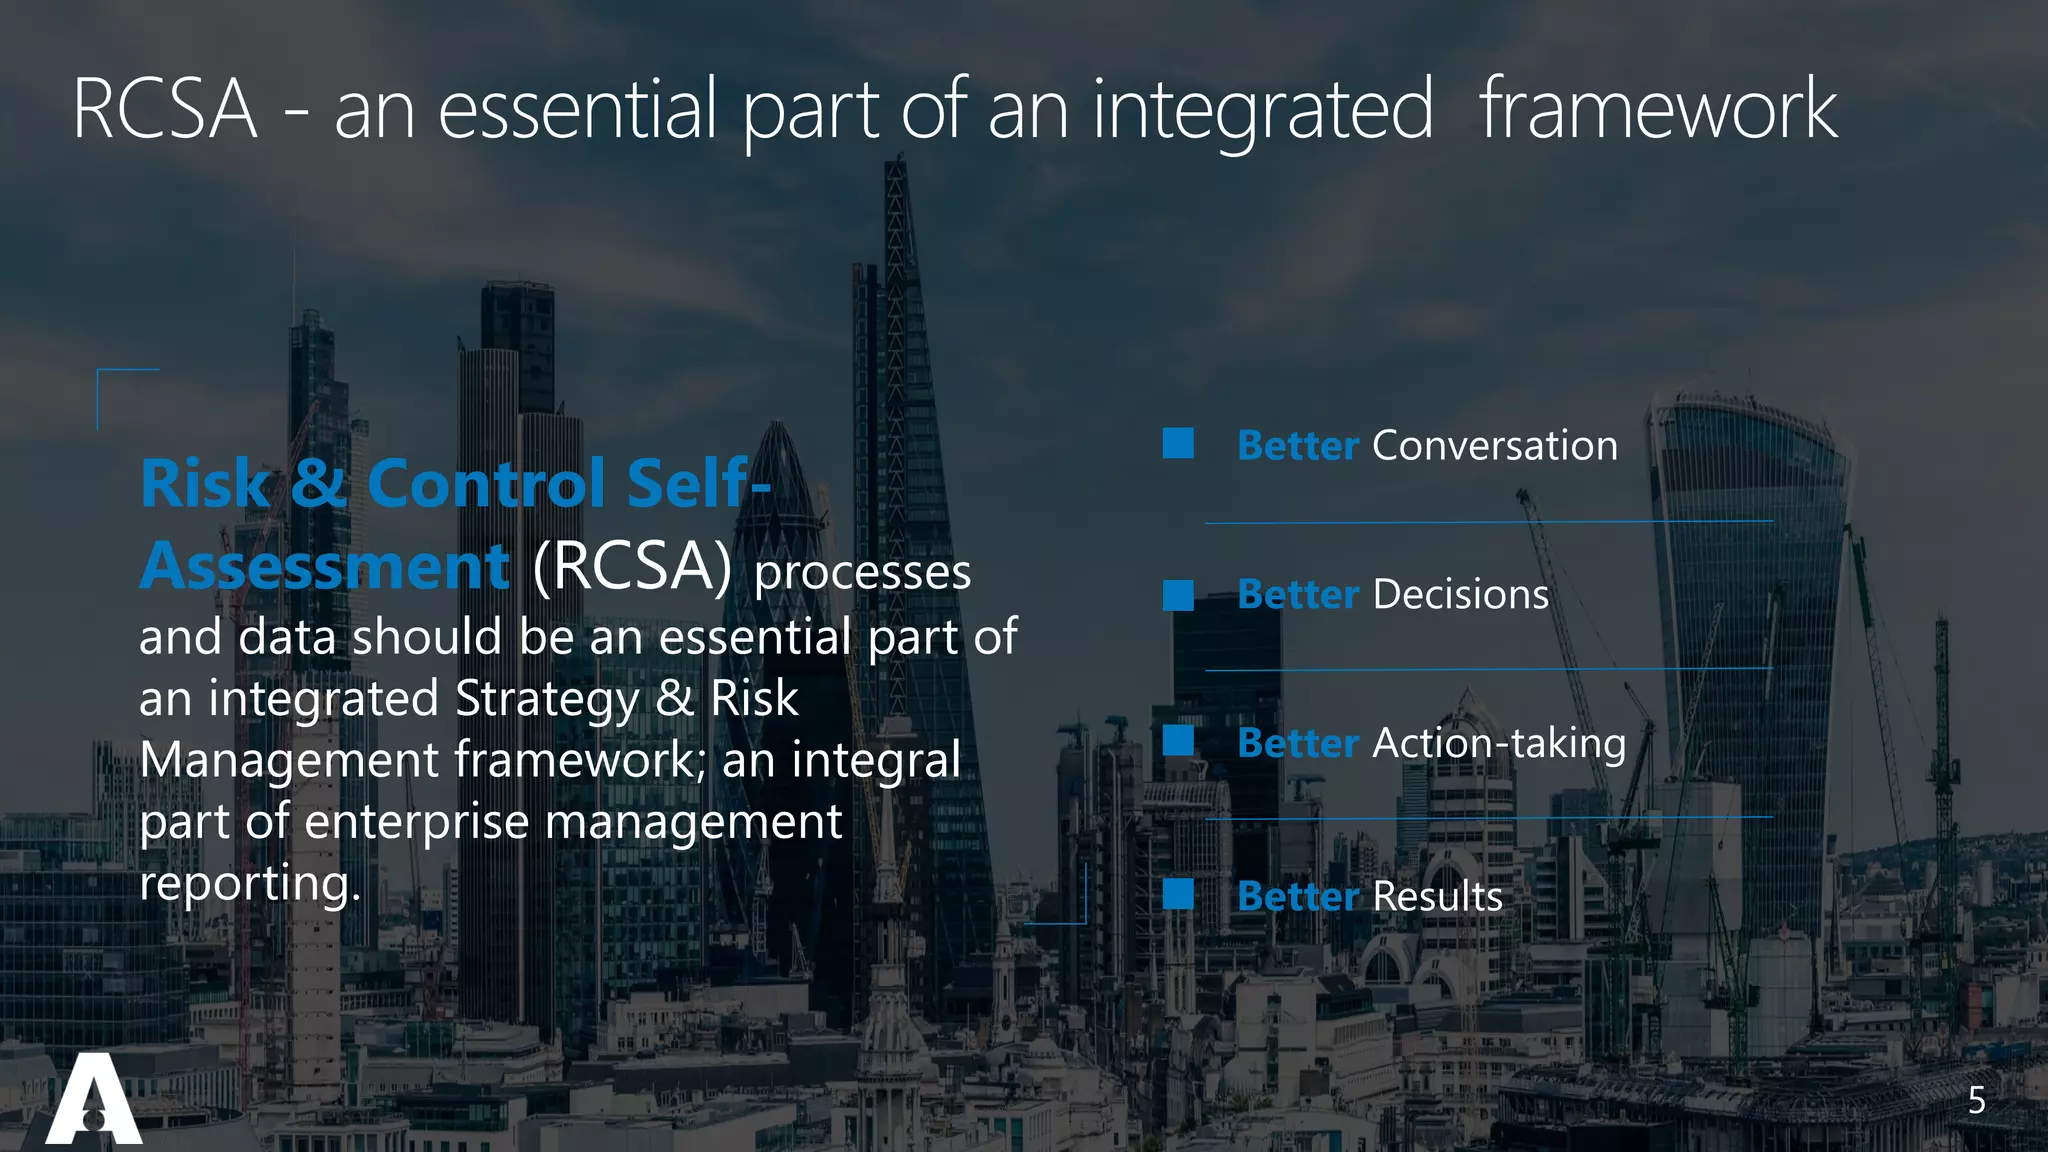

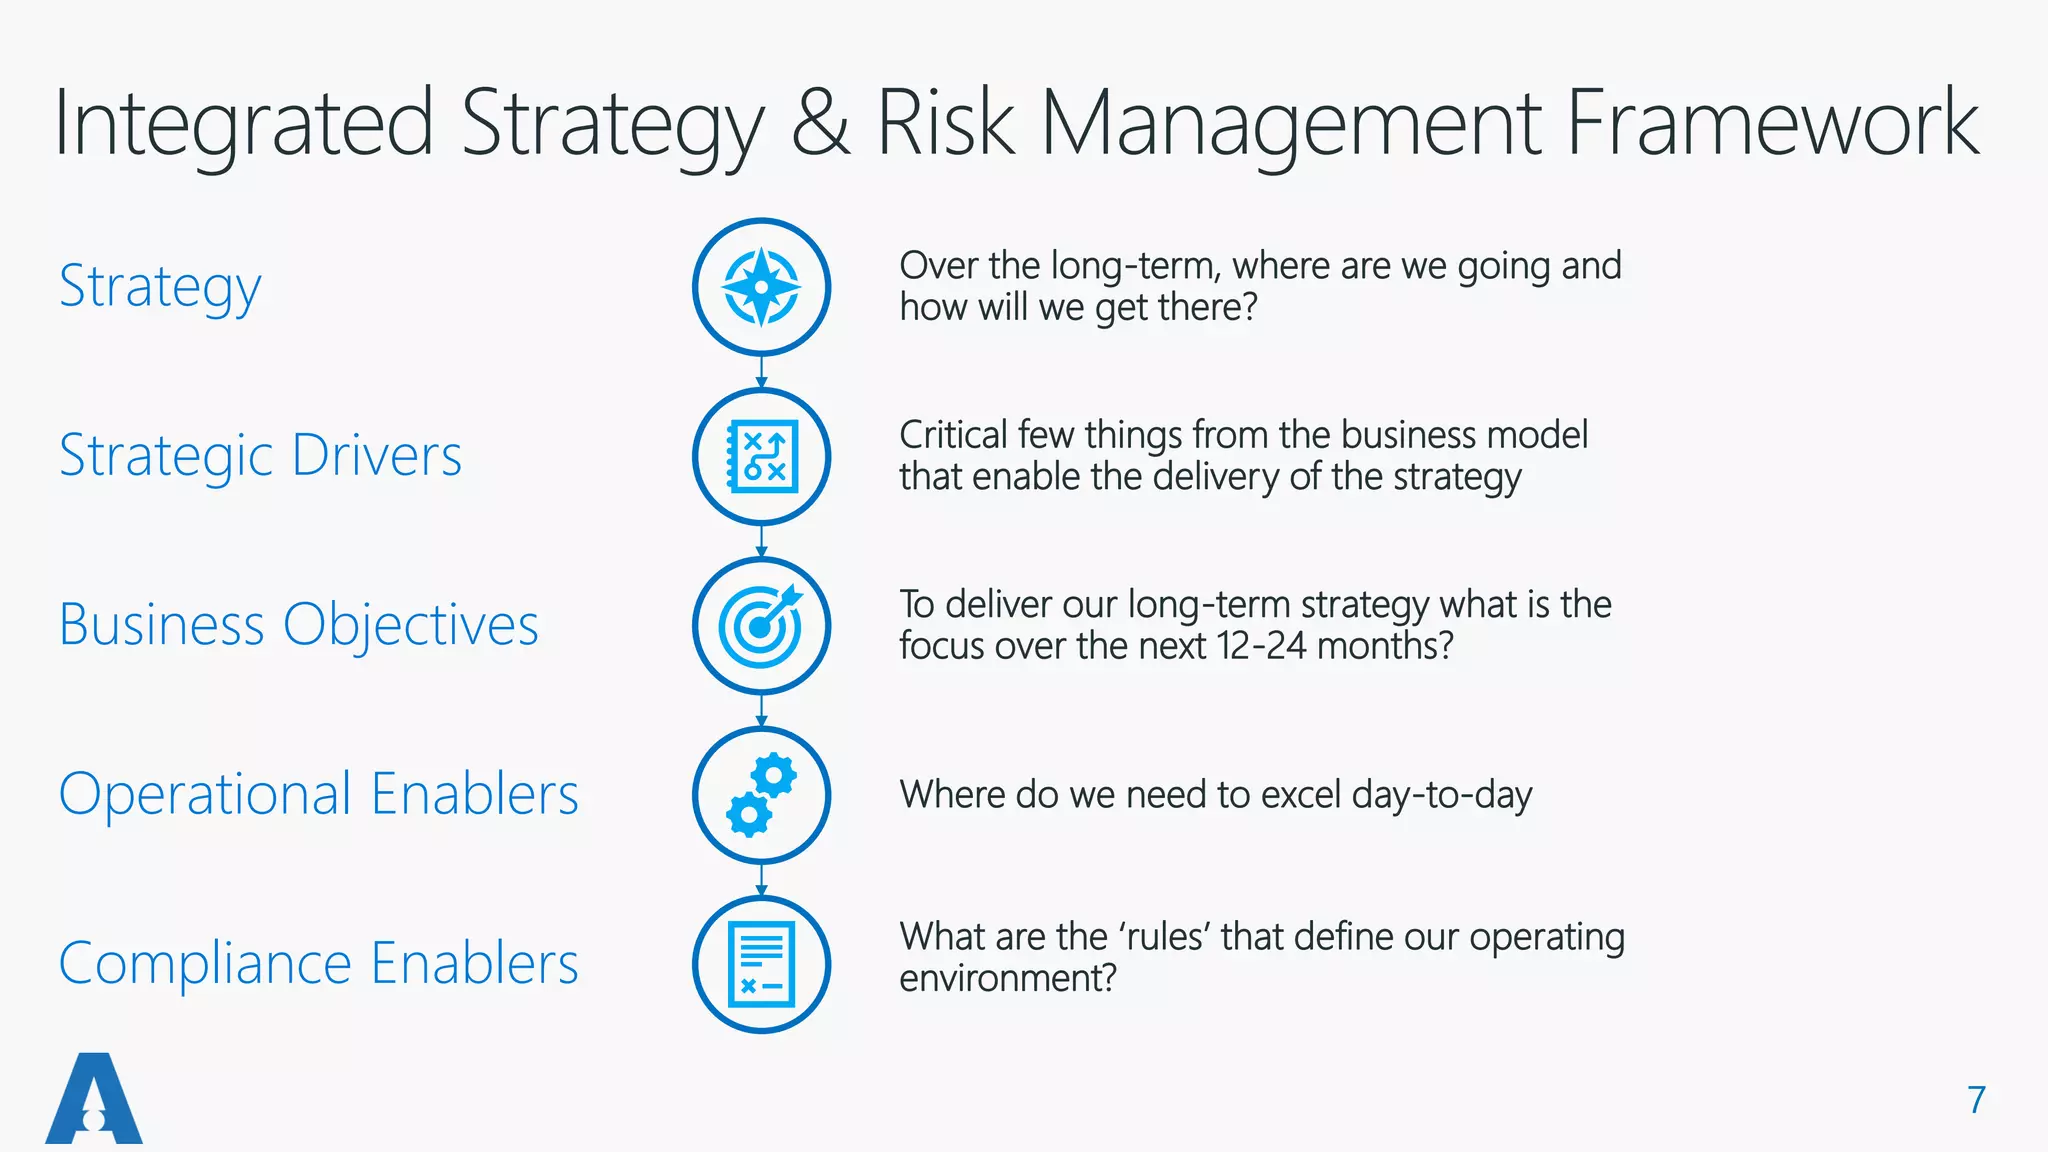
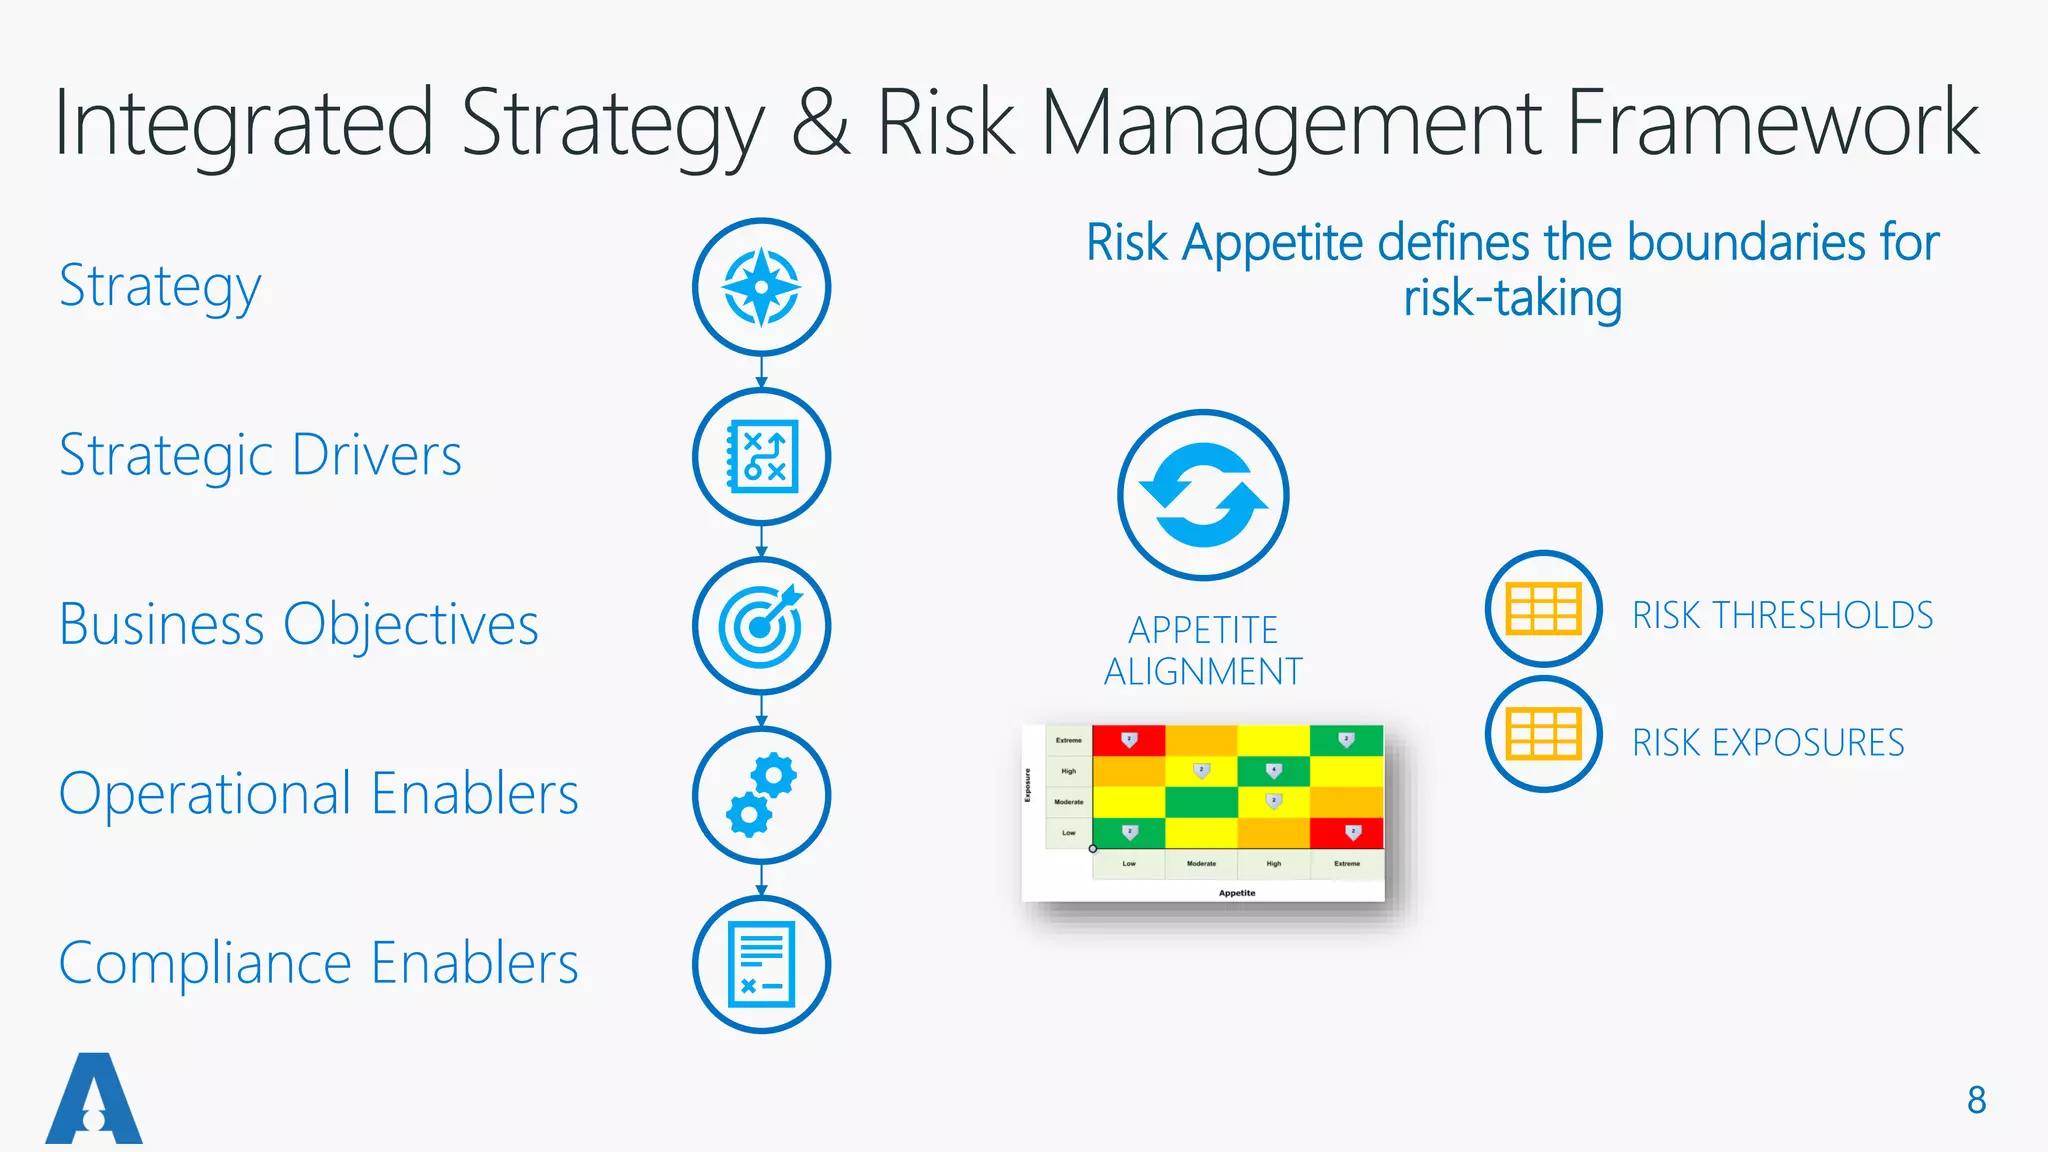

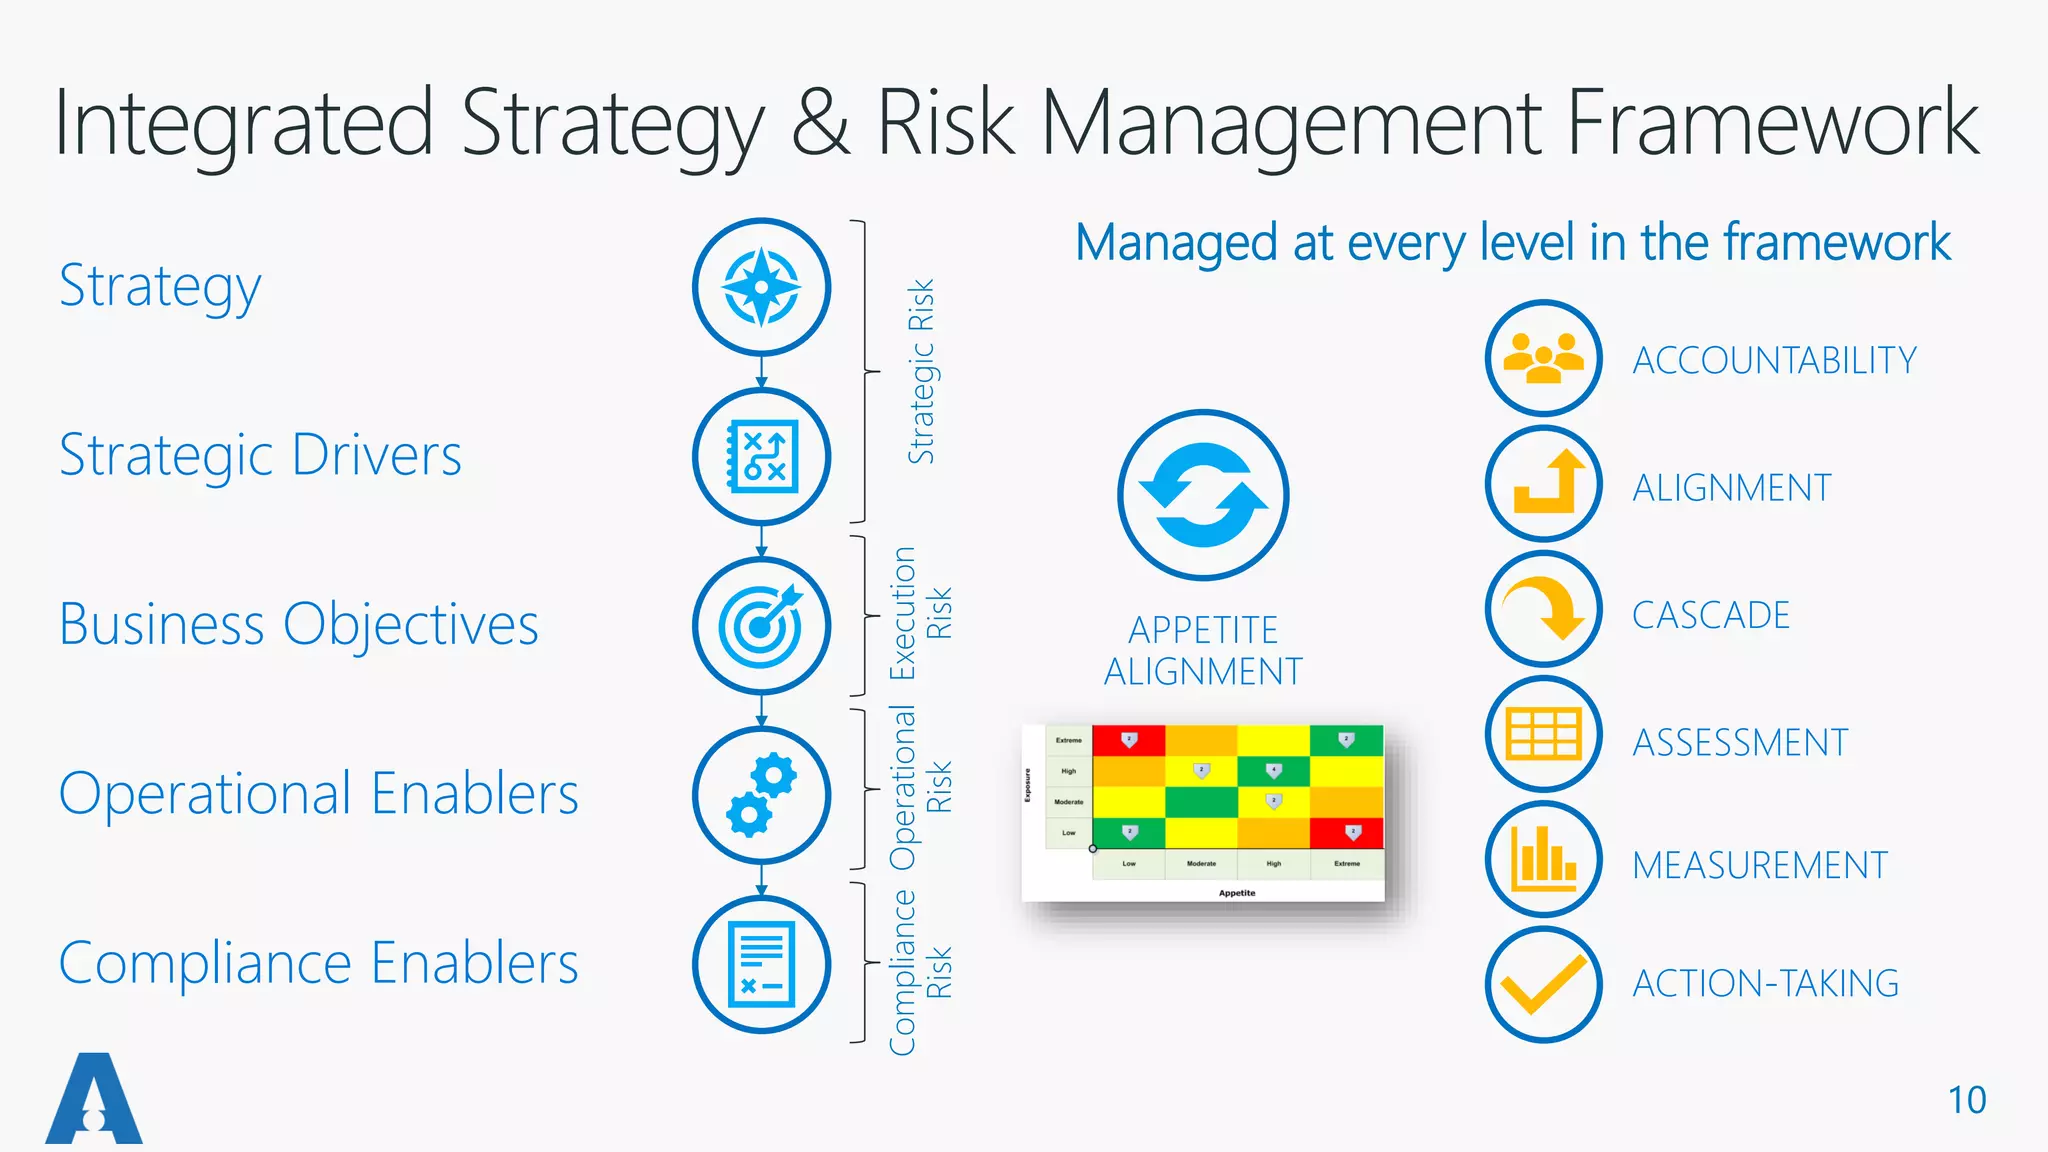
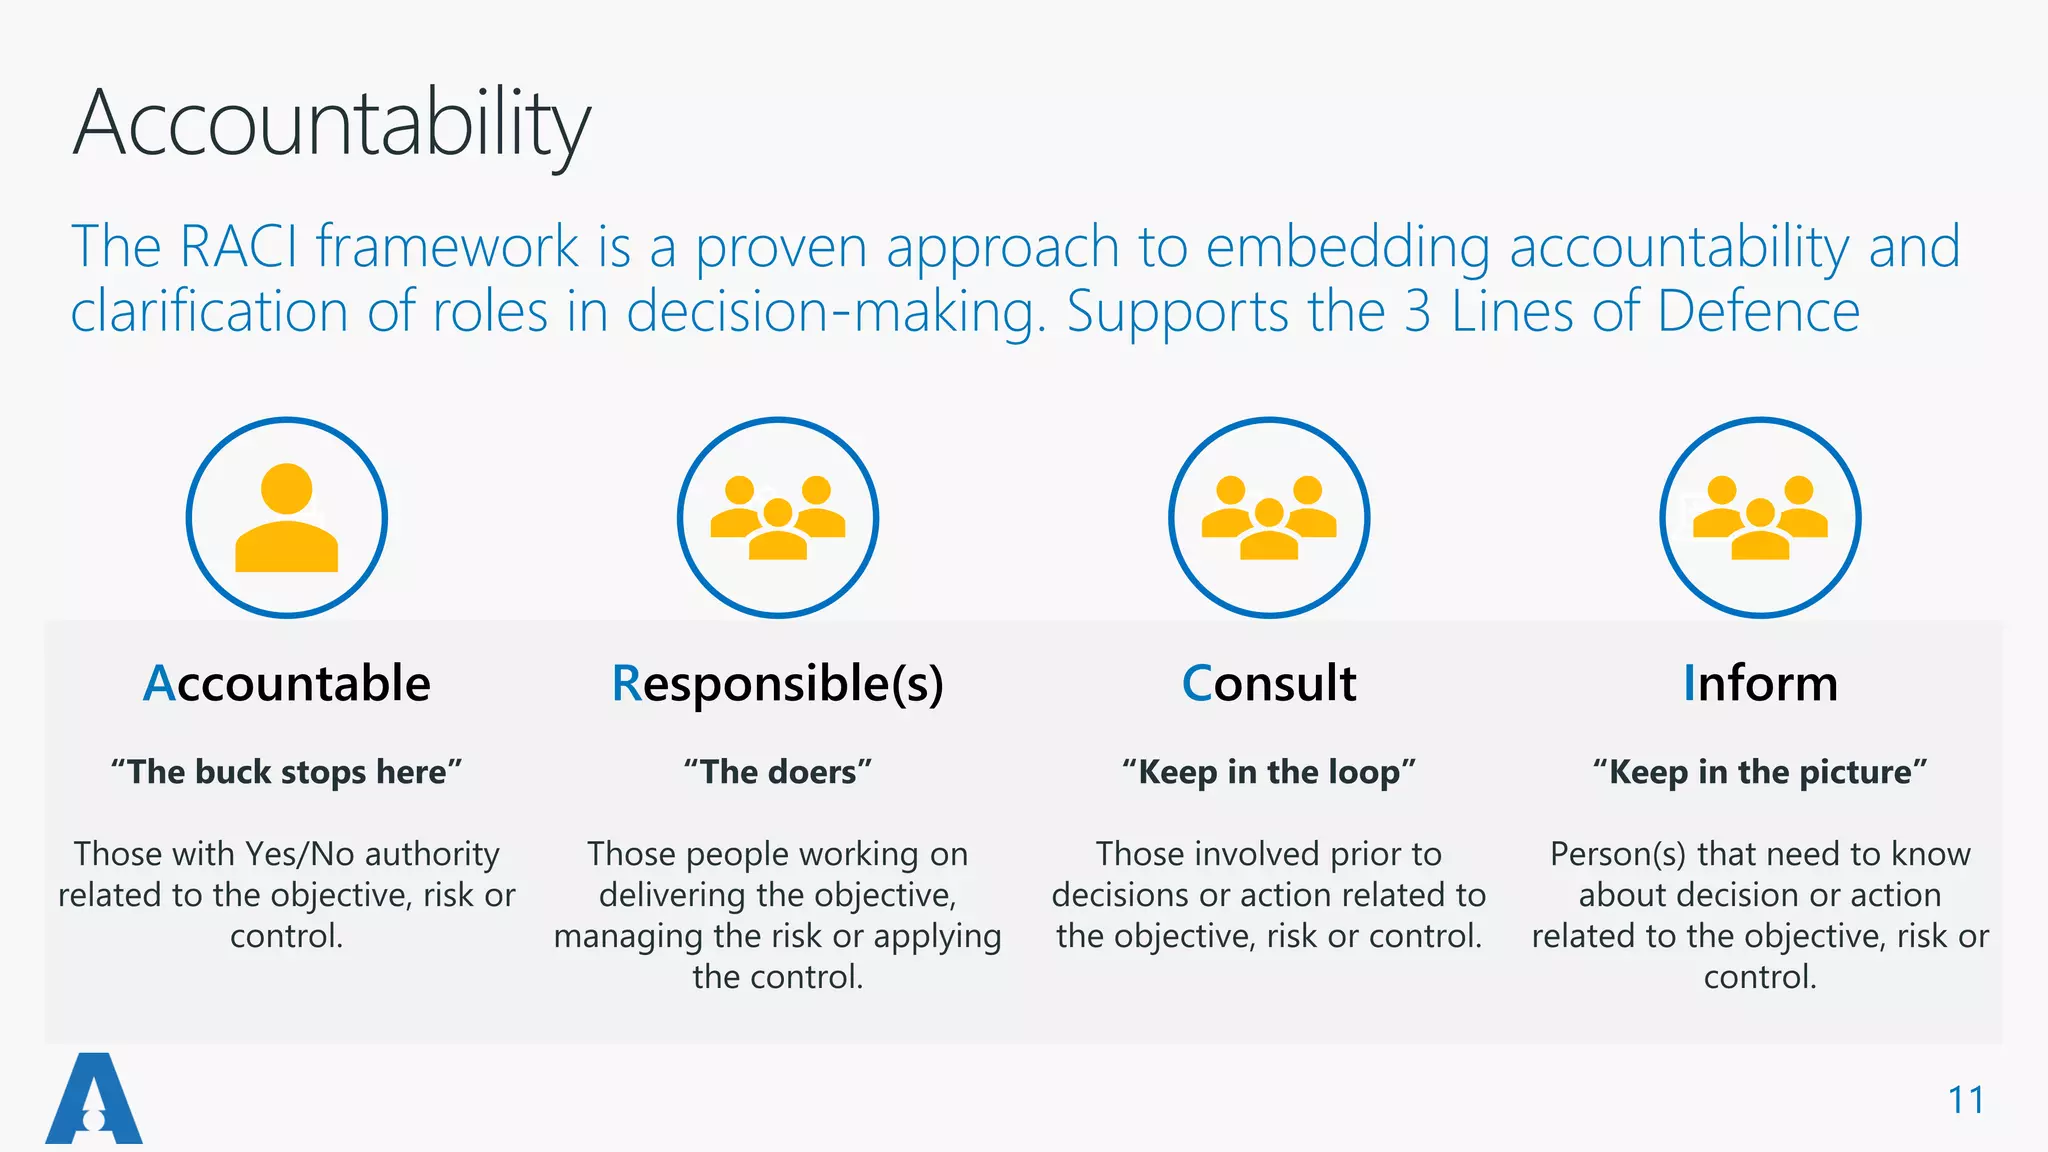
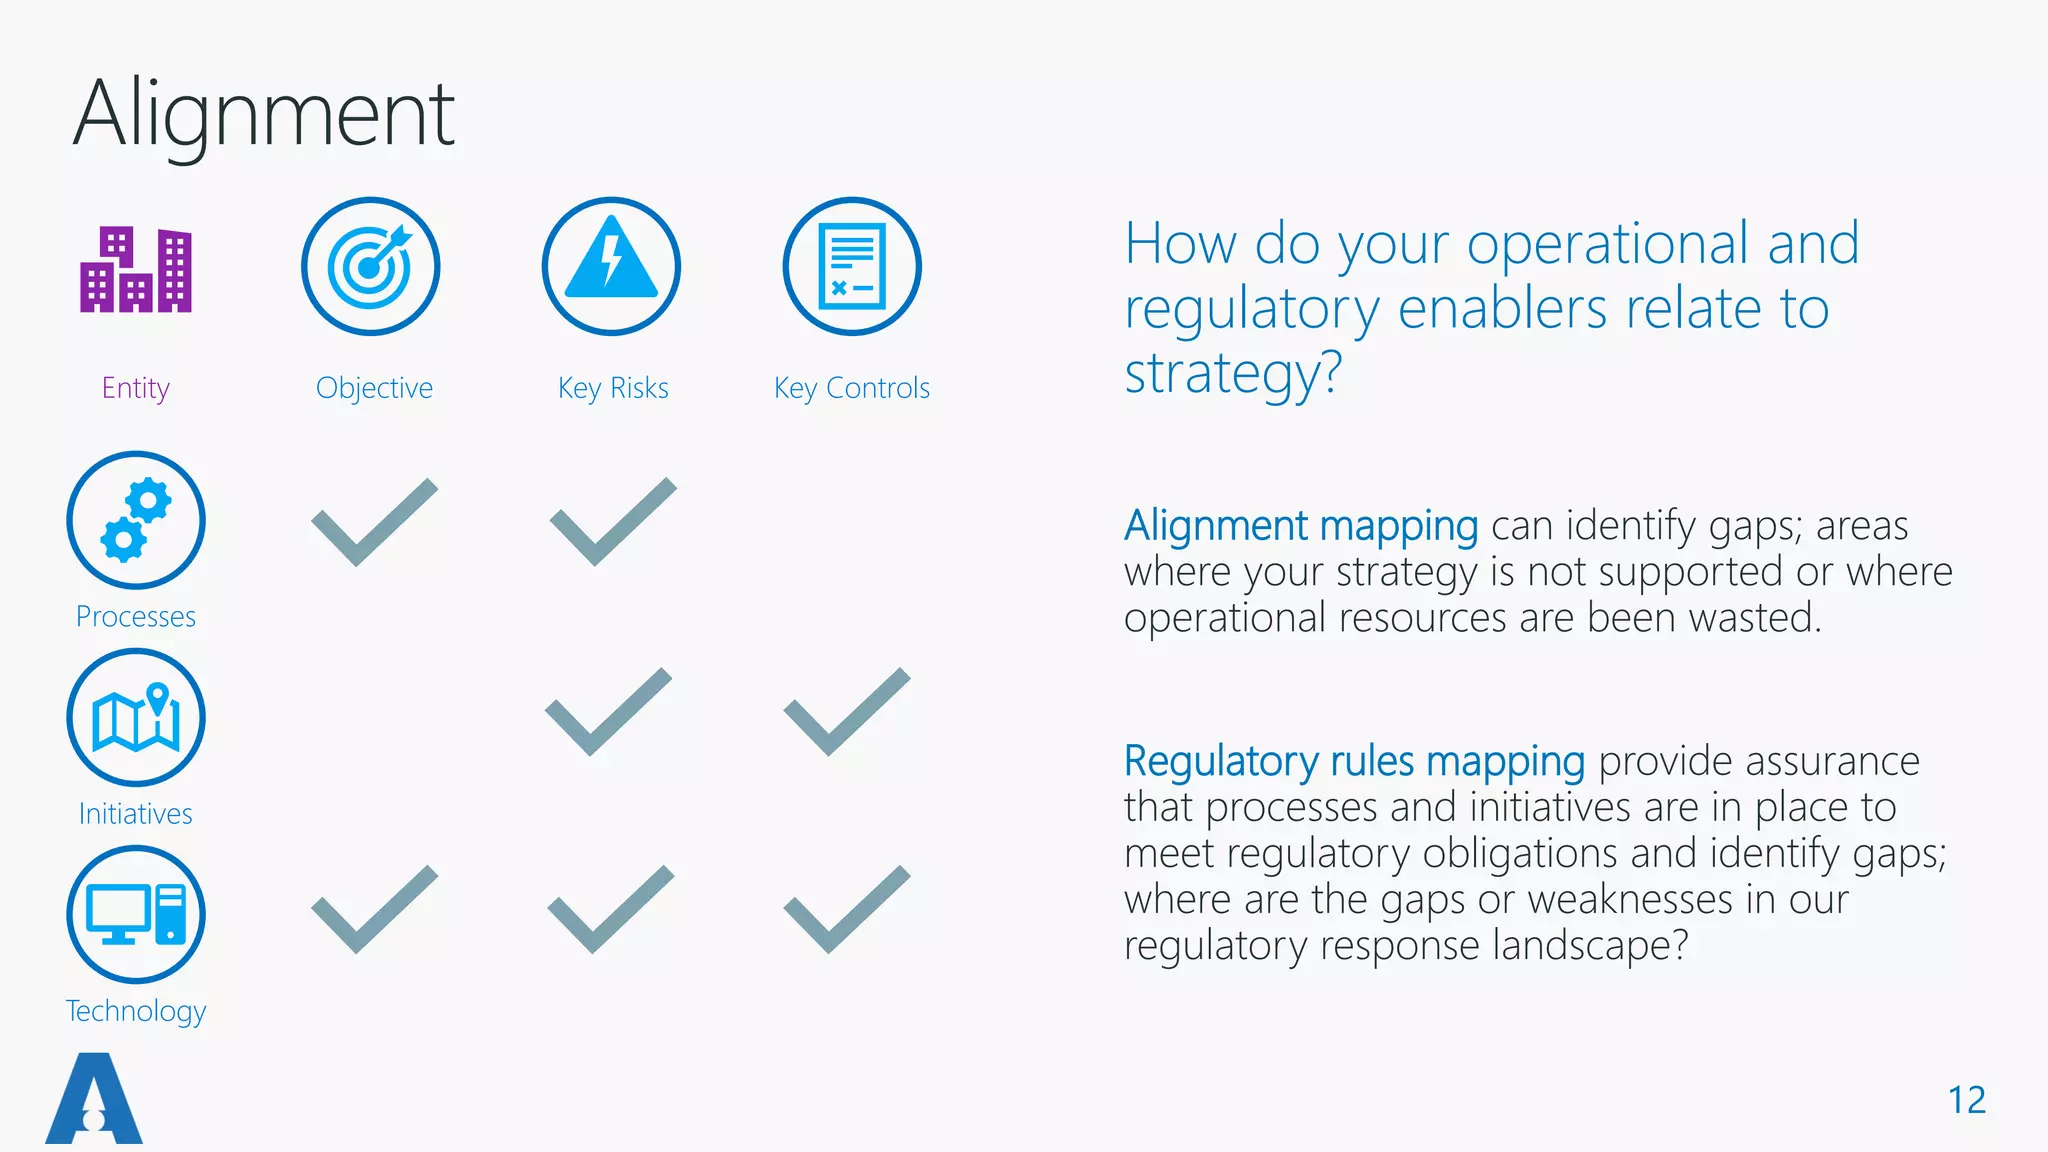


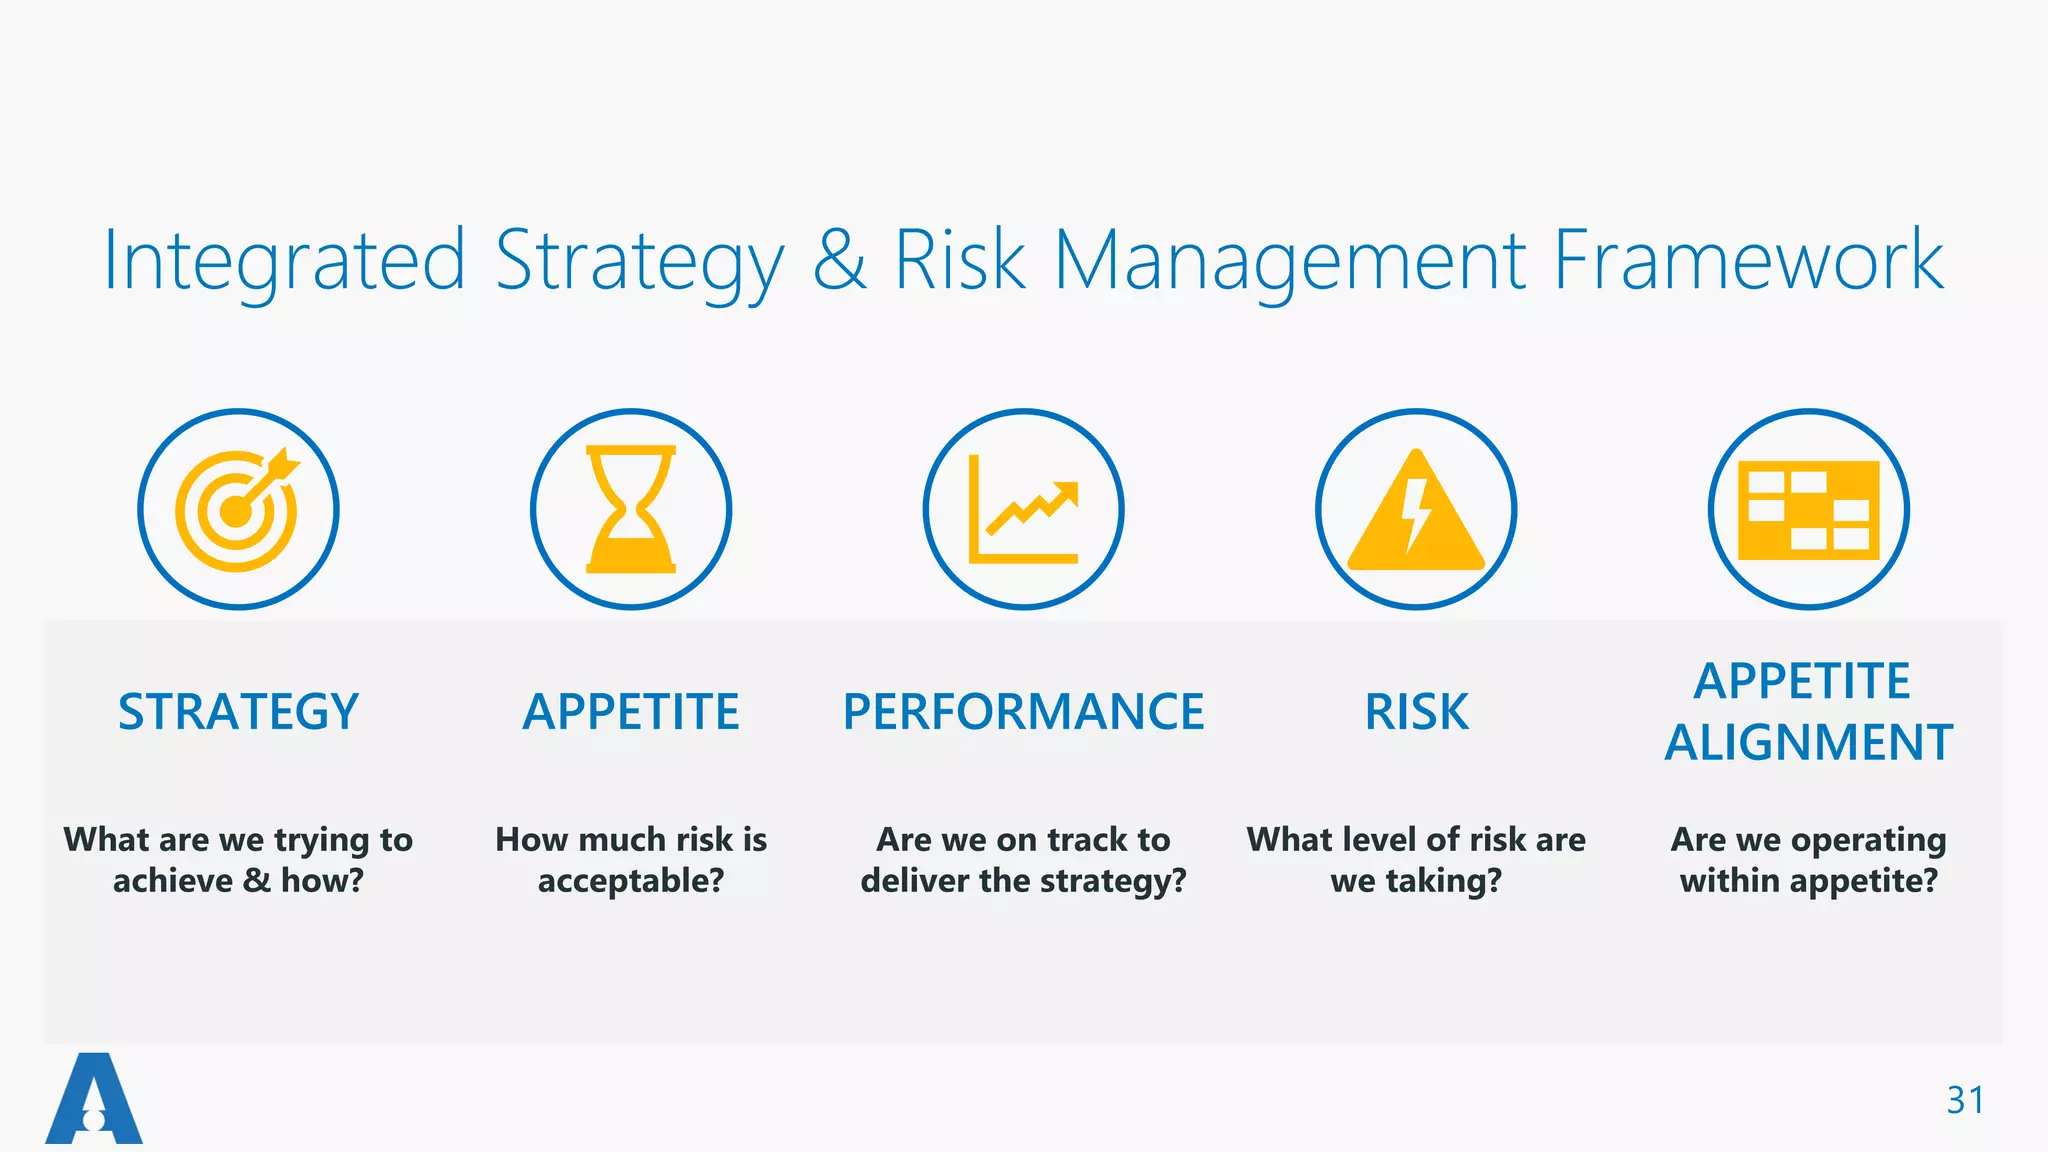


The document discusses the importance of integrating Risk and Control Self-Assessment (RCSA) into strategic planning and business strategies, especially for financial services facing increasing regulatory pressures. It emphasizes the need for better decision-making and accountability through a structured framework that aligns risk, strategy, and performance management. Key benefits of this approach include enhanced shareholder value, reduced operational losses, and improved risk management efficiency.


![Making Conduct Risk [Good] Business As Usual](https://cdn.slidesharecdn.com/ss_thumbnails/2013-11-01-makingconductriskgoodbusinessasusualv2a-131119112743-phpapp02-thumbnail.jpg?width=640&height=640&fit=bounds)


