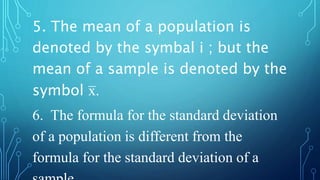
ROLE AND IMPORTANCE OF STATISTICS
IN ANALYSING ASSESENT DATA,
POPULATION AND SAMPLE
SUBMITED BY
ASWATHY M K
PHYSICAL SCIENCE
STATISTICS
Statistics is a
branch of mathematics dealing with the
collection, analysis, interpretation, presentation,
and organization of data.
ROLE AND IMPORTANCE OF STATISTICS
IN ANALYSING ASSESSMENT DATA
1.In the collection of evidences or facts (
numerical or otherwise)
2.In the classification, organisation and
summarization of numerical facts.
3.In drawibg general conclusionsand inferences
or making predictions on the basis of
particular facts and evidences.
NEEDS OF STATISTICS IN FIELD
OF EDUCATION
1.In the Construction and standardization
of various tests and measures.
2.In making proper use of the results of
various tests and measures.
3.To know individual differences of our
students.
4.To compare the suitability of one method of technique
or the other.
5.To compare the results of one system of evaluation with
the other.
6.To compare the function and working of one institution
with the other.
7.To make prediction regarding the future progress of the
students.
8.To make selection, ckassification and promotion of the
students.
Statistics is now
regardef as an indispensable
instrument in the field of
education, especially in
measurement or evaluation. In
education, it is very helpful to
the teachers in the proper
POPULATION AND SAMPLE
1.The main difference between a
population and sample has to do with
how observations are assigned to the
data set.
2.A population includes all of the
elements from a set of data and a sample
consists of one or more observations
3. Depending on the sampling method,
a sample can have fewer observations
than the population, the same number
of observations or more observations.
4. More than one sample can be
derived from the same population.
5. The mean of a population is
denoted by the symbal i ; but the
mean of a sample is denoted by the
symbol x̅ .
6. The formula for the standard deviation
of a population is different from the
formula for the standard deviation of a
Presentation (1)

Presentation (1)

  • 2.
    ROLE AND IMPORTANCEOF STATISTICS IN ANALYSING ASSESENT DATA, POPULATION AND SAMPLE SUBMITED BY ASWATHY M K PHYSICAL SCIENCE
  • 3.
    STATISTICS Statistics is a branchof mathematics dealing with the collection, analysis, interpretation, presentation, and organization of data.
  • 4.
    ROLE AND IMPORTANCEOF STATISTICS IN ANALYSING ASSESSMENT DATA 1.In the collection of evidences or facts ( numerical or otherwise) 2.In the classification, organisation and summarization of numerical facts. 3.In drawibg general conclusionsand inferences or making predictions on the basis of particular facts and evidences.
  • 5.
    NEEDS OF STATISTICSIN FIELD OF EDUCATION 1.In the Construction and standardization of various tests and measures. 2.In making proper use of the results of various tests and measures. 3.To know individual differences of our students.
  • 6.
    4.To compare thesuitability of one method of technique or the other. 5.To compare the results of one system of evaluation with the other. 6.To compare the function and working of one institution with the other. 7.To make prediction regarding the future progress of the students. 8.To make selection, ckassification and promotion of the students.
  • 7.
    Statistics is now regardefas an indispensable instrument in the field of education, especially in measurement or evaluation. In education, it is very helpful to the teachers in the proper
  • 8.
    POPULATION AND SAMPLE 1.Themain difference between a population and sample has to do with how observations are assigned to the data set. 2.A population includes all of the elements from a set of data and a sample consists of one or more observations
  • 9.
    3. Depending onthe sampling method, a sample can have fewer observations than the population, the same number of observations or more observations. 4. More than one sample can be derived from the same population.
  • 10.
    5. The meanof a population is denoted by the symbal i ; but the mean of a sample is denoted by the symbol x̅ . 6. The formula for the standard deviation of a population is different from the formula for the standard deviation of a